Volume 12 Issue 1 pp. 235-251 • doi: 10.15627/jd.2025.13
Sensitivity Analysis and Optimization of Facade Design to Improve Daylight Performance of Tropical Classrooms with an Adjacent Building
Atthaillah,a,* Rizki A. Mangkutob Andik Bintoroc
Author affiliations
a Architecture Program, Faculty of Engineering, Universitas Malikussaleh, Jl. Cot Teungku Nie, Aceh Utara 24355, Indonesia
b Built Environment Performance Engineering Research Group, Department of Engineering Physics, Faculty of Industrial Technology, Institut Teknologi Bandung, Jl. Ganesha 10, Labtek VI, Bandung 40132, Indonesia
c Electrical Engineering, Faculty of Engineering, Universitas Malikussaleh, Jl. Cot Teungku Nie, Aceh Utara 24355, Indonesia
*Corresponding author.
atthaillah@unimal.ac.id (Atthaillah)
rizkiam2002@itb.ac.id (R. A. Mangkuto)
andik@unimal.ac.id (A. Bintoro)
History: Received 1 January 2025 | Revised 14 February 2025 | Accepted 22 February 2025 | Published online 30 May 2025
Copyright: © 2025 The Author(s). Published by solarlits.com. This is an open access article under the CC BY license (http://creativecommons.org/licenses/by/4.0/).
Citation: Atthaillah, Rizki A. Mangkuto, Andik Bintoro, Sensitivity Analysis and Optimization of Facade Design to Improve Daylight Performance of Tropical Classrooms with an Adjacent Building, Journal of Daylighting, 12 (2025) 235-251. https://dx.doi.org/10.15627/jd.2025.13
Figures and tables
Abstract
This study examines the daylighting performance of a classroom with bilateral opening typology and an adjacent building on one side. The openings are located on the east and west sides of the classroom, with the adjacent building situated on the west side. The case selection is based on the observation that many Indonesian urban classrooms are often blocked from daylight by the adjacent building. Accordingly, this study examines the optimal design for annual visual comfort and daylighting performance criteria for such cases, which are prevalent in the tropical regions of Indonesia. To achieve this, computational simulation was conducted. The model was constructed using Ladybug Tools, while the annual visual comfort and daylight simulation was performed simultaneously using Radiance under Grasshopper. Sensitivity analysis was conducted to identify the most significant façade design variables, including external horizontal shading depth, shading elevation, window-to-wall ratio (WWR), and distance to the adjacent building on a bilateral opening typology classroom. The most optimal design was obtained from multilinear regression prediction model based on 5,731 simulation samples. The three most influential design variables on the annual visual comfort and direct sunlight are the horizontal shading depth, shading elevation, and WWR on the east facade. The optimal design solution for the horizontal shading depth, shading elevation, and window-to-wall ratio (WWR) on the east and west façades have similar values of 2.6 m, 2.7 m, and 10%, respectively. The distance to adjacent buildings is recommended to be maintained at 0.5 m from the edge of the external shading on the west side.
Keywords
Daylighting, Sensitivity analysis, Optimization, Facade design
1. Introduction
The growth of the world population and the intensification of urbanization have resulted in the narrowing of urban spaces, a phenomenon that is further compounded by the increasing density of these urban areas. Furthermore, the contemporary global context is characterized by the dual challenges of climate change and the energy crisis. It is therefore imperative that mitigation efforts be made in every sector of development, including building planning and design. The building sector is responsible for 30% [1] of the total energy consumption globally. Consequently, energy conservation efforts in buildings can have a significant impact on overall energy consumption. If the objective is to reduce energy consumption in buildings, then minimizing infiltration, such as openings, is one of the strategies that can be employed. However, it is essential to consider the human aspect of energy consumption in buildings, as humans are the building occupants who also require healthy and comfortable indoor environment.
One essential aspect for healthy and comfortable human habitation in buildings is the provision of daylighting. Since the advent of electric lighting technology in the 1970s, a considerable number of buildings have replaced daylighting with such technology. However, the excessive use of electric lighting not only increases the energy consumption but also has an adverse effect on the health of building occupants. In terms of energy savings, daylighting has the potential to contribute 40% to 45% of the total building energy saving [2,3]. The primary driver of this energy consumption is the building envelope or façade design, which accounts for 71% of the total energy usage, compared to other contributors such as occupants, electronic equipment, and electric lighting [4]. This highlights the significance of building façade design in reducing energy consumption. By prioritizing this aspect, efforts to conserve energy in buildings can be more effectively implemented.
Furthermore, the introduction of daylight can also enhance the building occupant’s performance. This phenomenon is associated with physiological and biological factors, including a reduction in melatonin production, which contributes to enhanced focus, elevated mood, reduced depression, improved immunity, and enhanced blood circulation [5–8]. A recent study indicated that inadequate lighting uniformity in a classroom setting may contribute to the development of myopia among students [9]. It is evident that appropriate daylighting design can contribute to an improvement in the productivity of the users.
The proliferation of buildings in urban environments, coupled with population growth, results in a notable increase in the density of urban areas, creating challenges in the planning and design of buildings that are energy-efficient and adhere to annual daylight standards. The presence of a tropical climate, characterized by consistent solar exposure throughout the year, can potentially present a significant obstacle in the building construction. Without the implementation of appropriate measures, this could lead to overheating and visual discomfort for building occupants due to prolonged exposure to excessive solar radiation.
Mitigation efforts have been undertaken regarding the evaluation of energy conservation through daylighting utilization in various geographical locations and building typologies. An effort has been made to optimize design parameters for optimal annual daylight and energy in Iran [6]. The classroom under examination exhibited a typology of unilateral openings and a room dimension of 7 m × 10 m. The findings indicate that an increased number of windows is associated with lower daylight autonomy (DA) and daylight glare probability (DGP) values. In light of these outcomes, the utilization of tripled glass is advised in accordance with the climatic conditions prevailing in Iran. Subsequently, window-to-wall ratio (WWR) plays a pivotal role in determining the energy required for heating and cooling the room, with outcomes sensitive to UDI and DA results and the electric lighting energy use. Concurrently, the role of orientation is of paramount importance in determining direct solar contribution, which can also influence the visual and thermal comfort of the building occupants.
Another study was conducted to assess the suitability of internationally available daylighting metrics according to the Italian standard, UNI 108840:2000, for school buildings [10]. The results identified critical conditions with low and very low performance of the daylighting inside the classrooms. Contextual factors, such as the proximity of trees to classrooms and the inappropriate use of blinds in classrooms, were identified as contributing to these deficiencies.
Moreover, a series of simulations, experiments, validations, and optimizations were conducted in an office space in Malaysia, which has a tropical climate [5]. The findings indicated that the optimization outcomes could enhance the indoor daylighting performance, particularly when employing the useful daylight illuminance (UDI) metric. Subsequently, a study was conducted in a Mediterranean climate on a public school in Algeria [11]. The findings of this study indicate that a WWR value of 30% is relevant and appropriate for implementation in all public schools. The optimal orientation for Algeria with a bilateral aperture class typology is situated on the northwest-southeast axis, while the north-south axis necessitates the incorporation of external shading. Ultimately, the investigation of daylighting in multi-story residential structures in Iraq [12] revealed that the plan typology has a considerable impact on the optimal daylighting admission into rooms within multi-story buildings.
Furthermore, the implementation of a terraced classroom equipped with a skylight is recommended for the post-covid context in Guangzhou, China. The classroom was optimized for spatial daylight autonomy (sDA), annual sunlight exposure (ASE), and daylight uniformity within the classroom. The study showed that the terrace can significantly improve daylighting and visual comfort, while the skylight contributes to the uniformity of daylight [13]. Another study evaluates the daylighting performance of a classroom for different climates in China. The findings indicate that the classroom deflection angle, set at an angular displacement of 5° from the east and west of the south, is beneficial to the improvement of daylight performance and energy efficiency within the classroom. Furthermore, a range between 50% and 70% of WWR is deemed optimal for hot climate zones in China, ensuring optimal daylight performance within the classroom [14]. Furthermore, a study conducted in a Mediterranean climate examined the integration of waste-based louvres in a school classroom. The study identified the optimal parameters for daylighting performance (UDI metric) and visual comfort (ASE metric) for the louvres. These parameters included a distance of 7 cm from the façade, a blade angle of 0°, and a slat spacing of 21 cm. The optimal solution has been demonstrated to be capable of minimizing glare and overheating in the classroom [15].
In more recent times, annual daylighting studies conducted in Indonesia have focused on the design of classroom facades [16–18]. These studies have revealed that shade elevation represents the most significant variable in determining the annual daylighting performance of classrooms. Furthermore, follow-up studies [19,20] have demonstrated that classroom designs incorporating external shading and asymmetrical openings can enhance the annual daylighting performance of classrooms within the region. However, these studies were all conducted without considering the existence of surrounding context.
Among the preceding studies, only the Italian study indicated that context is a significant factor in determining daylighting performance in classrooms. In contrast, other studies have concentrated on the role of building shading elements and openings (WWR) [16,17,19]. Those studies on daylighting in classrooms in Indonesia's tropical climate did not identify the influence of building context as a variable that can determine the annual daylighting performance of classrooms. Furthermore, the interaction between external shading design and the presence of building context in tropical climates remains poorly understood. This research, therefore, aims to investigate the optimal classroom design for the annual daylighting aspect of buildings in the tropical climate of Indonesia for a passive design classroom, considering both the façade design and the presence of building context, as observed in the cases of classrooms located in dense urban areas (Fig. 1).
Figure 1
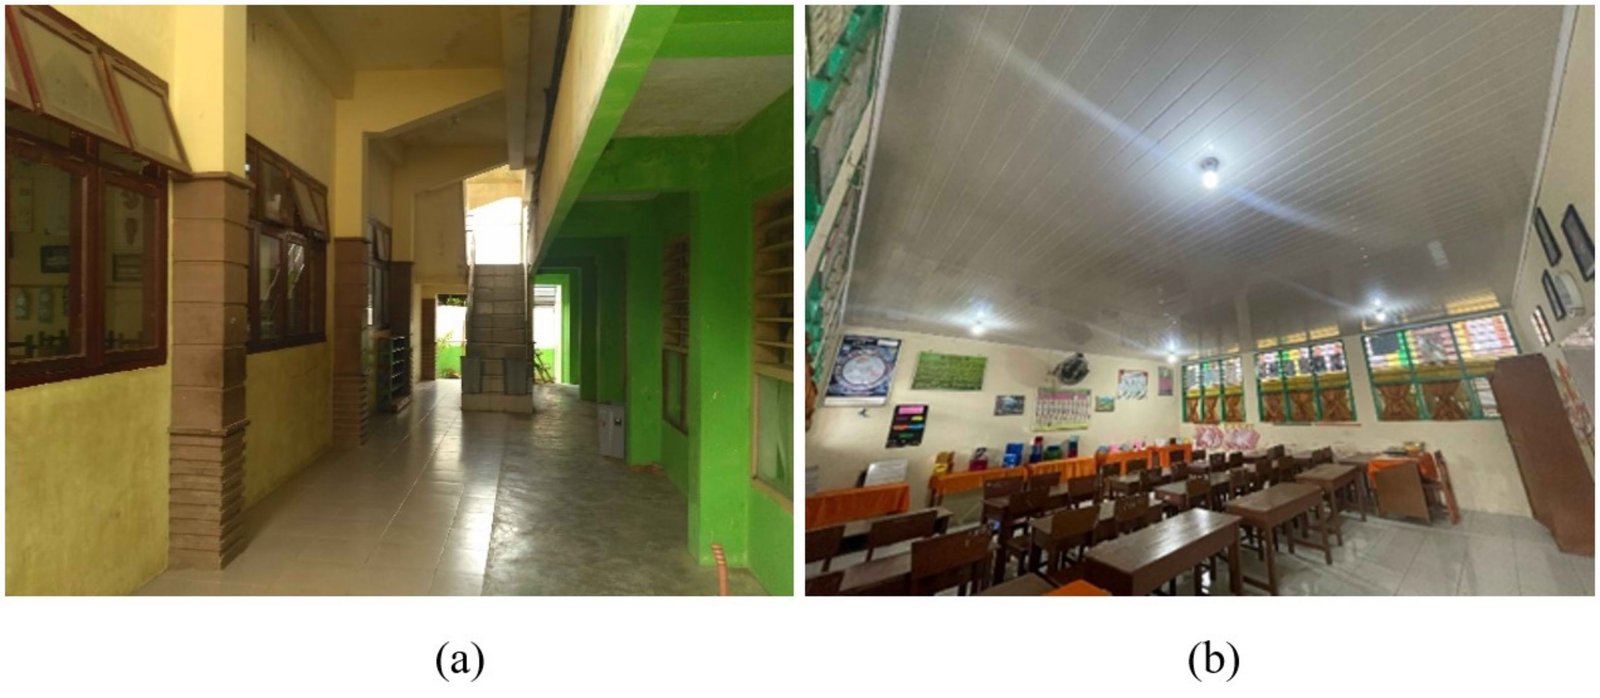
Fig. 1. Illustration of the classroom with the presence of the building context (a) exterior view of the classroom on the left with the context building on the right, and (b) interior of the classroom with the building context on one of the window sides.
In order to accommodate the microclimate variations that are of great importance in the context of building design, this study investigates the annual visual comfort and daylight with metrics that can represent total and direct daylighting conditions. These conditions are of great importance to consider, especially when considering the surrounding building conditions. This research also addresses a significant gap in the existing literature by providing a comprehensive study on the building context for classrooms with bilateral opening typology in tropical climates. The research approach employed in this study involves the use of advanced computational simulation techniques, a topic that is extensively discussed in the subsequent section. The optimization model developed in this study is a regression model constructed using simulation results for annual visual comfort and daylighting metrics. This approach is novel in its significant reduction of optimization time and application simplicity.
The information flow in this work is outlined as follows. Section 1, entitled "Introduction," is an exposition of the research overview and previous studies, with the objective of elucidating the research gap. Section 2, entitled "Method," methodically explains on all necessary procedures. Section 3, entitled "Results," provides a thorough explanation of the findings. Furthermore, Section 4, entitled "Discussion," engages in a discourse on the knowledge derived from this study. Lastly, Section 5, entitled "Conclusion," offers a summary to this work.
2. Method
This study employed computational simulation to perform annual daylight calculations. First, statistical sampling was conducted using the Latin Hypercube Sampling (LHS) method. Second, the case study description which described the classroom, shading and its context. Third, computational modelling was performed using the Ladybug Tool (LBT) toolset, which was converted to a Radiance (RAD) model parametrically under the Grasshopper (GH) environment. Fourth, annual daylight simulation was conducted using the RAD, which is a validated simulation engine [21–25]. As this study represents a further development of the previous investigation, the validation processes for the modelled classroom have been conducted elsewhere, which included real-time classroom measurement [17], analytical verification [16], and laboratory validation [20]. Fifth, a sensitivity analysis was performed using the standard regression coefficient (SRC) value. Sixth, the correlation analysis to understand between input-input and input-output linear relationship. Lastly, a genetic algorithm optimization was conducted with Galapagos under the GH environment to obtain the optimum design solutions. The overall method employed in this study is illustrated in Fig. 2.
Figure 2

Fig. 2. The method procedure in this study.
2.1. Sampling
The data sampling was conducted using LHS through the Python libraries, specifically the NumPy and SciPy modules for the input variables. LHS is a statistical method for generating a sample of parameter values from a multidimensional distribution that is approximately as random as possible. The sampling was selected from 7.3% of the total data set (a total of 5,731 samples were obtained from a population of 78,125). The 7.3% sampling was selected due to the constraints imposed by the time and hardware limitations inherent to the simulation process in this study. The data set with the most normal distribution was selected for further evaluation in this study. This approach ensures that the data set can reliably represent the entire population. Also, outliers were also excluded from the analysis. This study referred to 78,125 data points for LHS sampling (Fig. 3).
Figure 3

Fig. 3. Values of the reference input variables. The X3 and X6 values are converted to decimal (0~1).
2.2. Case study description
This study employed the city of Lhokseumawe, Indonesia (5°10'0" N, 97°8'0" E, 2~24 m above sea level) as the reference location for annual daylight simulation. The dimensions of the classroom were based on the regulations set forth by the Ministry of Education of Indonesia for elementary school classrooms, which specify a size of 7 m × 8 m × 3.5 m [26]. The higher window elevation (Fig. 4) is selected based on the recommendation from the previous studies [17,20,27]. The building context has been defined as eight meters in height and has therefore been assumed to represent a two-story building in the west side of the classroom (Fig. 4). The classroom model was that of a single-loaded classroom, which permitted the construction of corridors around the classroom. This classroom model is widely adopted in some tropical countries [18,26,28,29]. In this study, the building height was defined as a fixed input variable, as it was not a variable that could be modified by the building designer during the design process. The full list of input variables evaluated for optimization in this study is presented in Table 1.
Figure 4

Fig. 4. The modeled classroom and the adjacent building, with window facades located on the east and west sides of the classroom. The input variables are labeled X1 through X7.
Table 1

Table 1. Input variables for optimization purposes.
2.3. Modeling
The classroom and its adjacent building were modeled utilizing LBT components. Meanwhile, the context was modeled utilizing GH component that was later converted to LBT object to proceed with RAD simulation. All geometry conversions from LBT to RAD was parametrically performed in the background under the GH environment.
In addition, for RAD material setting is shown in Table 2. The surface reflectance was not included as a dynamic input variable since the preceding study demonstrated that when integrated with input variables such as self-shading devices, surface reflectance did not emerge as the most influential input variable [17]. The self-shading devices can be associated with the feature ability to provide shade, such as the ability of horizontal shading on the building façade. Furthermore, an additional study demonstrated that internal reflectance was not a significant input variable in annual daylight metrics [30]. Accordingly, all input variables in this study were identified as the most significant, having previously been demonstrated as the most influential, particularly in the context of the classroom with a bilateral opening typology [16,19].
Table 2

Table 2. RAD material setting for simulation.
Next, the measurement points were positioned at 0.5 m from the perimeter wall of the classroom. For the annual daylight availability simulation, the sensors were elevated by 0.75 m from the classroom floor. This elevation is consistent with the standard table height in an Indonesian elementary school classroom [26]. Meanwhile, for the annual visual comfort calculation, the sensors were elevated by 1.2 m above the floor level. The measurement grid was set at a size of 0.5 m × 0.5 m for both the annual availability and visual comfort calculation. Fig. 5 illustrates the measurement grid setup employed in this study.
Figure 5

Fig. 5. Measurement grid set up.
2.4. Simulation
In this study, the classroom occupancy was evaluated over the course of a year, spanning from 8:00 a.m. to 5:00 p.m. each day, resulting in a total of 3,650 hours of years (hoys). The annual weather condition is represented by the irradiance values (W/m2) as utilized in the daylight simulation, depicted in Fig. 6.
Figure 6

Fig. 6. The annual (a) direct normal irradiance (DNI), (b) diffuse horizontal irradiance (DHI), and (c) global horizontal irradiance (GHI) in Lhokseumawe.
Furthermore, RAD utilized rcontrib module for the annual daylight simulation, which implemented Monte-Carlo backward raytracing algorithm that applied probabilistic sampling to solve simulation problem [17,31]. Furthermore, LBT 1.8.0 (version used in this study) employed a modified dynamic daylight simulation matrix method that was originally implemented within the HB [+] [32,33]. For annual daylight simulation, the approach assumed the presence of sunlight within the analemma, which indicated the real sun position throughout the year, alongside with the Tregenza sky vault that consisted of 145 sky patches [34]. The original Tregenza sky model assumed the sun position in the center of the sky patches, which was problematic for simulating direct sunlight inside the space since the sun’s position was not in a real position in the sky [35]. This is to say that the sun’s position in this study is independent from the sky discretization, which return a more accurate annual daylight simulation, particularly considering the sunlight contribution. The RAD simulation parameters for the annual daylight simulation using rcontrib [35,36] are shown in Table 3. In addition, the ambient bounces (-ab) and ambient divisions (-ad) flags of 6 and 25,000 are deemed suitable to ensure the accuracy of the result while maintaining a reasonable computational time [23,35]. Concurrently, the limit weight (-lw) at least satisfied the inverse of -ad multiplied by 0.01 [35]. This study established a lower value to ensure precision without significantly extending the simulation time. The sunlight contribution metric (i.e., ASE1000,250) is automatically converted by LBT into the black scene (-ab=1) and black analemma (-ab=0) [17].
Table 3

Table 3. Radiance simulation parameters for annual daylight simulation.
From the simulation result, this study calculated both visual comfort and daylight availability metrics as performance indicators, all of which were based on annual evaluation criteria. Visual comfort metric in this study was the spatial glare autonomy (sGA04/95%) value, which is a derived from the daylight glare probability (DGP) [37], which was initially proposed by [38]. The DGP is defined in Eq. (1).
where Ev is the vertical illuminance on the observer’s eye, Ls,i is the source luminance, is the solid angle, and Pi is the Guth position index. For the glare autonomy (GA) calculations, the Ev and Ls are defined in Eqs. (2) and (3).
where k is the luminous efficacy of 179 lumens per watt. Dtotal is the vector of the daylight coefficients for all areas of the sky and S is sky luminance vector of all sky patches at a given point in time.
where ddirect represents daylight coefficient of only the direct component for sky patch i, si represents sky luminance value of sky patch i at a given time. In this way, RAD’s rcontrib function can calculate annual glare, which is represented with GA metric [38]. Every sensor is evaluated for eight view directions. Thus, sGA0.4/95% can be calculated as in Eq. (4).
where \(A_{GA0.4\geq95\%}\) is the number of sensor(s) where the GA with DGP value ≤ 0.4 with ≥ 95% of time annually.
Next, the direct sunlight is represented by the annual sunlight exposure (ASE1000,250) with the threshold value of originally ≤ 10% [39,40] and later updated to ≤ 20% [41]. This metric is defined in Eq. (5). Meanwhile, Atotal is the total sensors available within a space.
where \(A_{{s_E}_{1000lx\geq250h}}\)is the number of sensor(s) where the direct illuminance value under the black room condition is ≥ 1000 lux for at least 250 hours in a year.
Furthermore, daylight availability is represented by the following daylight metrics. Firstly, spatial daylight autonomy (sDA300/50%) is a daylight availability metric based on the daylight autonomy (DA) value with the threshold of 300 lux or above [39,41,42]. The sDA300/50% is defined in Eq. (6).
where the number of sensor(s) exhibiting DA with the illuminance threshold of 300 lux in at least 50% of the occupied time.
Secondly, the useful daylight illuminance (UDI) was originally proposed by [43,44] and mathematically defined in Eqs. (7) to (9) for the designated range (100~3000 lux), underlit (< 100 lx) and over lit (> 3000 lux) conditions.
where t represents the number of times that the designated illuminance ranges are satisfied in a given sensor or measurement point, while T denotes the total evaluation hours annually.
Lastly, an alternative illuminance range of 250~750 lux was proposed for UDI in tropical classrooms by previous studies [16,17,19,20]. Eqs. (10) to (12) define the UDI for the designated illuminance range, underlit dan over lit conditions for the alternative illuminance range.
In this study, the UDI metric calculation results are then spatially averaged to yield the following categories: aUDI100-3000lx, aUDI<100lx, aUDI>3000lx, aUDI250-750lx, aUDI<250lx, and aUDI>750lx. The objective of presenting all of the equations is to ensure that the intended meaning of each metric utilized in this study is as clear as possible. The calculation of all metrics was conducted within the GH environment, with the LBT components providing support throughout the process (Fig. 7). Furthermore, Fig. 7 provides a visual representation of the GH algorithm, which was utilized in the execution of all modeling and simulation processes in this study.
Figure 7

Fig. 7. GH definition for modeling and simulation in this study.
2.5. Sensitivity analysis
A sensitivity analysis is conducted by observing the standardized regression coefficient (SRC) value of each performance metric against all input variables (X1-X7). The range of SRC values is –1 to +1. A negative value indicates a negative trend, whereby an increase in the value of the input variable results in a corresponding decrease in the output value. The opposite condition applies in the case of positive trends. Given that the variables have diverse units, it is necessary to standardize the input and output variables, as in Eqs. (13) and (14), respectively.
where \(X_{ji}^\prime\) represent the normalized j-th input variable of the i-th variation, \(X_{ji}\) represents the original j-th input variable of the i-th variation, \({\bar{x}}_J\) is the average of the j-th input variable, and \({\sigma_X}_j\) is the standard deviation of the j-th input variable.
where \(Y_i\prime\) represents the standardized output variable, \(Y_i\) denotes the i-th original output variable, \(\sigma_Y\) is the mean value of the output variable, and \(\bar{y}\) is the standard deviation of the output variable. Next, the SRC score was calculated based on Eq. (15).
where εi represents the residual error or intercept, q denotes the number of input variables, and n signifies the number of variations within each input variable.
2.6. Correlation analysis
In this study, Pearson correlation was utilized to understand the linear relationship between the input-output and output-output through a numpy module of Python. The Pearson’s correlation was performed to understand intervariable parametric correlation. The value ranges between –1 and +1, where a positive number indicates that an increase in one variable results in an increase in the other variable. Conversely, a negative number denotes that an increase in one variable results in a decrease in the other variable.
Furthermore, in order to ascertain the impact of multiple input variables on visual comfort and daylighting metrics, a multiple linear regression (MLR) calculation was conducted. The model is deemed robust if the R2 value is ≥ 0.8, as this indicates a strong correlation between the input variables and the visual comfort and daylighting metrics. Otherwise, further performance metric interrelationships were observed for correlation scores of ≥ 0.80. The subsequent strong correlation observed for the generation of the previously missing prediction model from the preceding procedure. This approach allows for the generation of a prediction model for all visual comfort and daylight performance metrics. Subsequently, the model is useful for optimization purposes, as discussed in the following section.
2.7. Optimization
The study employed the prediction model derived from MLR and simple linear regression (SLR) to achieve the optimal design solution. This approach enables the prediction and subsequent sorting of all design combinations for the most optimized design solution in accordance with the specified objective. The objective for optimization is delineated by Eq. (16), with the optimal design option defined as the one with the highest objective value (maximum of Z).
This study utilized a genetic algorithm embedded in the Galapagos, which is the default optimizer under GH, for the optimization. In genetic algorithm, the natural evolutionary mechanisms of selection, crossover, and mutation are employed. The optimal option is assessed based on the highest feasibility in each generation. If it is not deemed final, the option with the best feasibility is selected randomly and then the natural evolution process is carried out again until the final solution is found in a generation. Therefore, the final option is considered the most viable optimum because it has passed a series of selection, crossover, and mutation processes [45]. The optimization result was established from the MLR and SLR predictions. Within the Galapagos, the maximum fitness value of Z was targeted. Table 4 shows the genetic algorithm setting utilized in this study.
Table 4

Table 4. Galapagos setting for optimization.
3. Result
3.1. Sampling
Fig. 8 illustrates the selected sampling methodology employed in this study. A series of LHS operations were conducted until the input variables exhibited a normal distribution. As illustrated in Fig. 8, X1, X2, X4, and X5 were identified as having normal distribution data, while the remaining variables demonstrated non-normal distribution. This outcome was attributable to the constraints imposed by the LHS randomization process, as detailed in the method section. The data presented represent the upper bound of the normal distribution, given the parameters of this particular work. Next, the chosen sampling data ranges are illustrated in Fig. 9. In comparison to the reference data, LHS generated a broader range of data for all variables, resulting in the data composition displayed in Fig. 8. The data selection was subsequently employed for the purposes of visual comfort and daylighting simulation.
Figure 8

Fig. 8. Sample data profile for each input variables (X1-X7).
Figure 9

Fig. 9. Values of the sample input variables and X3 and X6 values are converted to decimal.
As illustrated in Fig. 8, the data sets X2 and X5 exhibit an approximate normal distribution, as evidenced by the presence of multiple peaks. The approximate normal distributions are indicated by p-values exceeding 0.05, with a near-zero skewness (X2 = 0.0087, X5 = 0.0343) and kurtosis (X2 = 0.0302, X5 = 0.0987). Additionally, the multiple peaks in X2 and X5 are correlated with a cluster of values within the datasets. This phenomenon occurred due to the data randomization constraint, as previously outlined in the method section.
3.2. Simulation
As illustrated in Fig. 10, the simulation results indicated that the two metrics, sDA300/50% (Y3) and aUDI100-3000lx (Y4), were the most effective in identifying values exceeding the established thresholds (sDA300/50% > 55% and aUDI100-3000lx > 80%). Subsequently, the ASE1000,250 (Y2) metric indicated that most of the samples had satisfied the criterion of ≤ 20%. This indicated that, in most cases, the direct sunlight contribution within the classroom was not a significant issue.
Figure 10

Fig. 10. Simulation results from sample data for the annual visual comfort and daylighting metrics.
However, when the annual visual comfort metric, represented by sGA0.4/95% (Y1), was considered, it was found that most of the designs under investigation did not satisfy the specified criterion (sGA0.4/95% ≥ 95%). As was the case with aUDI250-750lx (Y7), no cases met the requisite threshold (aUDI250-750lx ≥ 80%). This condition indicated that most design options may experience challenges with regard to visual comfort, particularly due to the lack of daylight uniformity inside the classroom. The aUDI250-750lx (Y7), which has a shorter range, can be used as a representative to observe the uniformity inside the classroom. If the value is low, as indicated in this study, it can be inferred that the space lacks uniformity, which in turn causes a visual comfort problem.
3.3. Sensitivity analysis
Results of the sensitivity analysis, based on the available data, indicate that the context-to-classroom distance has no discernible impact on the evaluated performance metrics, including daylighting, direct sunlight, and annual visual comfort, within the tropical climate of Indonesia, as exemplified by the city of Lhokseumawe. In this case, the SRC value of X7 is consistently low across all tested metrics (Y1-Y9) (Fig. 9(a)-(i)). This finding contrasts the results of previous research, which indicated that context plays a significant role in the presence of daylighting in classrooms [10].
In accordance with the findings of previous studies, elevation and depth of shading are among the input variables with considerable influence on annual daylight metrics [16,19]. In line with the previous studies, this investigation yielded similar results for several metrics, including the visual comfort (Y1 or sGA0.4/95%, Fig. 11(a)), direct sunlight contribution (Y2 or ASE1000,250, Fig. 11(b)), daylight availability in the ranges of 100-3000 lux (Y4 or aUDI100-3000lx, Fig. 11(d)), and greater than 3000 lux (Y6 or aUDI>3000lx, Fig. 11(f)).
Figure 11

Fig. 11. Standardized regression coefficient (SRC) values of the input variables for (a) Y1 (sGA), (b) Y2 (ASE1000,250), (c) Y3 (sDA300/50%), (d) Y4 (aUDI100-3000lx), (e) Y5 (aUDI<100lx), (f) Y6 (aUDI>3000lx), (g) Y7 (aUDI250-750lx), (h) Y8 (aUDI<250lx), and (i) Y9 (aUDI>750lx).
Furthermore, X3 or WWR on the east side shows as one of the most influential input variables on almost all evaluated performance metrics except metric Y3 (Fig. 11(a)-(i)). Variable X6 or WWR on the west side, which is obstructed by the building context, significantly influences metrics with lower illuminance values, e.g. Y5 or aUDI<100lx, Y7 or aUDI250-750lx, Y8 or aUDI<250lx, and Y9 or aUDI>750lx. This is in line with previous studies that found WWR to be one of the influential variables on annual daylight metrics [11,30].
As illustrated in Figs. 11(a) and (b), the metrics of visual comfort and annual direct sunlight contribution are sensitive to changes in the input variables on the east side (X1-X3). This suggests that to achieve visual comfort conditions and prevent annual direct sunlight exposure in classrooms, the façade design should be carefully considered in terms of these variables. This is because an inappropriate alteration in the values of these variables may result in sub-optimal conditions for the teaching and learning process.
3.4. Correlation analysis
Most of the correlations between the input and output variables are weak. However, there is a moderate correlation between X3 (WWR on the east facade) and most of the output variables (Fig. 12). This suggests that a univariate approach to define the evaluated metrics is not viable.
Figure 12

Fig. 12. Correlation matrix between input and output variables.
Subsequently, further multivariate regression was conducted to elucidate the influence of the input variables on the performance metric under evaluation in this study. From the MLR, it was found that the strongest linear model is the prediction model for sGA0.4/95% (R2 = 0.91), as shown in Fig. 13a. The ASE1000,250 metric has a robust model with an R2 value of 0.85 (Fig. 13(b)). In addition, only two daylight availability metrics have a strong model: aUDI>3000lx and aUDI<250lx, with R2 values of 0.82 (Fig. 13(f)) and 0.80 (Fig. 13h), respectively. The remaining metrics are not regarded as robust prediction models due to low R2 values (< 0.80).
The strong MLR prediction models from Fig. 13(a), 11(b), 11(f), and 11(h) are described in Eqs. (17) to (20) as follows.
Figure 13

Fig. 13. MLR model for visual comfort and daylight availability metrics, the prediction model for (a) sGA0.4/95%, (b) ASE1000,250, (c) sDA300/50%, (d) aUDI100-3000lx, (e) aUDI<100lx, (f) aUDI>3000lx, (g) aUDI250-750lx, (h) aUDI<250lx, and (i) aUDI>750lx.
From Figs. 10 and 13, it is evident that the sDA300/50%, in most instances, is the only metric that attains the maximum value. Consequently, the necessity for a predictive model is obviated in most cases, as the sDA300/50% already reaches 100% in nearly all instances (Figs. 10 and 13). Moreover, as illustrated in Fig. 13, the prediction models for the remaining metrics with weak R2 in the MLR models warrant further investigation. The metrics that have not been subjected to predictive modelling include aUDI100-3000lx (Y4), aUDI<100lx (Y5), aUDI250-750lx (Y7), and aUDI>750lx (Y9). From Fig. 14, aUDI100-3000lx (Y4) has a strong correlation (–0.96) with aUDI>3000lx (Y6). In contrast, the remaining metrics (Y5, Y7, and Y9) demonstrate robust correlations with aUDI<250lx (Y8), with correlation coefficients of 0.97, 0.95, and –0.97, respectively. Thus, all the predictive models have been obtained for the optimization purpose. The subsequent SLR models for these metrics are illustrated in Figs. 15(a)-(d).
Figure 14

Fig. 14. Correlation matrix between every output variable.
Figure 15

Fig. 15. Prediction models for (a) aUDI100-3000lx, (b) aUDI<100lx, (c) aUDI250-750lx, and (d) aUDI>750lx.
Fig. 15 indicates strong prediction models for aUDI100-3000lx (Y4), aUDI<100lx (Y5), aUDI250-750lx (Y7), and aUDI>750lx (Y9) (R2 ≥ 0.90). Considering the Eqs. (17) to (20), as also illustrated in Fig. 15, it is possible to construct prediction models for all the performance criteria employed in this study. The prediction models are utilized for optimization in the following section.
3.5. Optimization
Table 5 presents the ten optimal design solutions ranked by their objective (Z) values. It can be observed that, apart from the top or first-rank solution, all design options suggest asymmetrical bilateral solutions for the façade. In contrast, the first-rank solution suggests a symmetrical configuration for the façade design and the bilateral openings. Additionally, as evidenced in Table 5, the degree of uncertainty is minimal (CV = 0.01), indicating that any alterations to the input variables have a negligible impact on the Z value, provided that the range of the input variables falls within the values displayed in Table 5.
Table 5

Table 5. Top 10 optimum solutions.
Furthermore, the symmetrical bilateral façade represents the optimal solution, as evidenced by a smaller WWR value (10%) compared to previous findings (13% to 19%) for similar cases without a context building [20]. With regard to the horizontal external shading, the depth and elevation values on the east façade (X1 and X2) indicated a high degree of similarity across the majority of the top ten optimal solutions. In this study, the deeper and lower elevation of the shading depth is deemed preferable for both facades, which is consistent with the previous finding for the classroom, which has no adjacent building [16,19]. As evidenced by the findings of the sensitivity analysis (Fig. 11), the input variables on the east side of the classroom have the stronger influence. Therefore, a careful modification of these variables is necessary, as a minor adjustment could result in a significant change in the output variables.
Meanwhile, on the west façade of the classroom, a more flexible alteration can be implemented, given that the sensitivity analysis indicates that the output variables are not sensitive to changes in the input. Nevertheless, the aUDI<100lx, aUDI250-750lx, aUDI<250lx, and aUDI>750lx values exhibit moderate sensitivity to the WWR on the west side (X6). The west façade WWR (X6) exhibits a narrower range, spanning from 10% to 13%. This is comparable to the shading elevation (X5), which also has a limited range of 2.7 m to 2.9 m. Additionally, the horizontal shading depth (X4) exhibits a broader range, spanning from 2.3 m to 2.6 m. Lastly, the distance to the adjacent building (X7) has a value range of 0.5 m to 0.9 m. This indicates that a shorter distance to the context building is the most preferred. Also, the adjacent building on the western facade acts as a barrier of direct sunlight exposure into the classroom.
4. Discussion
This study has investigated the visual comfort and daylighting performance of a classroom with a one-sided context or adjacent building. It is assumed that the adjacent building is located on the west façade of the classroom. This scenario has been selected due to its relevance for situations in which the west façade may be exposed to direct sunlight in tropical climates. Therefore, it is advisable to implement a barrier on the west side in order to avoid excessive solar exposure and associated heat gain. Furthermore, the one-sided adjacent building was selected based on the observation that the majority of the classrooms are situated around a central courtyard [18,28], which is also in accordance with the standard regulations for school design in Indonesia [26]. The east-west window façade orientation has been selected as a reference orientation for a topical classroom, as previously suggested in relevant studies [19,20].
The results demonstrate that all sample design cases have satisfied the two climate-based daylight requirement metrics, namely sDA300/50% [46] and aUDI100-3000lx [21]. Furthermore, a significant proportion of cases have also complied with the ASE1000,250 threshold [46], suggesting that most cases of the classrooms have been free from direct sunlight exposure. In contrast, majority and all of the design cases failed to comply with the requirement of annual visual comfort metric (sGA0.4/95%) and annual daylight metric with short illuminance range (aUDI250-750lx), respectively. The aUDI250-750lx is most likely to have a higher uniformity, which may reduce the risk of glare occurrence. As demonstrated by prior research, the presence of glare may adversely affect students' well-being and academic performance [7,8,47–49]. In accordance with this understanding, the classroom setting employed in this study suggests that optimal design parameters be followed (Table 5). In this study, the correlation between these two metrics is moderate with a correlation score of 0.69, as depicted in Fig. 14. These findings have not been in identified in the previous similar studies in the tropics [16,18–20,28,29].
The sensitivity analysis has revealed that certain input or façade design variables, such as the horizontal shading depth and its elevation and WWR on the east facade, have a significant influence on the performance metrics. Conversely, the distance to the adjacent building, within the bilateral opening typology classroom with one-sided adjacent building that is higher than the classroom in tropical climates, has been found to be less influential. This suggests that the performance metrics evaluated in this study are not sensitive to changes in this variable. It can be reasonably inferred that the daylight influx from the east façade significantly contributes to the overall daylight availability within this specified classroom space in this study. In contrast, some previous studies acknowledge the significant influence of context on the daylight availability inside the space [10,50].
Next, results of the correlation analysis indicated no strong correlation between the input and output variables (Fig. 12). Consequently, this study proceeded to investigate a robust correlation through the utilization of multivariate regression method (Fig. 13(a), (b), (f), and (h)). A further investigation was conducted to ascertain the correlation between each performance metric. This was done to develop a model for the metrics that had not yet demonstrated a strong correlation in the preceding stages. The MLR model for the annual visual comfort metric (sGA0.4/95%) has not been identified in previous studies as a comparable approach [50]. Also, the MLR models indicate that the performance metric can only be objectively justified based on the configuration of the various input variables, as demonstrated in this study.
The genetic algorithm optimization, based on the top ten optimum solutions, demonstrates that the east façade design configurations, including the horizontal shading depth, elevation and WWR, exhibit a narrow range of values. In contrast, the study proposes a slightly broader range of values for the analogous input variables with regard to the west façade. However, considering the most influential input variable, which is the WWR, this study suggests a much lower configuration compared to previous studies in the tropical region [19,20] and non- tropical region [51]. Considering the shading depth and elevation, this study is still in alignment with the previous works [16,19]. Lastly, the findings of this study indicate that a shorter distance to the adjacent building is preferable for the bilateral opening façade classroom with one-sided context building, with 0.5 m ⁓ 0.9 m being optimal. This condition is attributable to the advantage of having a bilateral opening for the elementary school classroom size, as employed in this study.
Moreover, as previously explained, this study evaluated the performance of visual comfort and annual daylighting on a single classroom orientation, with openings situated on the east and west sides. Also, the classroom size is based on the Indonesian national standard for elementary school classrooms [26]. Based on the findings of prior research, this configuration can be regarded as a generic orientation. The optimal outcomes observed in this orientation can be extrapolated to other orientations with minimal adjustments to performance metrics in similar locations [19]. For different locations, the approach proposed in previous studies with a prediction model utilizing average annual global horizontal radiation (aGHR) for various locations in tropical climates [20] could potentially be developed for cases investigated in this study as well.
Furthermore, this study has limitations in terms of evaluating the performance of a classroom, which are only limited by annual visual comfort and daylighting. However, the findings of previous research on classrooms with the same dimensions as in this study suggest that an increase in performance at aUDI100-3000lx by 45% would result in a 24% reduction in cooling costs if the classroom were to use artificial air conditioning. Additionally, an enhancement in thermal comfort was observed, reaching 38% under these conditions. In the preceding study, the WWR was estimated at 20% [52]. However, this study determined the optimal design has a shorter horizontal shading depth and WWR to be 10%, which is half of the value reported in the previous study. This suggests that the optimal design in this study can potentially conserve more cooling energy and enhance thermal comfort to a greater extent due to the reduced opening area, coupled with minimal exposure to direct sunlight from the west as the result of context existence. This reduced exposure to direct sunlight in the classroom also contributes to the observed improvements in thermal comfort.
4. Conclusion
The sensitivity analysis and optimization in this study were carried out for a school classroom with an adjacent building on one side, which has the potential to block daylight in the tropical climate of Indonesia. The results demonstrate that the annual visual comfort is not achieved in most of the design scenarios (sGA0.4/95% < 95%). Furthermore, there were no issues of excessive sunlight penetration, as indicated by ASE1000,250 < 20%. With regard to daylight availability metrics, all design scenarios demonstrated compliance with the target of sDA300/50% and aUDI100-3000lx, which exceed 55% and 80%, respectively. In contrast, this study finds that aUDI250-750lx has not met the target, with values below 80%.
From the sensitivity analysis, three most influential input variables were found, which include the horizontal shading depth, shading elevation, and WWR on the east façade. Meanwhile, the distance to adjacent building is found to be trivial as discovered in this study. Furthermore, it is discovered that the metrics of annual visual comfort (sGA0.4/95%), sunlight exposure (ASE1000,250), and daylight availability (aUDI100-3000lx) are sensitive to change on the east façade. On the aUDI250-750lx metric, the WWR on the west façade tends to have a moderate influence.
In addition, it is suggested that for the most influential input variables, which are horizontal shading depth, shading elevation and WWR, on the east facade, has a very limited possibility for alteration to achieve the optimum design. The adjustments made for the most influential input variable might significantly influence the daylight availability inside the classroom. Nevertheless, the input variables on the west façade allow for greater flexibility in terms of adjustment. Furthermore, the top optimal solution is a symmetrical bilateral opening typology with a horizontal shading depth of 2.6 m, shading elevation of 2.7 m, and window-to-wall ratio of 10%. Additionally, it has a 0.5 m distance to the adjacent building on the west side.
Further studies are required to investigate the potential of more complex façades as daylighting strategy and their interaction with neighboring buildings in a wider range of tropical contexts. The complexity of the computational techniques may necessitate the use of a machine learning approach in future investigations on daylighting in tropical school classrooms.
Acknowledgement
The authors would like to express their gratitude to Dr. Eng. Muhammad Iqbal for his invaluable insights during the research process and to Muhammad Dastur for his assistance with the research administrative tasks. Finally, the authors would like to extend their sincerest thanks to Lena Indriani, Putri Sri Alisia Nabila, Ismi Wahyuni, and Aura Mutiara Sina, the first author's students, for their contributions to the simulation.
Funding
This research was funded by the Ministry of Education, Culture, Research, and Technology of the Republic of Indonesia through the Institute of Research and Community Services (LPPM) of Universitas Malikussaleh under the fundamental research scheme 2024, under contract number 058/E5/PG.02.00.PL/2024 and sub-contract number 192/UN45.3.1/AL.04/VI/2024.
Contributions
Atthaillah: Conceptualization, Methodology, Software, Validation, Formal Analysis, Investigation, Resources, Data curation, Writing-original draft preparation, Writing-review and editing, Visualization, Funding acquisition. RA Mangkuto: Methodology, Validation, Writing-review and editing. A Bintoro: Methodology, Investigation, Resources, Writing-review and editing, Project administration.
Declaration of competing interest
The authors declare no conflict of interest.
References
- U. Berardi, A cross-country comparison of the building energy consumptions and their trends, Resource Conservation, and Recycling, 123 (2017) 230-241. https://doi.org/10.1016/j.resconrec.2016.03.014
- K. Anderson, Design Energy Simulation for Architects, Routledge: New York, 2014. https://doi.org/10.4324/9781315851433
- G. D. Ander, Daylighting, Whole Building Design Guide (WBDG), 2016. [Online]. Available: https://www.wbdg.org/resources/daylighting (Accessed: 01-Jul-2018).
- A. H. Primanti, R. A. Mangkuto, M. D. Koerniawan, R. C. G. M. Loonen, and S. B. de Vries, Sensitivity analysis on daylighting, visual comfort, and energy consumption of automated venetian blinds for open-plan offices in tropical climate, in Proceedings of the EduARCHsia & Senvar 2019 International Conference (EduARCHsia 2019), (2020), pp. 48-52. https://doi.org/10.2991/aer.k.200214.007
- A. A. S. Bahdad, S. F. S. Fadzil, and N. Taib, Optimization of daylight performance based on controllable light-shelf parameters using genetic algorithms in the tropical climate of Malaysia, Journal of Daylighting, 7(1) (2020) 122-136. https://doi.org/10.15627/jd.2020.10
- P. Bakmohammadi and E. Noorzai, Optimization of the design of the primary school classrooms in terms of energy and daylight performance considering occupants' thermal and visual comfort, Energy Reports, 6 (2020) 1590-1607. https://doi.org/10.1016/j.egyr.2020.06.008
- N. Shishegar and M. Boubekri, Natural Light and Productivity: Analyzing the Impacts of Daylighting on Students' and Workers' Health and Alertness, in International Conference on Health, Biological and Life Science, (2016), pp. 151-156.
- M. Boubekri, J. Lee, K. Bub, and K. Curry, Impact of daylight exposure on sleep time and quality of elementary school children, European Journal of Teacher Education, 2(2) (2020) 10-17. https://doi.org/10.33422/ejte.v2i2.195
- Y. Liu, K. Chen, E. Ni, and Q. Deng, Optimizing classroom modularity and combinations to enhance daylighting performance and outdoor platform through ANN acceleration in the post-epidemic era, Heliyon, 9(11) (2023) e21598. https://doi.org/10.1016/j.heliyon.2023.e21598
- A. Pellegrino, S. Cammarano, and V. Savio, Daylighting for Green Schools: A Resource for Indoor Quality and Energy Efficiency in Educational Environments, Energy Procedia, 78 (2015) 3162-3167. https://doi.org/10.1016/j.egypro.2015.11.774
- M. Abdelhakim, Y. W. Lim, M. Z. Kandar, and M. Z. Abdelhakim, M., Lim, Y. W., & Kandar, Optimum glazing configurations for visual performance in Algerian classrooms under mediterranean climate, Journal of Daylighting, 6(1) (2019). https://doi.org/10.15627/jd.2019.2
- M. N. Majeed, F. A. Mustafa, and H. A. Husein, Impact of building typology on daylight optimization using building information modeling: Apartments in Erbil city as a case study, J. Daylighting, 6(2) (2019) 187-201. https://doi.org/10.15627/jd.2019.17
- Y. Liu, K. Chen, E. Ni, and Q. Deng, Optimizing classroom modularity and combinations to enhance daylighting performance and outdoor platform through ANN acceleration in the post-epidemic era, Heliyon, 9(11) (2023) e21598. https://doi.org/10.1016/j.heliyon.2023.e21598
- J. Liu, Z. Li, Q. Zhong, J. Wu, and L. Xie, Multi-objective optimization of daylighting performance and energy consumption of educational buildings in different climatic zones of China, Journal of Building Engineering, 95 (2024) 110322. https://doi.org/10.1016/j.jobe.2024.110322
- X. Mo, O. Pons-Valladares, and S. I. Ortega Donoso, Model to Improve Classrooms' Visual Comfort Using Waste-Based Shading and Its Validation in Mediterranean Schools, Sustainability, 16(23) (2024). https://doi.org/10.3390/su162310176
- Atthaillah, R. A. Mangkuto, M. D. Koerniawan, and B. Yuliarto, On the interaction between the depth and elevation of external shading devices in tropical daylit classrooms with symmetrical bilateral openings, Buildings, 12(6) (2022). https://doi.org/10.3390/buildings12060818
- Atthaillah, R. A. Mangkuto, M. D. Koerniawan, and B. Yuliarto, Optimization of daylighting design using self-shading mechanism in tropical school classrooms with bilateral openings, Journal of Daylighting, 9(2) (2022) 117-136.
- Atthaillah, R. A. Mangkuto, M. D. Koerniawan, and F. X. N. Soelami, Daylight annual illuminance investigation in elementary school classrooms for the tropic of Lhokseumawe, Indonesia, Journal of Applied Science and Engineering, 25(1) (2022) 129-139.
- A. Atthaillah, R. A. Mangkuto, S. Subramaniam, and B. Yuliarto, Daylighting design validation and optimisation of tropical school classrooms with asymmetrical bilateral opening typology,Indoor and Built Environment, 33(3) (2024) 551-570. https://doi.org/10.1177/1420326X231204513
- Atthaillah, R. A. Mangkuto, M. D. Koerniawan, S. Subramaniam, and B. Yuliarto, Formulation of climate-based daylighting design prediction model for high performance tropical school classrooms, Energy and Buildings, (2024) 113849. https://doi.org/10.1016/j.enbuild.2023.113849
- E. Brembilla and J. Mardaljevic, Climate-Based Daylight Modelling for compliance verification: Benchmarking multiple state-of-the-art methods, Building and Environment, 158 (2019) 151-164. https://doi.org/10.1016/j.buildenv.2019.04.051
- J. Mardaljevic, Daylight simulation: validation, sky models and daylight coefficients, De Montfort University, UK, 2000.
- F. Kharvari, An empirical validation of daylighting tools: Assessing radiance parameters and simulation settings in Ladybug and Honeybee against field measurements, Solar Energy, 207 (2020) 1021-1036. https://doi.org/10.1016/j.solener.2020.07.054
- D. Geisler-Moroder, E. S. Lee, and G. J. Ward, Validation of the five-phase method for simulating complex fenestration systems with radiance against field measurements, in Proceedings for the 15th International Conference of the International Building Performance Simulation Association, 2017. https://doi.org/10.26868/25222708.2017.401
- A. McNeil and E. S. Lee, A validation of the Radiance three-phase simulation method for modelling annual daylight performance of optically complex fenestration systems, Journal of Building Performance Simulation, 6(1) (2012) 24-37. https://doi.org/10.1080/19401493.2012.671852
- Kementerian Pendidikan Nasional RI, Peraturan Menteri Pendidikan Nasional No 32 Tahun 2011 Lampiran II: Standar dan Spesifikasi Teknis Rehabilitasi Ruang Kelas Rusak, Pembangunan Ruang Kelas Baru Beserta Perabotnya, dan Pembangunan Ruang Perpustakaan Beserta Perabotnya untuk SD/SDLB, Kementerian Pendidikan Nasional, Jakarta, 2011.
- B. J. Alkhatatbeh, Y. Kurdi, and S. Asadi, Enhancing learning Environments: Exploring optimal classroom design connected to Double-Loaded corridors across the U.S. Climate zones, Energy and Buildings, 298 (2023) 113562. https://doi.org/10.1016/j.enbuild.2023.113562
- Atthaillah, R. A. Mangkuto, and M. D. Koerniawan, Investigation of Direct Sunlight in Existing Classroom Design in Indonesia: Case Study of Lhokseumawe, in Advances in Civil Engineering Materials, 2022, pp. 135-144. https://doi.org/10.1007/978-981-16-8667-2_16
- R. N. Syahreza, E. M. Husini, F. Arabi, W. N. W. Ismail, and M. Z. Kandar, Secondary school classrooms daylighting evaluation in Negeri Sembilan, Malaysia, in IOP Conf. Series: Materials Science and Engineering 401, 2018, p. 012024. https://doi.org/10.1088/1757-899X/401/1/012024
- R. A. Mangkuto, M. Rohmah, and A. D. Asri, Design optimization for window size, orientation, and wall reflectance with regard to various daylight metrics and lighting energy demand: a case study of buildings in the tropics, Applied Energy, 164 (2016) 211-219. https://doi.org/10.1016/j.apenergy.2015.11.046
- P. Tregenza, The Monte Carlo method in lighting calculations, Lighting Research Technology 15 4 (1983) 163-170. https://doi.org/10.1177/096032718301500401
- S. Subramaniam, Parametric Modeling Strategies for Efficient Annual Analysis of Daylight in Buildings, Pennsylvania State University, 2018.
- M. S. Roudsari and M. Pak, Ladybug: A Parametric Environmental Plugin For Grasshopper to Help Designers Create An Environmentally-Conscious Design, in 13th Conference of International Building Performance Simulation Association, 2013, pp. 3128-3135.
- P. Tregenza and I. Waters, Daylight coefficients, Lighting Research Technology, 15(2) (1983) 65-71. https://doi.org/10.1177/096032718301500201
- S. Subramaniam and R. G. Mistrick, A More Accurate Approach for calculating Illuminance with Daylight Coefficients, in The IES Annual Conference 2017.
- S. Subramaniam, Daylighting Simulations with Radiance using Matrix-based Methods, 2017.
- J. Wienold and J. Christoffersen, Evaluation methods and development of a new glare prediction model for daylight environments with the use of CCD cameras, Energy and Buildings, 38(7) (2006) 743-757. https://doi.org/10.1016/j.enbuild.2006.03.017
- N. L. Jones, Fast climate-based glare analysis and spatial mapping, Building Simulation Conference Proceedings, 2 (2019) 982-989.
- Illuminating Engineering Society (IES) LM-83-12, Approved method: IES spatial daylight autonomy (sDA) and annual sunlight exposure (ASE), 2013.
- United States Green Building Council (USGBC), LEED Reference Guide for Building Design and Construction, LEED v4, Washington DC, 2013.
- United States Green Building Council (USGBC), 100002149 | U.S. Green Building Council, 2017. [Online]. Available: https://www.usgbc.org/leedaddenda/100002149 (Accessed: 25-Aug-2020).
- United States Green Building Council (USGBC), LEED v4.1: Building Design and Construction, 2021. [Online]. Available: https://www.usgbc.org/leed/v41.
- A. Nabil and J. Mardaljevic, Useful daylight illuminances: A replacement for daylight factors, Energy and Buildings, 38(7) (2006) 905-913. https://doi.org/10.1016/j.enbuild.2006.03.013
- J. Mardaljevic, Climate-Based Daylight Analysis for Residential Buildings Impact of various window configurations , external obstructions , orientations and location on useful daylight illuminance, Leicester, 2010.
- R. A. Mangkuto, M. A. . M. A. A. Siregar, A. Handina, and Faridah, Determination of appropriate metrics for indicating daylight availability and lighting energy demand using genetic algorithm, Solar Energy, 170 (2018) 1074-1086. https://doi.org/10.1016/j.solener.2018.06.025
- IESNA, IES LM-83-12 Approved Method : IES Spatial Daylight Autonomy (sDA) and Annual Sunlight Exposure (ASE), 2012.
- L. Heschong, R. L. Wright, and S. Okura, Daylighting Impacts on Human Performance in School, Journal of the Illuminating Engineering Society, 31(2) (2002), pp. 101-114. https://doi.org/10.1080/00994480.2002.10748396
- L. Heschong, Windows and classrooms: a study of student performance and the indoor environment, California, 2003.
- M. Boubekri, Daylighting, Architecture and Health: Building design strategies, Oxford: Elsevier, 2008. https://doi.org/10.4324/9780080940717
- M. Ayoub, A multivariate regression to predict daylighting and energy consumption of residential buildings within hybrid settlements in hot-desert climates, Indoor and Built Environment, 28(6) (2019) 848-866. https://doi.org/10.1177/1420326X18798164
- K. Lakhdari, L. Sriti, and B. Painter, Parametric optimization of daylight, thermal and energy performance of middle school classrooms, case of hot and dry regions, Building and Environment, 204 (2021) 108173. https://doi.org/10.1016/j.buildenv.2021.108173
- F. N. Hakim, Y. Muhamadinah, Atthaillah, R. A. Mangkuto, and A. S. Sudarsono, Building envelope design optimization of a hypothetical classroom considering energy consumption, daylighting, and thermal comfort: Case study in Lhokseumawe, Indonesia, International Journal of Technology, 12(6) (2021), pp. 1217-1227. https://doi.org/10.14716/ijtech.v12i6.5203
Copyright © 2025 The Author(s). Published by solarlits.com.

3327
Total views
Citations
SHARE ON


