Volume 12 Issue 2 pp. 375-396 • doi: 10.15627/jd.2025.24
Height-Responsive Balcony-Integrated Envelope Design for High-Rise Residential Buildings: Sensitivity Analysis and Clustering Based Optimization Approach
Fariha Seraj*
Author affiliations
Department of Architecture, Dhaka University of Engineering & Technology, Gazipur, Bangladesh
*Corresponding author.
fariha.seraj@duet.ac.bd (F. Seraj)
History: Received 26 June 2025 | Revised 3 August 2025 | Accepted 17 August 2025 | Published online 20 September 2025
2383-8701/© 2025 The Author(s). Published by solarlits.com. This is an open access article distributed under the terms and conditions of the Creative Commons Attribution 4.0 License.
Citation: Fariha Seraj, Height-Responsive Balcony-Integrated Envelope Design for High-Rise Residential Buildings: Sensitivity Analysis and Clustering Based Optimization Approach, Journal of Daylighting, 12:2 (2025) 375-396. doi: 10.15627/jd.2025.24
Figures and tables
Abstract
Balconies function as essential shading elements within the building envelope, playing a critical role in regulating occupant comfort and energy efficiency. Despite their importance, balconies are often designed repetitively across floors without accounting for the variation in environmental conditions at different elevations. Therefore, this study aims to optimize the envelope design of residential bedrooms with balconies to improve visual and thermal comfort, and energy performance across three representative floor positions: lower (3 m), middle (18 m), and upper (33 m), considering the surrounding context in hot-humid tropical climate of Dhaka, Bangladesh. The proposed research framework combines parametric-based multi-objective optimization using the NSGA-II algorithm with multi-criteria decision-making through K-means clustering and Sobol sensitivity analysis. Design variables are grouped into three categories: envelope geometry, balcony geometry, and material types. The four performance objectives include maximizing spatial daylight autonomy (sDA300/50%), spatial glare autonomy (sGA40%/5%), and thermal comfort percentage (TCP), while minimizing energy use intensity (EUI). Results reveal that optimal solutions vary significantly by floor. Lower floors benefit from wider glazed openings and higher parapets to control reflected glare, while middle floors achieve balanced performance with smaller openings and moderate balcony features. Upper floors prioritize deeper shading and reflective materials to manage intense solar exposure. It also challenges conventional recommendations by identifying parapet height, not glazed door width, as the key variable for visual comfort on lower and middle floors. In contrast, glazed door width is more influential on upper floors through Sobol sensitivity analysis. In addition to this, second-order interactions, particularly among balcony-related parameters, were strongest on lower floors, moderate on upper, and minimal on middle floors. This study contributes to the current knowledge on climate-responsive high-rise design by demonstrating the importance of floor-specific strategies for a hot-humid tropical context. The proposed approach aids designers in making informed decisions not only during early design phases but also for renovation and code development in a similar climatic context.
Keywords
multi-objective optimization, envelope; balcony, visual comfort, thermal comfort
1. Introduction
Buildings currently consume between 30% and 40% of the global primary energy [1], of which 21% is attributed to residential buildings [2]. Dhaka, as the capital of the developing country Bangladesh, faces challenges in the energy sector, where residential consumers of electricity comprise 90.6% and 55% of the total electricity consumption [3]. Dhaka experiences a hot and humid tropical climate, characterized by high temperatures and humidity year-round, making it predominantly cooling-dominated in terms of building energy demand. According to a previous study, in Dhaka, cooling for thermal comfort accounts for 23.7% of the total energy usage and will rise to 54.3% and 71.9% in 2050 and 2080, respectively [4]. Through optimized building design and careful selection of envelope components, energy use can be minimized, and comfort can be improved. Evaluation of the residential building sector in Dhaka is essential due to its substantial strain on energy resources and the environment.
Balconies, as part of the building envelope, are recognized as environmental buffer spaces that can enhance indoor comfort conditions and reduce energy usage in buildings [5,6]. Moreover, the larger glazed door on the building façade, integrated with the balcony, enhances natural ventilation in the adjoining space by allowing increased airflow. A previous study reported a reduction of 12.3% in the annual energy consumption for cooling by using a balcony in the case of residential apartments in the hot subtropical climate of Hong Kong [7]. Another study found that increasing the depth of a balcony enhances energy savings in the hot and humid climatic context of Kaohsiung District, Taiwan. It also indicated that a deep-shaded balcony can lower indoor air conditioner electricity consumption by approximately 12.72%. Additionally, with a window opening rate of 50%, a 2.5-meter-deep shaded balcony can reduce electricity usage by about 21–22% [8]. Other studies suggest that the overhanging effects of balconies can reduce glare and improve visual comfort in both the humid subtropical climate of São Paulo, Brazil [9], and the cold climate of Beijing [10].
To avail the environmental benefit of the balcony, an incentive was provided in the Dhaka Metropolitan Building Construction Act in 2008 [11], which was also included in the Bangladesh National Building Code (BNBC) [12]. According to BNBC 2020, the front balcony area can be excluded from the floor area calculation and extended into the mandatory setback area from the first-floor level if its size does not exceed the maximum allowable area, which is determined by multiplying 30% of the building's front width by 1 meter. As a result, balconies have become a prominent feature of residential buildings in Dhaka. These buildings are typically designed with balconies and wide attached glazed doors, which enhance daylight availability but may compromise energy efficiency and thermal comfort. However, the code lacks specific dimensional guidelines (e.g., balcony width, depth, parapet height, wing wall height) for designing balconies in conjunction with glazed doors to ensure optimal comfort and energy performance.
Numerous studies have emphasized the challenges involved in designing balconies to achieve energy efficiency, thermal performance, and daylighting, but the majority have focused on isolated performance metrics. The impact of balconies on daylighting and thermal performance was investigated through field survey and simulation analysis in some studies [9,13,14]. The results revealed that the presence of a balcony with a large window-to-wall ratio (WWR) of 60% is more beneficial in terms of environmental performance in the mild climatic context of Portugal. Similarly, it was found that rooms with open balconies on the south façade had controlled daylight illumination and improved hygrothermal performance, with temperatures 3°C lower than those without balconies [14]. Daylighting, thermal comfort, and energy performance were investigated by simulation analysis in some studies [8,15-17], and the parameters include- envelope insulation, WWR, shading length, balcony depth, width, and orientation. To enhance performance, these studies recommended designing balconies based on façade orientation and integrating them with the glazing area.
Achieving a balance across multiple synergistic performance metrics requires multi-objective optimization (MOO) for optimal results. Very few studies on balcony design analyze the synergistic relationship between energy performance and visual and thermal comfort using MOO. Building orientation, shading depth, WWR, and window and wall systems by creating nine models based on room depth and balcony types to reduce energy consumption and enhance daylighting and thermal comfort by MOO [18]. Another study optimized WWR and recessed balcony depth using a genetic algorithm to improve daylighting, thermal comfort, and energy performance [19]. Balcony area, direction, vertical and horizontal distribution were optimized for thermal comfort and energy performance, and the result reported a 22% improvement in energy performance in the cold semi-arid climate of Tehran, Iran [20]. Building shape, window type and area, shading and envelope materials were optimized for different climatic contexts [21]. The study demonstrates how genetic algorithm can explore a vast solution space to find optimal envelope configurations for different climatic zones.
Previous studies on MOO have primarily focused on variables such as balcony depth and width, window area, orientation, window reflectance, and wall U-value. However, balcony design is inherently complex and closely linked to other building variables. Certain variables, including the surface materials of the balcony, parapet, and wing wall configuration, remain largely unexplored. Moreover, the impact of the floor position and surrounding buildings was not considered in MOO studies. To the best of the author's knowledge, no existing research has incorporated these variables into balcony and envelope optimization. Furthermore, most studies have treated wall U-value and window glazing transmittance as continuous variables, which may not accurately reflect real-world material properties. The impact of common balcony and envelope materials, especially in tropical climates, needs further investigation. Therefore, this study aims to optimize the envelope design of residential bedrooms with balconies to improve visual and thermal comfort, and energy performance across three representative floor positions: lower (3 m), middle (18 m), and upper (33 m), considering the surrounding context in the hot-humid tropical climate of Dhaka, Bangladesh. Design variables are grouped into three categories: envelope geometry, balcony geometry, and material types. Envelope geometry includes glazed door width, window width, and shading depth. Balcony geometry comprises balcony width, depth, parapet height, and wing wall height. Material types cover wall and glazing materials, as well as parapet and floor materials for the balcony.The four key performance objectives of the MOO process are maximizing spatial daylight autonomy (sDA300/50%), spatial glare autonomy (sGA40%/5%), and thermal comfort percentages (TCP) while minimizing energy use intensity (EUI). In the first step, the parametric model and the integration of the optimization objectives were discussed. Exploratory data analysis and multi-criteria decision-making were then applied to identify optimal and alternative balcony and envelope design solutions and identify relationships between design variables and performance metrics, allowing for more informed decisions in the early stage. The results of the study can be used to define the building codes and standards regarding balcony and other envelope variables, focusing on visual, thermal comfort, and energy efficiency of residential bedrooms.
2. Methodology
The entire research process consists of four main steps: developing a parametric base case model, integrating building performance simulation tools, conducting multi-objective optimization, and performing data analysis combined with multi-criteria decision-making. Details of the four parts, including the software and simulation tools used, are presented in Fig. 1, while Sections 2.1- 2.5 describe the research process.
Figure 1
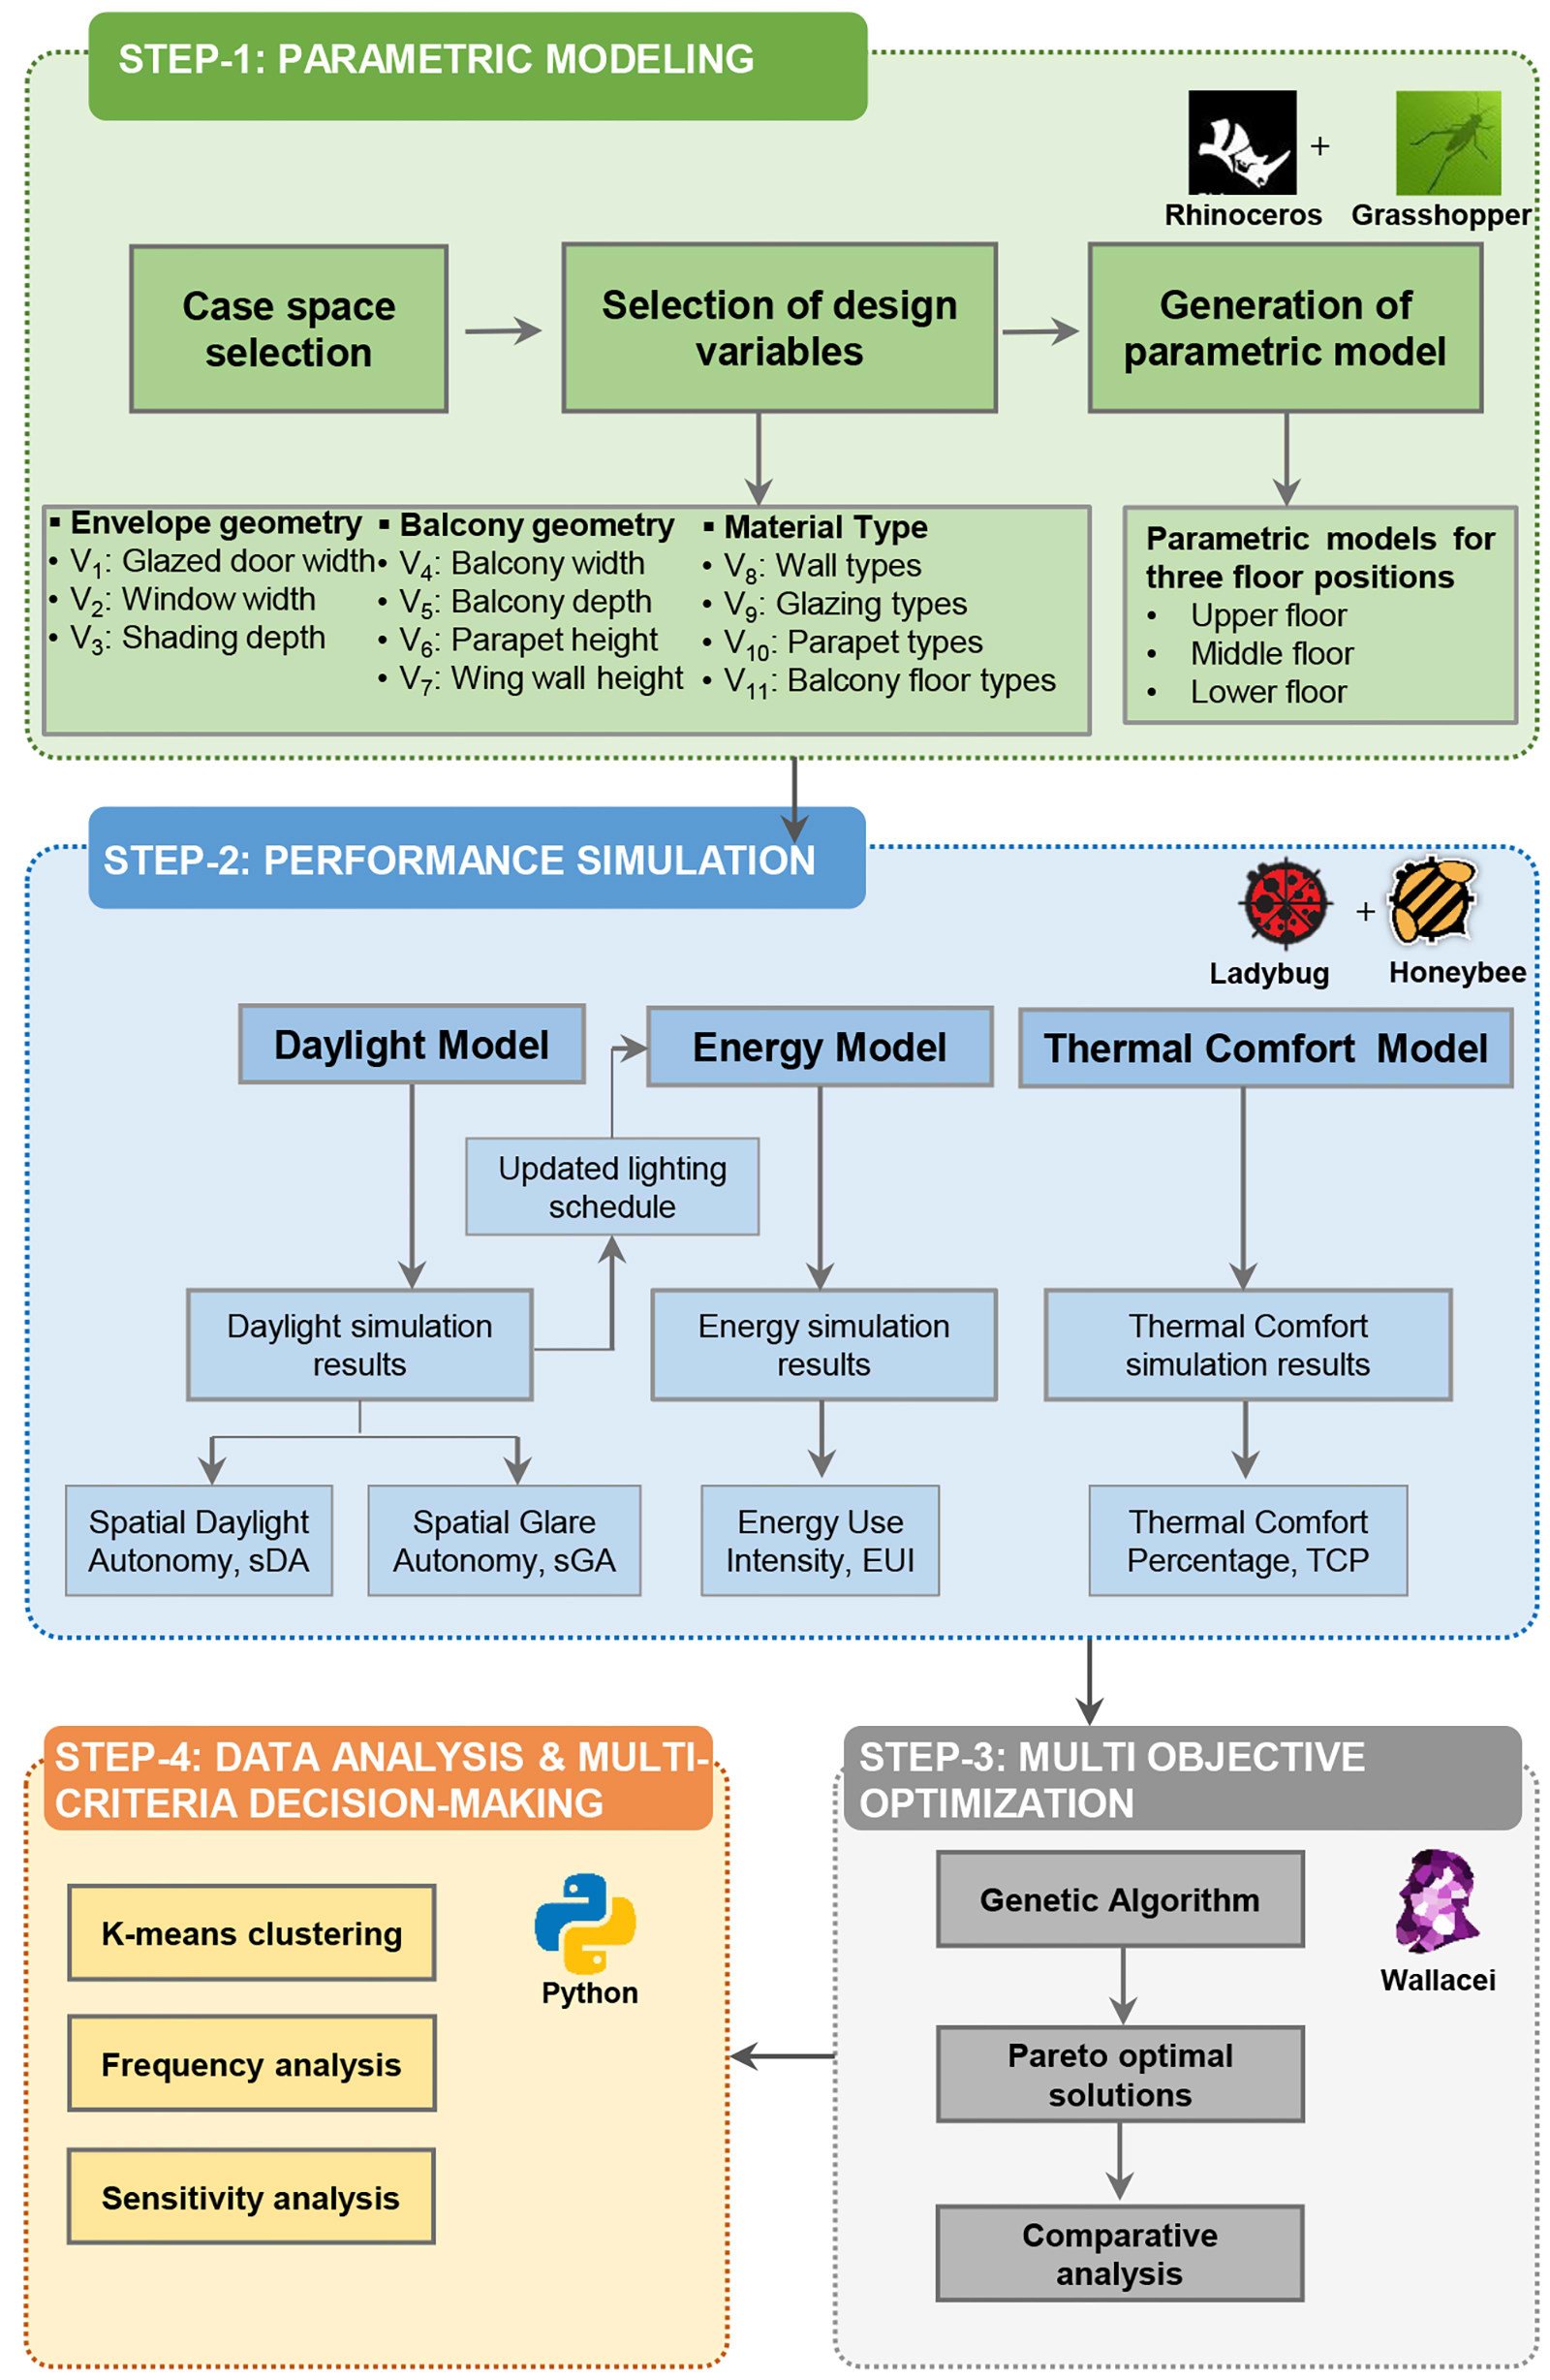
Fig. 1. Multi-objective optimization framework and tools for the research.
2.1. Parametric modeling of the base model and modifications
2.1.1. Description of the case space
The case residential building was located in Dhaka (coordinates: 23°40' N, 90°20' E), the capital city of Bangladesh. According to the world climate zones of ASHRAE Standard 169-2020, it falls under climate zone 1A, which is defined as a very hot and humid climate zone. The climate file of Dhaka (.epw format) downloaded from the website of Ladybug tools [22] was used in this study. April is the hottest month, with the highest daily average solar radiation and dry bulb temperature of 796.5 Wh/m2 and 32°C, respectively. January observed the lowest recorded average dry bulb temperature of 13.3°C. September has the highest recorded daytime temperature of 39.4°C, while January has the lowest recorded night-time temperature of 8.2°C.
A thirteen-story prototype high-rise residential building, developed by the Department of Architecture under the Ministry of Housing and Public Works, Bangladesh, was selected as the case space (Fig. 2(a)). The ground floor serves as a parking area. In contrast, each of the remaining twelve floors contains four apartments, each measuring 116.13 m² (Fig. 2(b) and (c)). Each apartment includes three bedrooms, a living room, dining space, kitchen, and four toilets (Fig. 2(d)). Located within an apartment complex in Dhaka, the case building is flanked by a 10.1 meter (m) wide road to the north and a 3.7 m wide road to the west. On the east and south sides, similar residential buildings are positioned at distances of 6.1m and 21.4m, respectively. The surrounding buildings were included in the simulation to assess their influence on the performance of the case space.
Figure 2
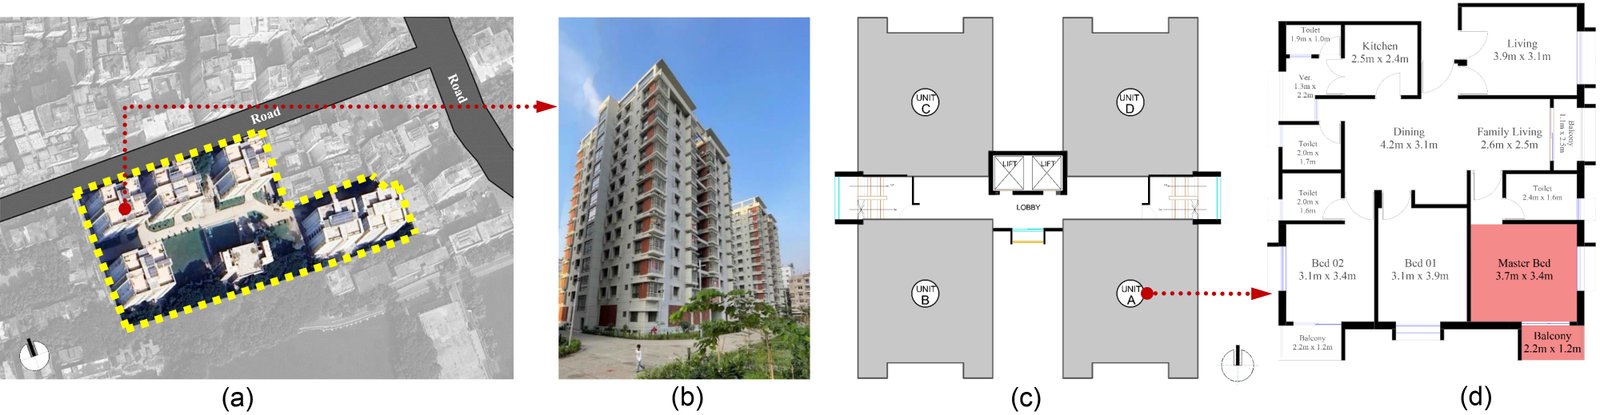
Fig. 2. (a) Location, (b) Exterior view of the case residential building (c) Schematic layout of the apartments, (d) Location of the case bedroom with balcony in the selected apartment (red surfaces).
The southeast corner master bedroom (Fig. 2(d)), measuring 3.7m in width, 3.4m in length, and 3.0m in height, was selected for the optimization process due to the presence of a balcony. The balcony is located on the south façade, with a depth and width of 1.4 m and 2.2 m respectively. A glazed door with a width of 1.9m and a height of 2.1m allows access to the balcony while also providing daylight and ventilation. Additionally, the room has a window with a width of 1.7m, sill height of 0.75m and a fixed external shade of 0.4m depth. The case bedroom is characterized by 0.25 m external and 0.15 m internal brick walls, a 0.10 m reinforced concrete floor with ceramic tiles, and 0.006 m single-glazed clear glass in both the window and balcony door. Details of the construction materials are provided in Appendix A (Table A1). A three dimensional model of the base case (Fig. 3(b)) was created using Rhinoceros [23] and Grasshopper [24]. Except for the east and south walls, the remaining bedroom walls, floor, and roof were considered adiabatic.
Figure 3
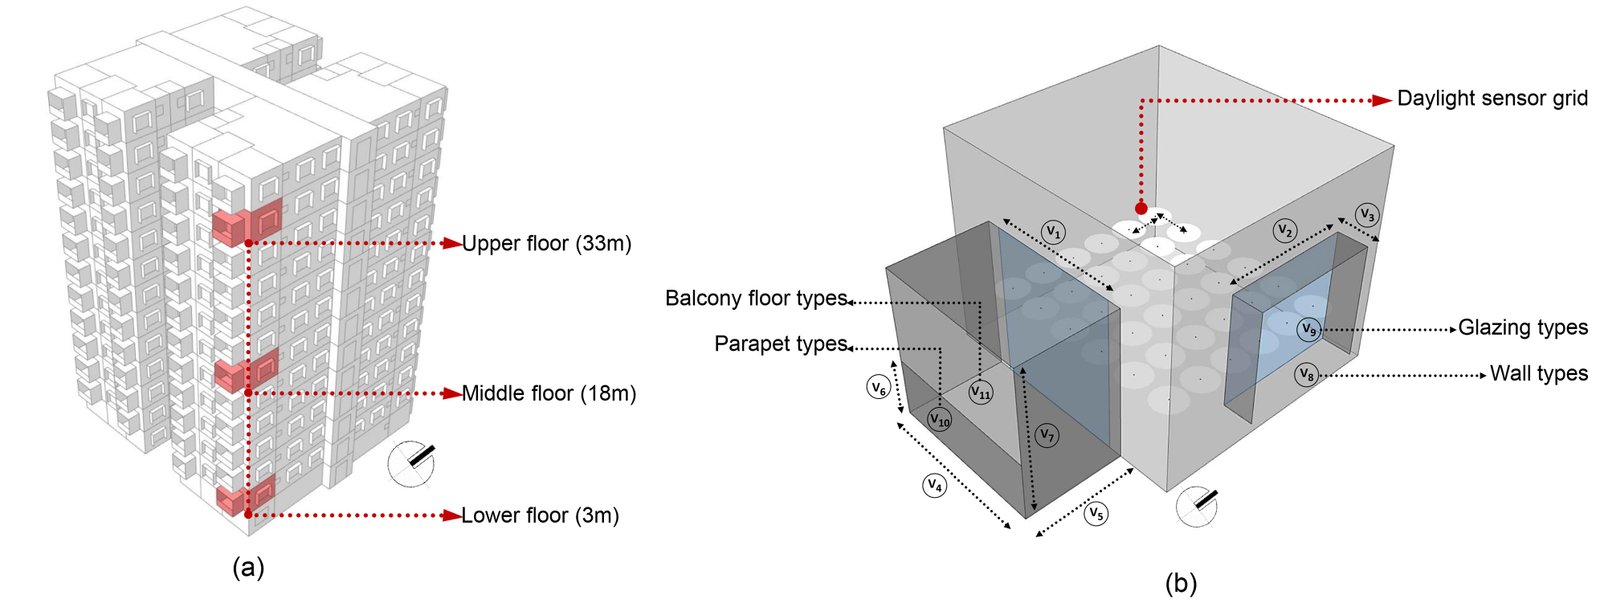
Fig. 3. (a) Selected floor positions for optimization (height above the plinth level), (b) Parametric model of the case bedroom along with the design variables.
2.1.2. Parametric modeling for optimization
A thorough evaluation of the constraining design parameters can enhance the implementation of optimization strategies. This study considered envelope design variables, while the variables associated with building form (room depth, width, orientation) and operation (set point of air conditioning system) were fixed. The envelope design variables were classified into three main groups: envelope and balcony geometry and material types. Envelope geometry included glazed door width, window width, and shading depth, while balcony geometry comprised balcony width and depth, parapet height, and wing wall height. Although WWR is commonly used in performance studies (Section 1), this study focused on window and glazed door widths instead. This choice reflects the standardized height of these elements in Dhaka's high-rise buildings due to construction and safety norms, making width a more practical and variable parameter. The material group comprised four variables: wall, glazing, balcony floor, and parapet types. Four wall and glazing constructions, along with two parapet and two balcony floor types commonly used in hot-humid climates like Dhaka, were evaluated to understand their impact on visual and thermal comfort and energy performance (Figs. 1 and 3). This study adopts a performance-based comparison approach rather than one based on fixed specifications. Although the optimal design solutions vary across floor levels, the optimization framework consistently employs the same set of design variables and performance objectives. This ensures that all alternatives are evaluated within an identical parametric space, allowing fair and meaningful comparison of trade-offs specific to each floor's environmental context. Furthermore, the use of genetic algorithms, such as NSGA-II, in this study is based on their proven ability to optimize complex envelope configurations along with other variables, e.g., window type, area, building shape across varying climates [21,25].
In high-rise buildings, environmental conditions vary significantly by height, affecting daylight, glare, thermal comfort, and energy use. To investigate this variation, three representative floor positions were selected for the MOO process: lower (3 m), middle (18 m), and upper (33 m). The lower floor is influenced by surrounding obstructions, resulting in limited daylight but lower solar gain; the middle floor experiences balanced exposure; and the upper floor receives maximum solar radiation, increasing glare and cooling demand. These levels reflect typical variations in solar exposure, enabling floor-specific design strategies. This approach ensures that optimized balcony-integrated envelope designs respond effectively to height-responsive environmental differences. So, the design variables were optimized at three floor positions, lower (3 m), middle (18 m), and upper (33 m), to assess their variability and impact on performance metrics across different positions. The details of the design variables are shown in Fig. 3 and Tables 1-4. The selected material types were chosen for their potential to improve building performance in Dhaka's hot-humid climate. Previous studies have also used them to evaluate their thermal performance [26-28].
Table 1
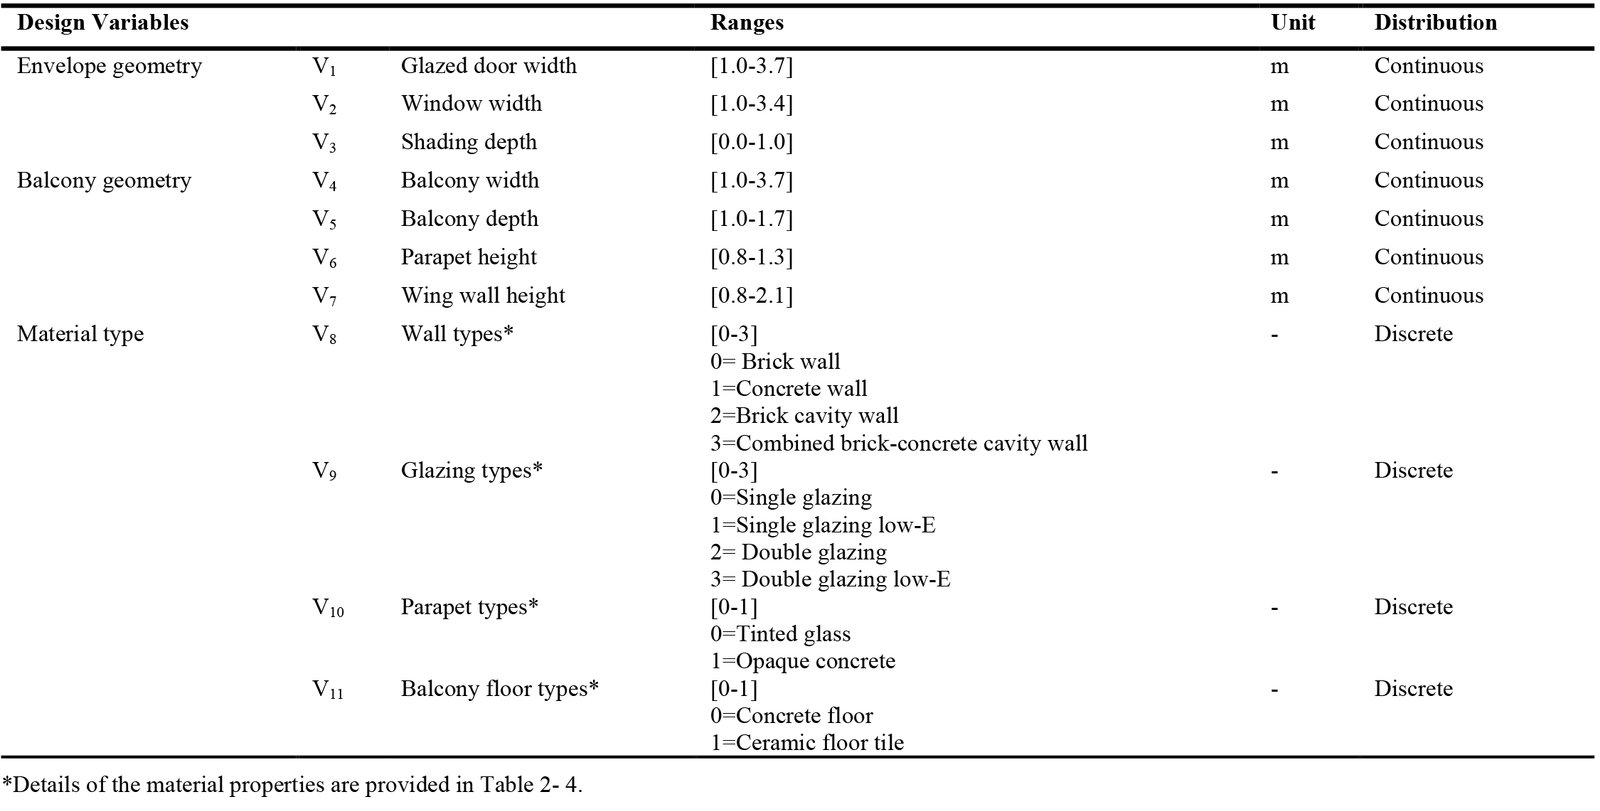
Table 1. Specification of the design variables.
Table 2
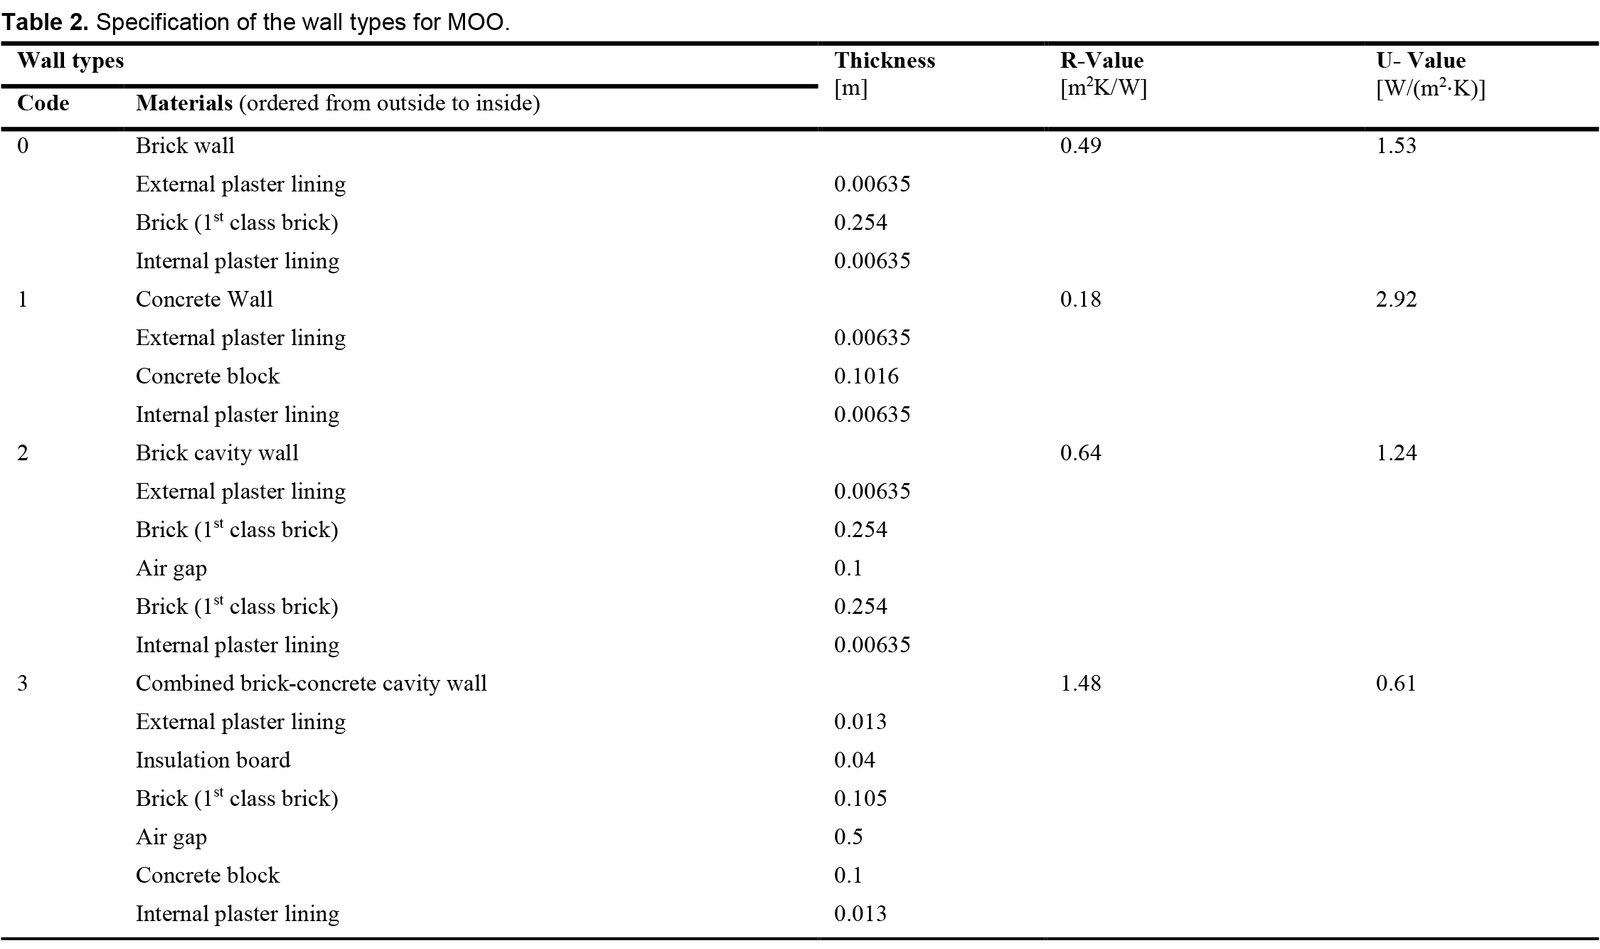
Table 2. Specification of the wall types for MOO.
Table 3
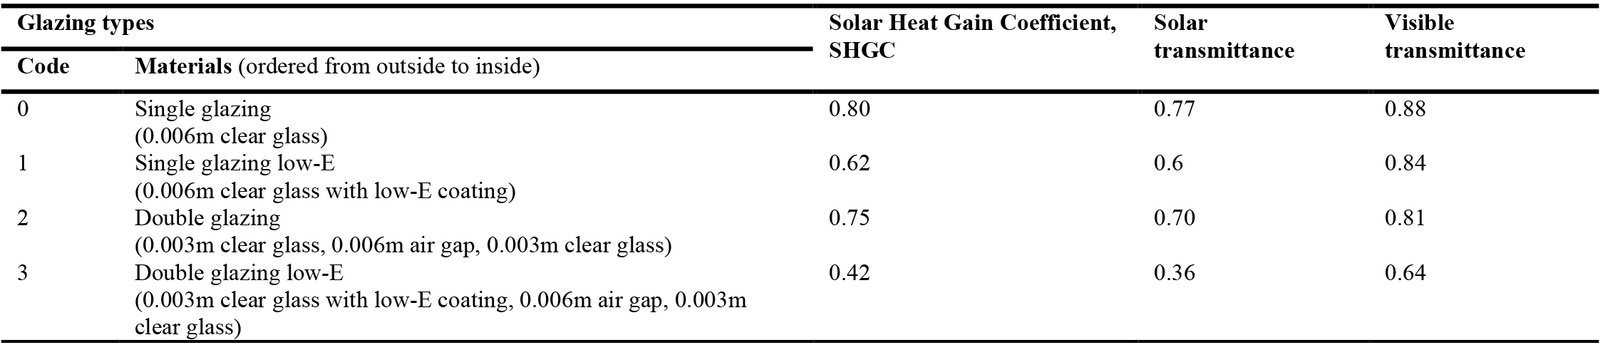
Table 3. Specification of the glazing types for MOO.
Table 4
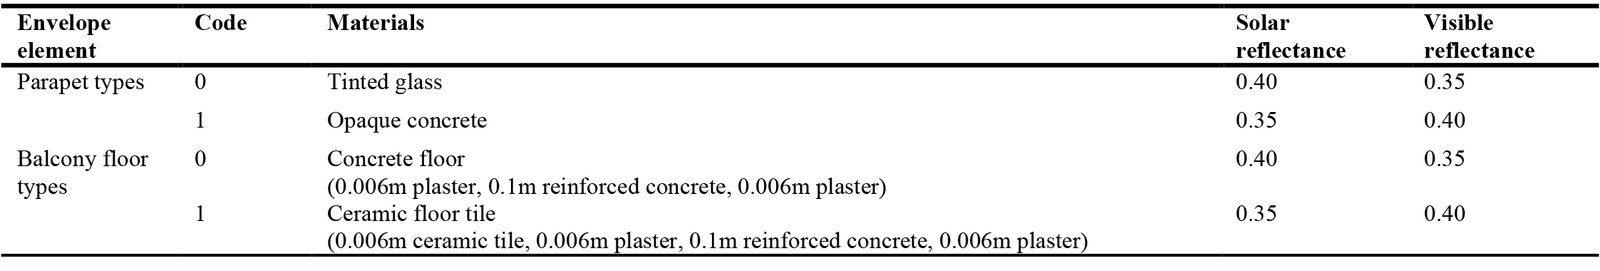
Table 4. Specification of parapet and balcony floor types for MOO.
2.2. Metrics for building performance evaluation
2.2.1. Metrics for visual comfort
Several metrics are employed to assess and measure visual comfort. This study adopted Spatial Daylight Autonomy (sDA300/50%) and Spatial Glare Autonomy (sGA40%/5%) to assess daylight availability as well as glare to ensure visual comfort. According to the Illuminating Engineering Society (IES), sDA300/50% measures the percentage of analyzed points that get at least 300 lux for 50% or more of the occupied hours [29]. IES also provided two categories for sDA300/50%: sDA preferred and sDA nominally accepted. In the case of sDA300/50%, a minimum of 75% of the analyzed points must get more than 300 lux for a minimum of 50% of the occupied hours. For nominally accepted sDA300/50%, 55% of the total analyzed points must achieve the requirements.
Spatial Glare Autonomy (sGA40%/5%) refers to the percentage of a space in which the Daylight Glare Probability (DGP) exceeds the 40% threshold for no more than 5% of the total occupied time [30]. Previous studies showed that DGP values below 45% are generally acceptable, with DGP levels under 40% being ideal for optimal visual comfort [30-32]. Considering this, the threshold for DGP is adopted as 40% in this study. For the simulation of sDA300/50% and sGA40%/5%, a daylight grid of 0.6 m × 0.6 m was used at two heights-0.75 m and 1.2 m above the floor, respectively, with 36 sensor points (Fig. 3(b)). Daylight (sDA300/50%) and glare (sGA40%/5%) simulations were conducted using Honeybee-RADIANCE, with both metrics expressed as percentages (%) of the occupied space.
2.2.2. Metric for thermal comfort
Dhaka experiences three main seasons based on its climate: warm-humid (June-November), hot-dry (March-May), and cool-dry (December-February). Temperature rarely falls below 10°C in the coldest month of January (Section 2.1.1), so heating is not required during winter. Hot weather prevails from April to October, necessitating cooling. Thus, the case space was considered a mixed-mode building.
For thermal comfort calculations, the adaptive thermal comfort (ATC) model of ASHRAE 55-2013 [33] was utilized in this study as it is proven to be more reliable than the PMV and PPD models for mixed-mode buildings [34]. In this standard, acceptable bandwidths of indoor temperature for thermal comfort are defined based on the relationship between outdoor and indoor temperatures. The acceptable indoor comfort temperature (Tct) bandwidths are determined considering the mean outdoor dry bulb temperature (To) using equation (1) [33].
Thermal comfort bandwidths can be developed using equation (1), considering occupants' acceptability limits of 80% and 90% [33]. The present study calculated the thermal comfort percentage (TCP) considering the ASHRAE 55 Adaptive Model 80% acceptability status, using the Ladybug and Honeybee plugins [35] of Grasshopper. Human adaptability is the fundamental concept of the adaptive approach, which refers to the natural ability of individuals to adjust to changing surroundings to stay comfortable. The energy model incorporates cross ventilation, induced by pressure differences between windows. Natural ventilation will be enabled only when all the following circumstances are simultaneously satisfied, based on the occupants' neutral temperature range [36,37]:
12°C < Tout < 28°C, windows opened —› true
23°C < Tin < 28°C, windows opened —› true
Tout - Tin > 0.5°C, windows opened —› true
Tin > 28°C, windows closed and turn on air conditioner —› true
RH > 90%, windows closed —› true
2.2.3. Metric for energy performance
Building energy performance was investigated utilizing the metric energy use intensity (EUI). It is an acceptable metric that considers the essential energy use variables, including annual heating, cooling, and lighting loads. As stated in Section 2.1.1 and Section 2.2.2, no heating system is required during the cold period. To maximize natural ventilation, the cooling set point was considered to be 28°C based on the neutral temperature range mentioned in Section 2.2.2. This is also advantageous for energy conservation in areas such as Dhaka, where the cooling period is prolonged. For calculating the lighting loads, the target illuminance for supplementary artificial lighting was considered to be 300 lux. The lighting system was set to continuous auto-dimming using an occupancy sensor. Table 5 describes the detailed energy simulation settings. The equipment load was not considered in the MOO process as it remains constant in the studied conditions. Energy simulations were carried out using Honeybee-Energy of the Ladybug tools.
Table 5
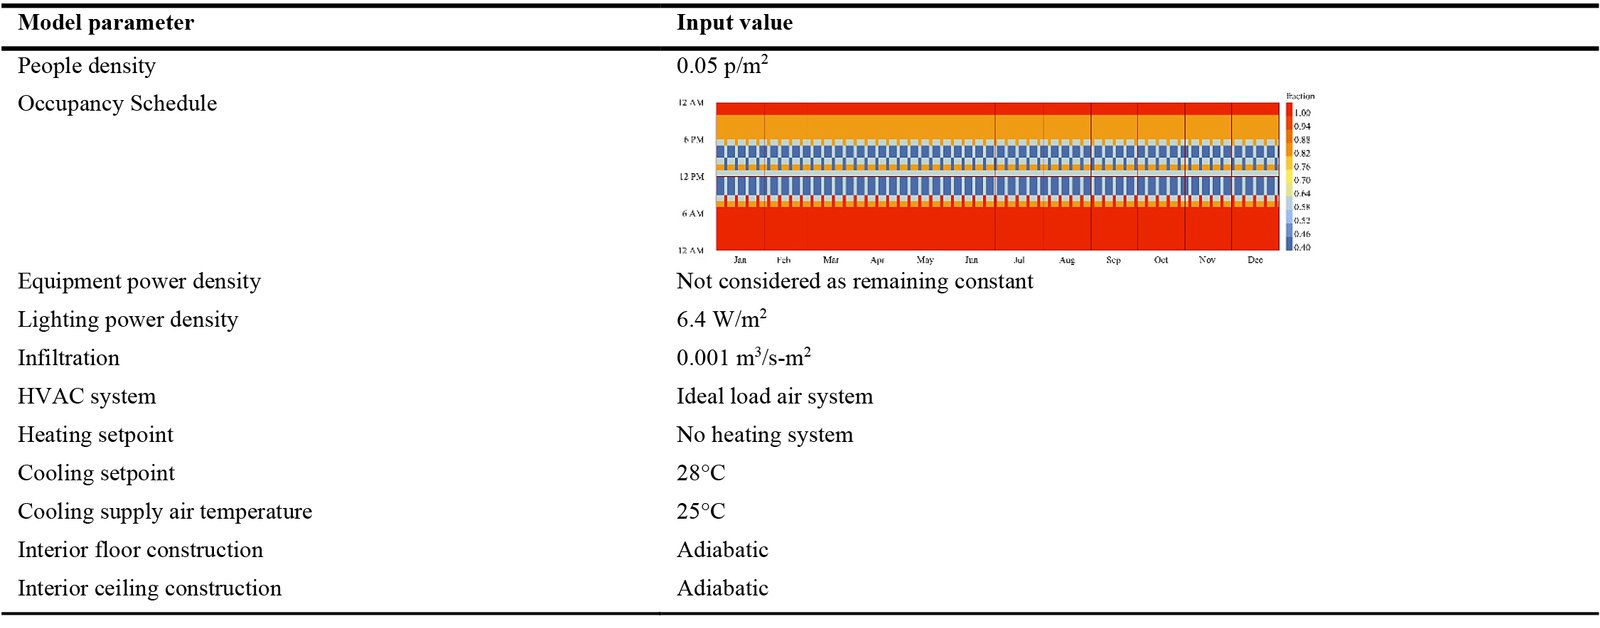
Table 5. Details of the energy model settings.
2.3. Validation of the model
On-site measurements were conducted to collect data for validating the daylight and thermal simulation models. Measurements were taken in the south-east facing master bedroom (Fig. 2(d)). on 6th floor level (18m above the plinth level) (Fig. 3(a)). For the measurement of illuminance, a grid measuring 0.6 m x 0.6 m was considered at 0.75 m height from the floor level with 36 sensor points (Fig. 3(b) and Section 2.2.1). Illuminance was measured at 09.00 h and 13.00 h using OMEGA HHLM112SD light meter (Fig. 4(a)) (±4% of full-scale ranges: 0 to 99,900 lux) on 27 November 2023. Indoor temperature data were recorded from 08.00 h to 17.00 h with one-hour intervals in the middle of the bedroom at a height of 1m above the floor [33] on 27 November 2023 using the OMEGA RH650 Thermo-Hygrometer (temperature ranges: -29 to 75°C, accuracy: ± 2°C) (Fig. 4(b)). Artificial lights, ceiling fans, and air conditioning units were turned off while the doors were closed, and the exterior windows were 50% opened during the measurements. Material properties and other settings for simulations were set according to Table 5 and Table A1.
Figure 4
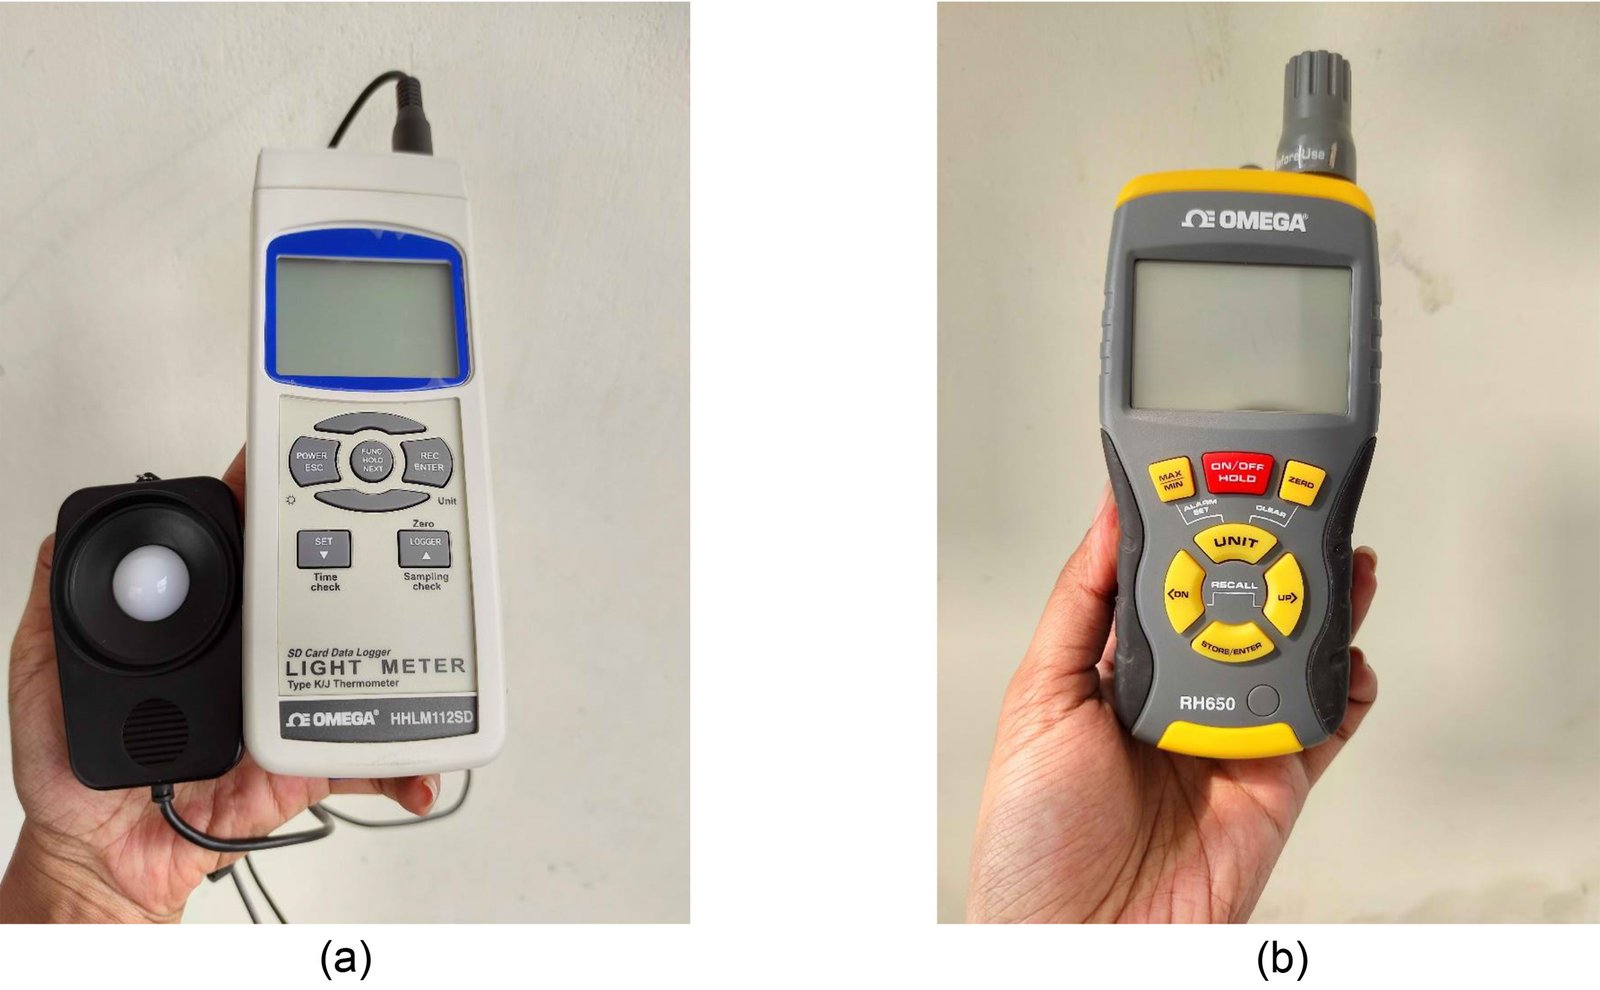
Fig. 4. The OMEGA instruments for (a) daylight and (b) thermal measurement.
The difference between measured and simulated data was computed to verify the simulation results. According to the ASHRAE Guideline 14–2014, the mean bias error (MBE) and coefficient variation of the root mean square error (CV (RMSE)) were determined using equations (2) and (3).
Mi and Si, respectively, denote the measured and simulated data at time intervals ‘i.. The number of total data values utilized in the computation is represented by n. The measured data's mean value is expressed as . The Co-efficient of determination (R2) was also calculated for both daylight and thermal models.
2.4 Multi-objective optimization
This study employed the Wallacei plugin [38] in Grasshopper for multi-objective optimization, using the 'Non-dominated Sorting Genetic Algorithm-II (NSGA-II)', frequently applied in architectural optimization problems [39]. NSGA-II uses fast non-dominated sorting and a crowding distance metric to preserve solution diversity [40]. It iteratively refines the population toward the Pareto front through crossover, mutation, and repetitive genetic operations. The non-dominated solutions of the final generation represent the Pareto optimal solutions [41]. Design variables (V1-V11) were introduced to Wallacei plugin as genes, while four building performance metrics- maximizing sDA300/50%, sGA40%/5%, TCP, and minimizing EUI- were defined as the objective functions. This study formulates the optimization problem using an objective function equation (4).
\(Min\ F(V)\ =\ [-f1\ (V),\ -f2\ (V),\ -\ f3(V),\ f4\ (V)]\)
\(V\ =\ \left[V_1,V_2,V_3,V_4,V_5,V_6,V_7,V_8,V_9,V_{10},V_{11}\right]\)
where f1, f2, f3, and f4 are the four optimization objectives and the functions f1, f2, and f3 are negative in equation (4) as they have to be maximized. The generation size, count, crossover probability, and mutation probability for the NSGA-II algorithm were 25, 20, 0.9, and 0.09, respectively.
2.5 Data analysis and multi-criteria decision-making
First, optimal solutions were identified using Design Explorer, an open-source web-based tool. The data from the MOO process were then analyzed in Python, where the K-means clustering method (via Scikit-learn) grouped Pareto-optimal solutions to support early design decisions. Subsequently, spatial distribution of the Pareto solutions and values of the performance objectives were examined across the three floor positions, followed by frequency analysis of design variables. Finally, Sobol sensitivity analysis [42], performed with the Python-based SALib package [43], identified the key design variables influencing each performance metric.
3. Results
3.1 Validation results
Energy and thermal simulation models are recognized as calibrated when the hourly Mean Bias Error (MBE) is within ±10% and the hourly Coefficient of Variation of the Root Mean Square Error [CV(RMSE)] is below 30%, as per ASHRAE 2014 guidelines. On the other hand, previous studies have found that 20–30% of simulation errors are acceptable for daylight models [44,45].
Regarding the illuminance values, the acceptable limit was met by MBE and CV(RMSE) at -3.51% and 1.38%, respectively. In the case of calibrating the indoor air temperature data, the acceptable limit defined by the ASHRAE guideline 14-2014 was met by MBE and CV(RMSE) at -0.43% and 4.63%, respectively. Correlation analysis between measured and simulated data for both illuminance and indoor temperature was also done. The Coefficients of the determination for the daylight and thermal models were found to be 0.982 and 0.913 respectively (Fig. 5).
Figure 5
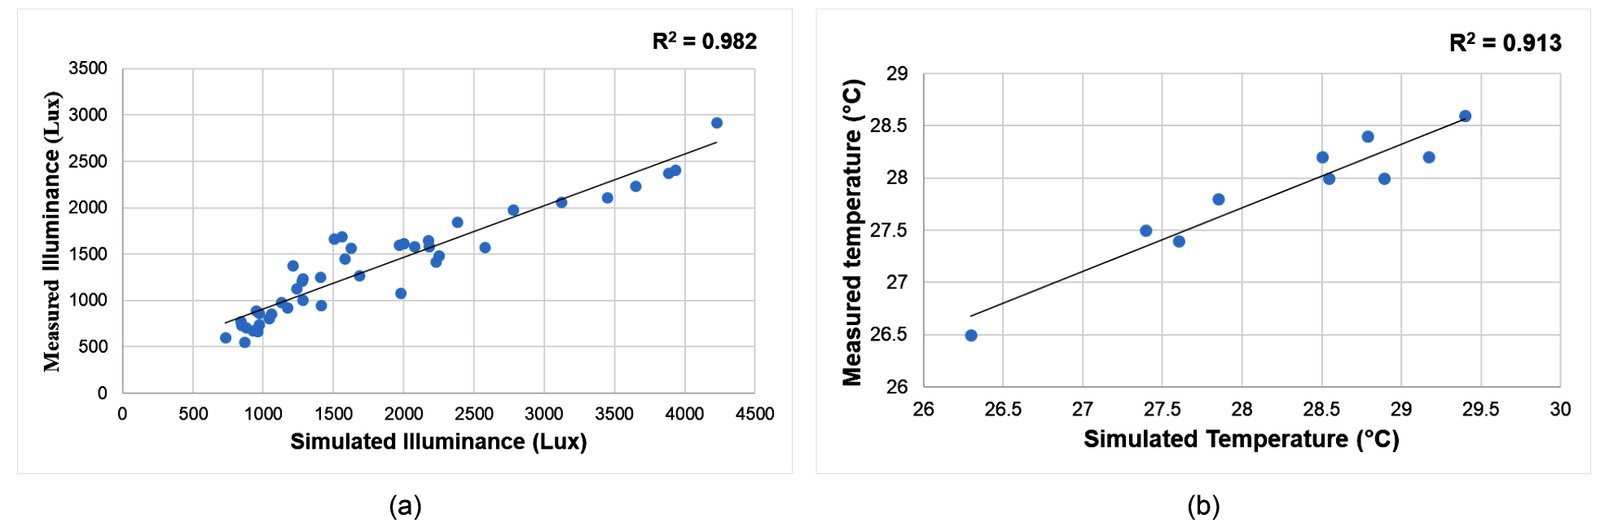
Fig. 5. Correlations between measured and simulated data for (a) daylight and (b) thermal models.
The energy model was not validated as the residential unit was vacant, and no energy data was available. Thermal and daylight scenarios, in combination with occupancy and equipment profiles, were considered while calculating the energy consumption. The occupancy and equipment profiles were not considered variable and remained constant in this study. Following the method of the previous studies related to optimization [25,46], only thermal and daylight models of this study were validated, which ensured the relative precision of the energy consumption data. Instead of using the absolute value, the energy consumption value was used as a relative indicator to compare design solutions and find the optimal solution. To summarize, the model utilized in this research has the potential to yield reliable simulation outputs for daylight, thermal, and energy aspects for optimization purposes.
3.2. Selection of envelope design schemes
3.2.1. Selection of the optimal solutions
Various methods have been employed to select optimal solutions from the solutions generated through the MOO process, including the pseudo-weight method [47] and the knee-point approach [48]. In this study, the selection was performed using the Design Explorer tool [49], which allows designers to make informed decisions based on their preferences using a parallel coordinates plot (PCP). The PCP visualizes how all solutions vary across design variables and performance metrics, where each line corresponds to an individual solution. The optimal solutions for the three floor positions were identified through a two-step process: first, solutions with sDA300/50% value of 75% or higher and an EUI range between 90 and 125 [kWh/(m²·a)] were shortlisted. Then, among these, the solution with the highest sGA40%/5% value was selected. Figure 6 presents the parallel coordinate plots illustrating the selected range of solutions, the optimal solutions, and the base case solutions for the three floor positions. Details of the optimal solutions are provided in Fig. 7. The base case shows significant variation in performance across floor positions despite identical envelope features (Figs. 6 and 7), highlighting the need for floor-specific design strategies. All optimal solutions outperform the base case across all performance metrics, demonstrating the effectiveness of the MOO process. The upper floor shows the highest sDA300/50%, while the middle floor records the lowest. For sGA40%/5%, the lower floor performs best, with the upper floor performing worst. Thermal comfort is highest on the lower floor and lowest on the upper, whereas the middle floor achieves the best energy performance, and the upper floor the lowest. An optimal combination of envelope geometry, material, and balcony configuration can enhance all performance metrics, specially in the case of sDA300/50% and EUI. A highest 23.7% increase in the sDA300/50% level without increasing the glare risk is observed in case of lower floor levels. The most significant improvement (10.7%) in case of EUI is observed in the middle floor position.
Figure 6
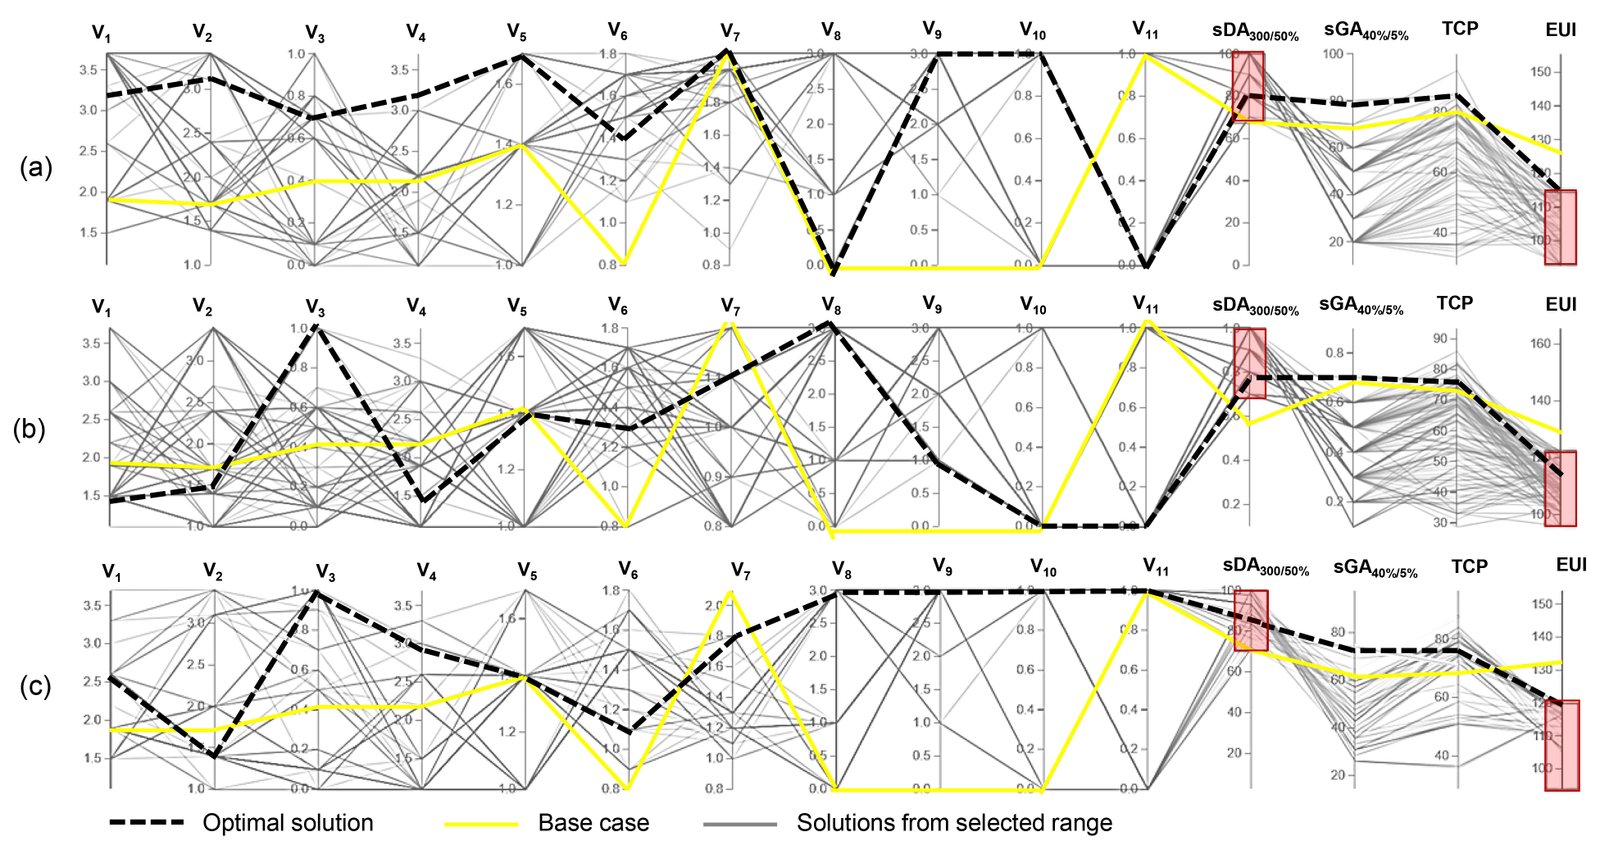
Fig. 6. Parallel coordinate plot showing the base case, Pareto solutions and the optimal solutions for (a) lower, (b) middle and (c) upper floor positions.
Figure 7
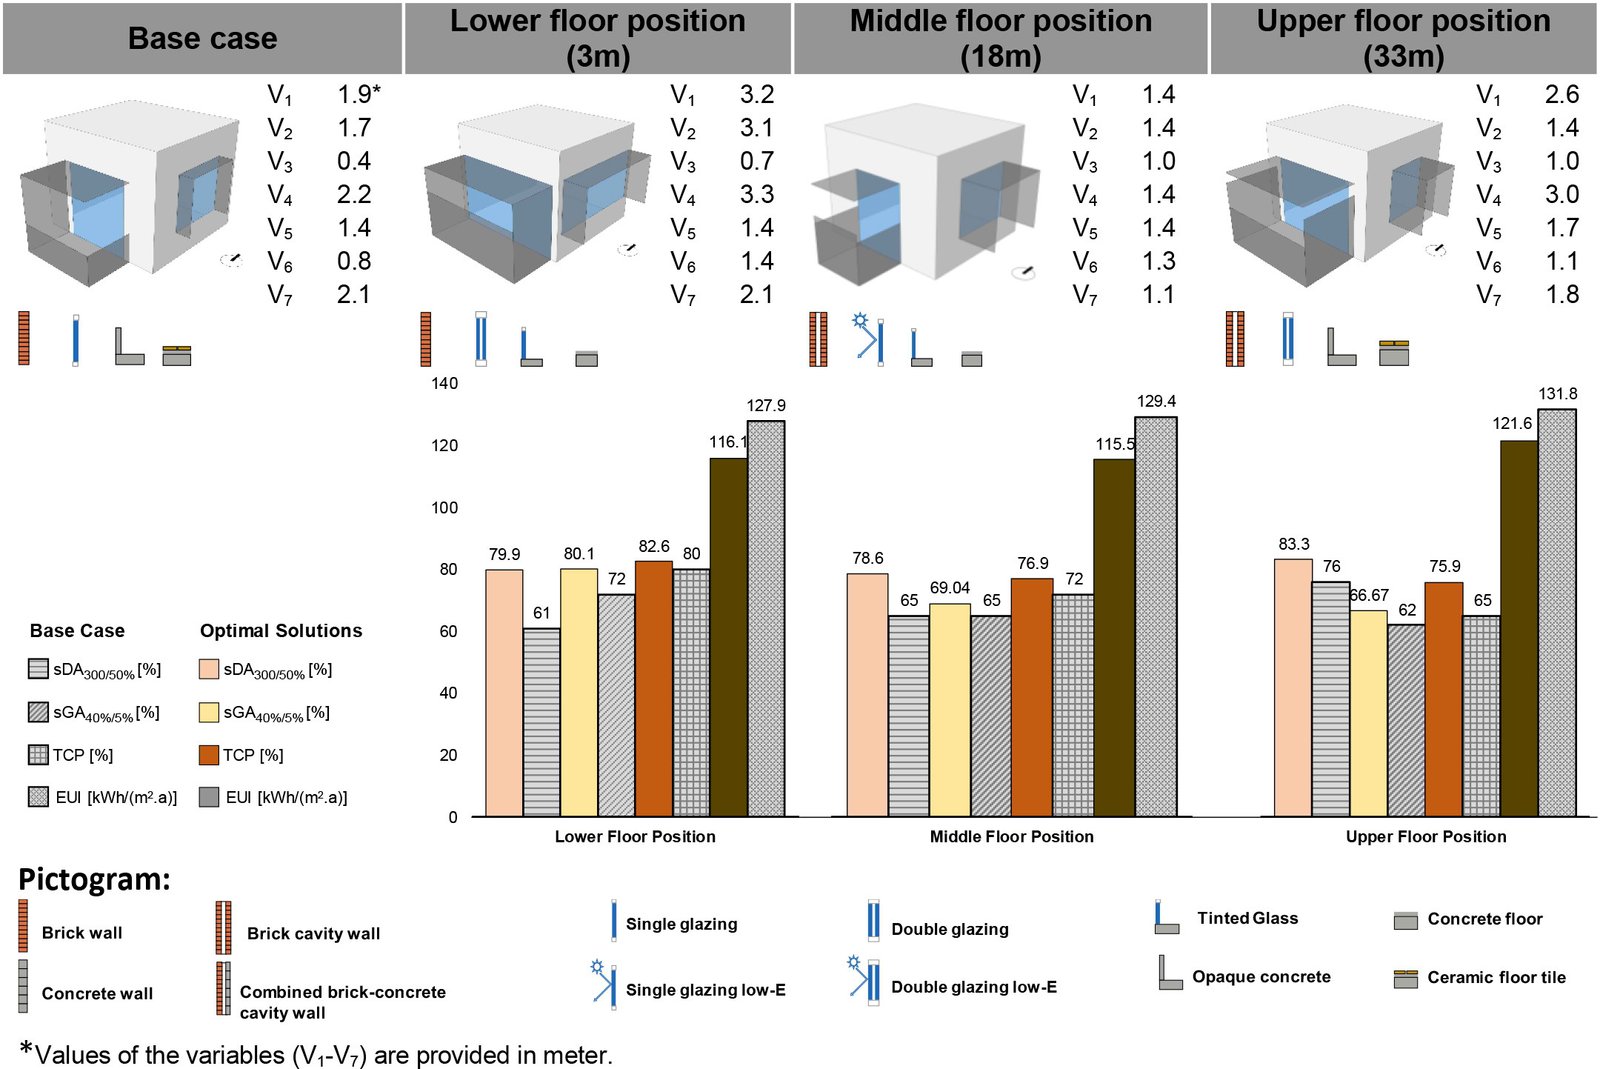
Fig. 7. Details of the optimal solutions for three floor positions.
As shown in Figs. 6 and 7, the optimal designs for the lower and upper floors feature wider glazed doors (3.2 m and 2.6 m, respectively), while the middle floor has a narrower width (1.4 m). Regarding window width, the lower floor has the widest (3.1 m), while the middle and upper floors have 1.4 m. Shading depth is greatest on the upper and middle floors (1 m), whereas the lower floor has a shallower depth (0.7 m) due to reduced solar exposure. Balcony configurations of the upper and lower floors are similar, both featuring wide balconies with high parapets and wing walls. However, the upper floor has a deeper balcony, while the lower has moderate depth. This is because lower floors, shaded by surrounding obstructions, use wider openings with double-glazed clear glass, high parapets, and tall wing walls to enhance daylight without increasing glare or thermal load. These features help control reflected light and maintain visual comfort. In contrast, upper floors face stronger and longer solar exposure, where the same glazing, parapet, and wing wall strategies are used to balance daylight, thermal performance, and glare control. In contrast, the middle floor uses smaller glazed doors with single low-E glazing and moderate balcony features, balancing daylight, glare, and heat gain under moderate solar exposure and less obstruction. This configuration avoids over-shading while ensuring efficiency, making it the most balanced floor in terms of comfort and energy performance.
Considering the balcony floor materials, the lower and middle floors feature concrete flooring, and the upper floor uses ceramic tiles to reflect solar heat better, improving thermal comfort at higher elevations. Similarly, tinted glass parapets are used on the lower and middle floors, while the upper floor employs opaque concrete for increased shading of adjacent surfaces.
3.2.2. Selection of alternative solutions
Due to the abundance of Pareto-optimal solutions and the subjective nature of architectural design, this study employed K-means clustering as a systematic method to screen and interpret solutions based on both performance metrics, supporting more informed decision-making in early design stages. K-means clustering was performed by grouping the Pareto solutions into the optimal number of clusters determined by incorporating the elbow method (Appendix B). Comparative performance analysis of the clusters and details of a representative solution from each cluster are shown in Figs. 8 and 9.
Figure 8
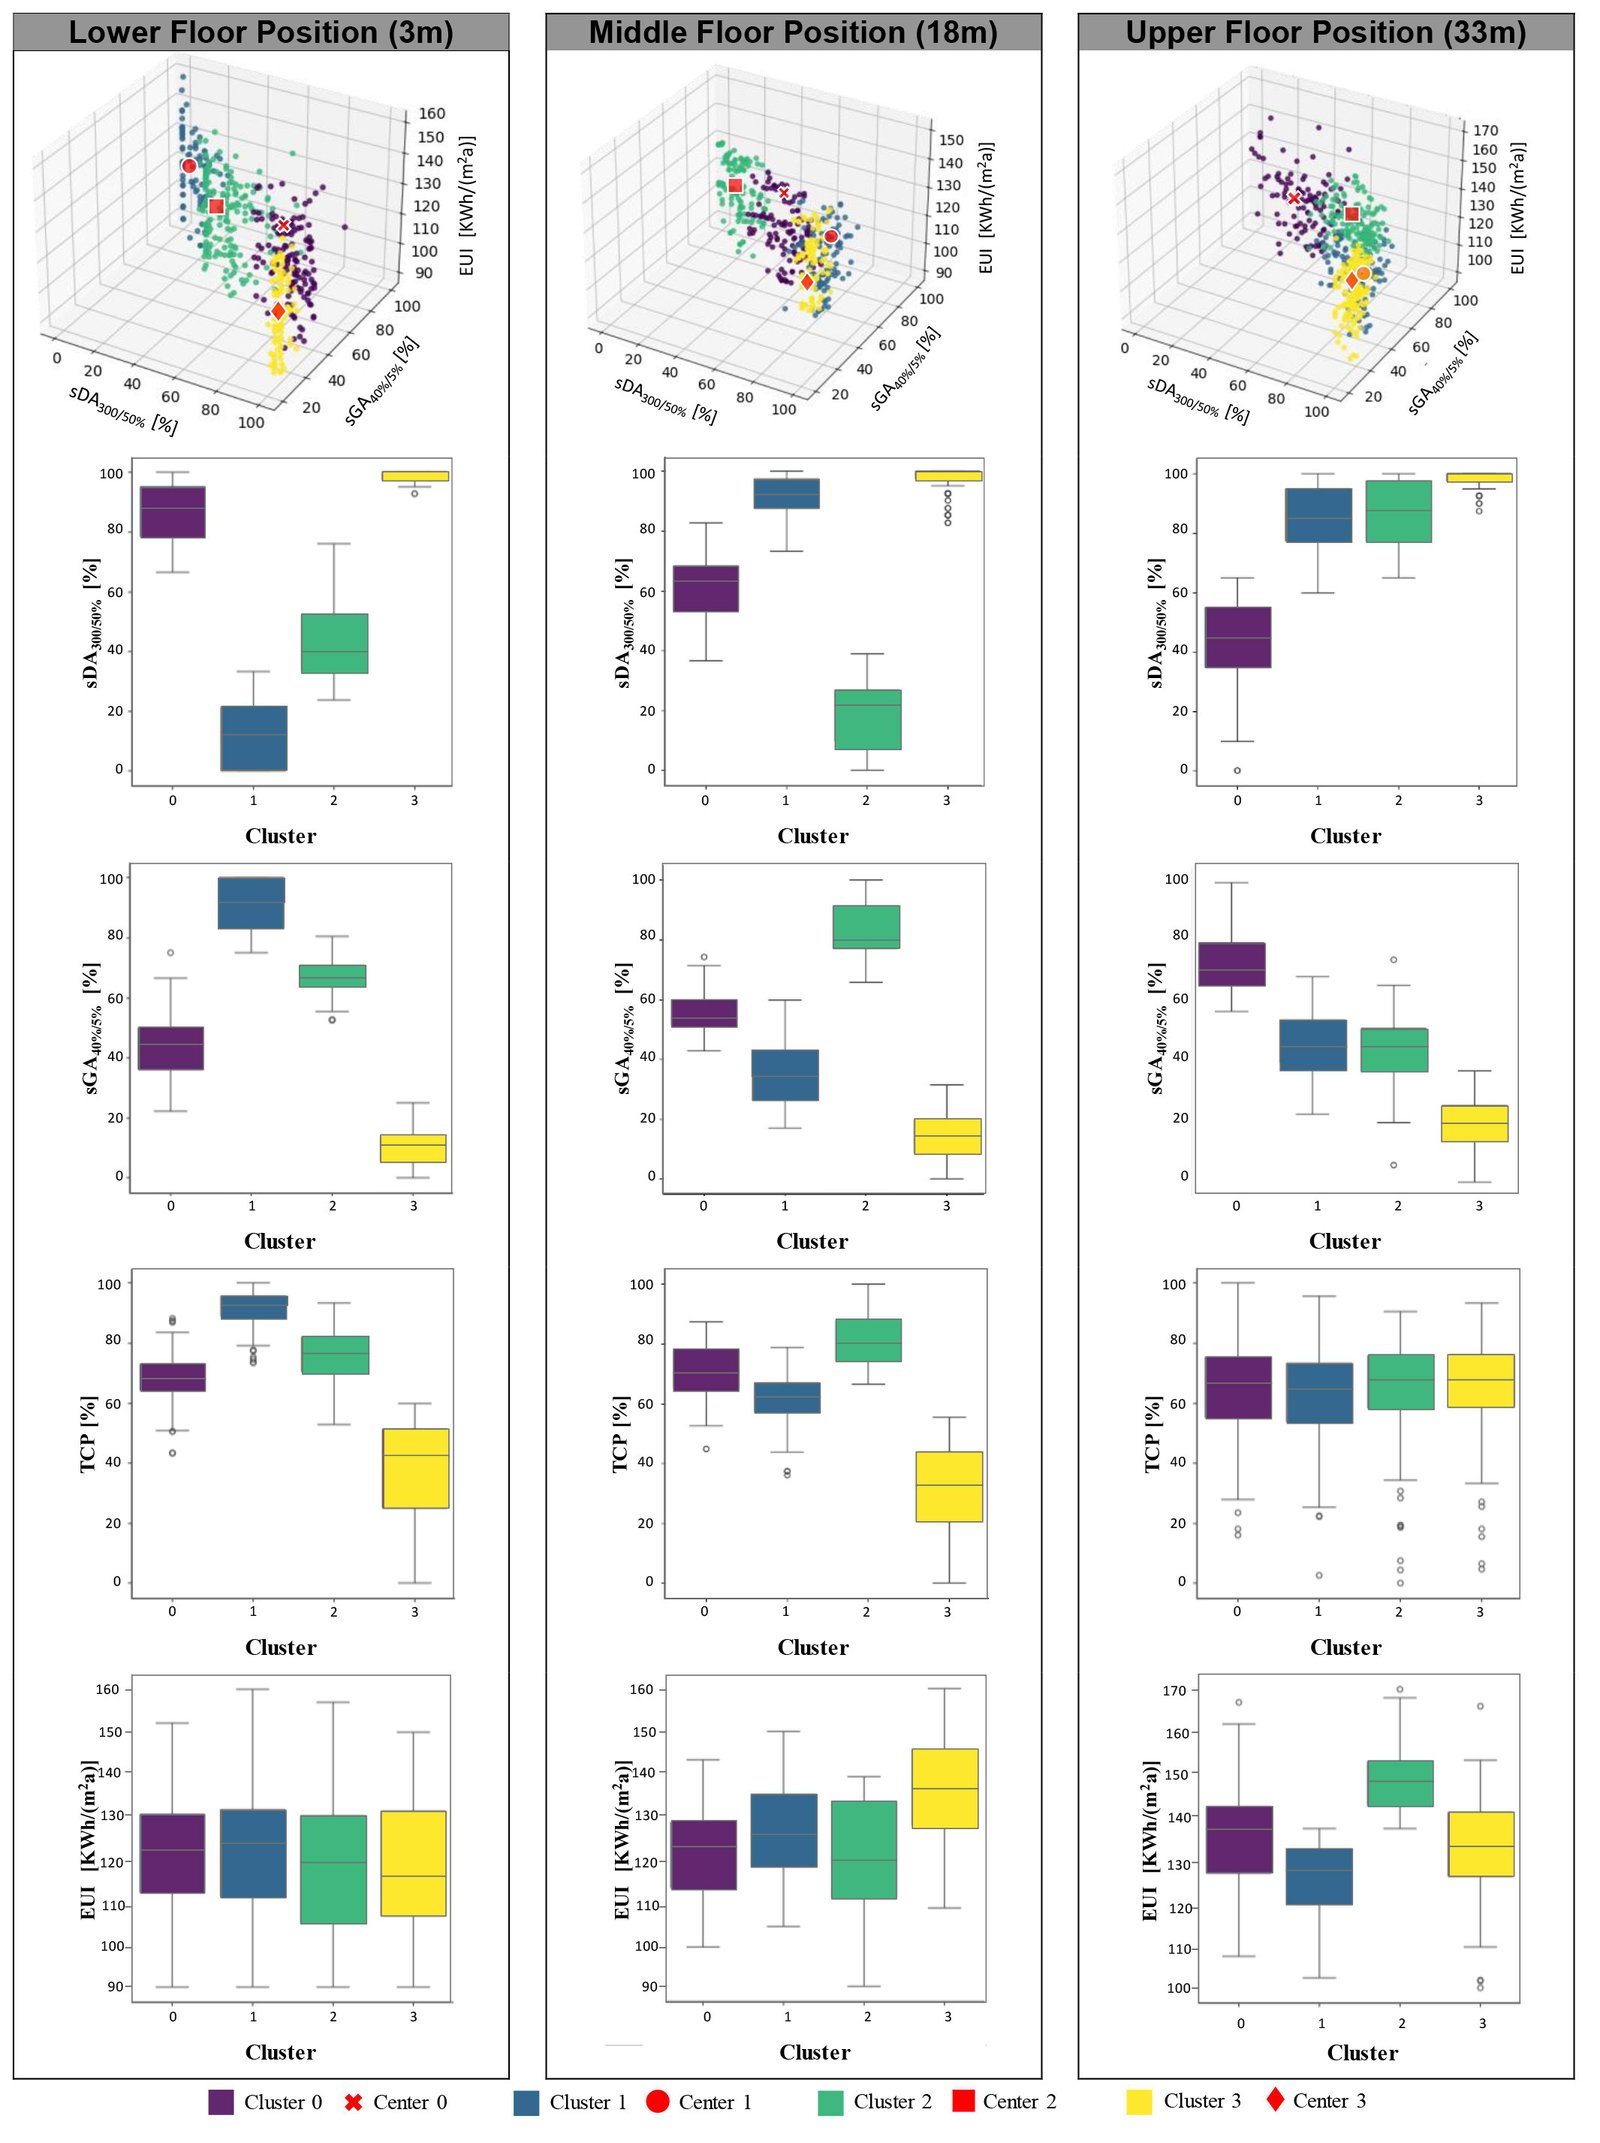
Fig. 8. Scatter plots of Pareto solutions with clusters and comparative analysis of four performance metrics across clusters for three distinct floor positions.
Figure 9
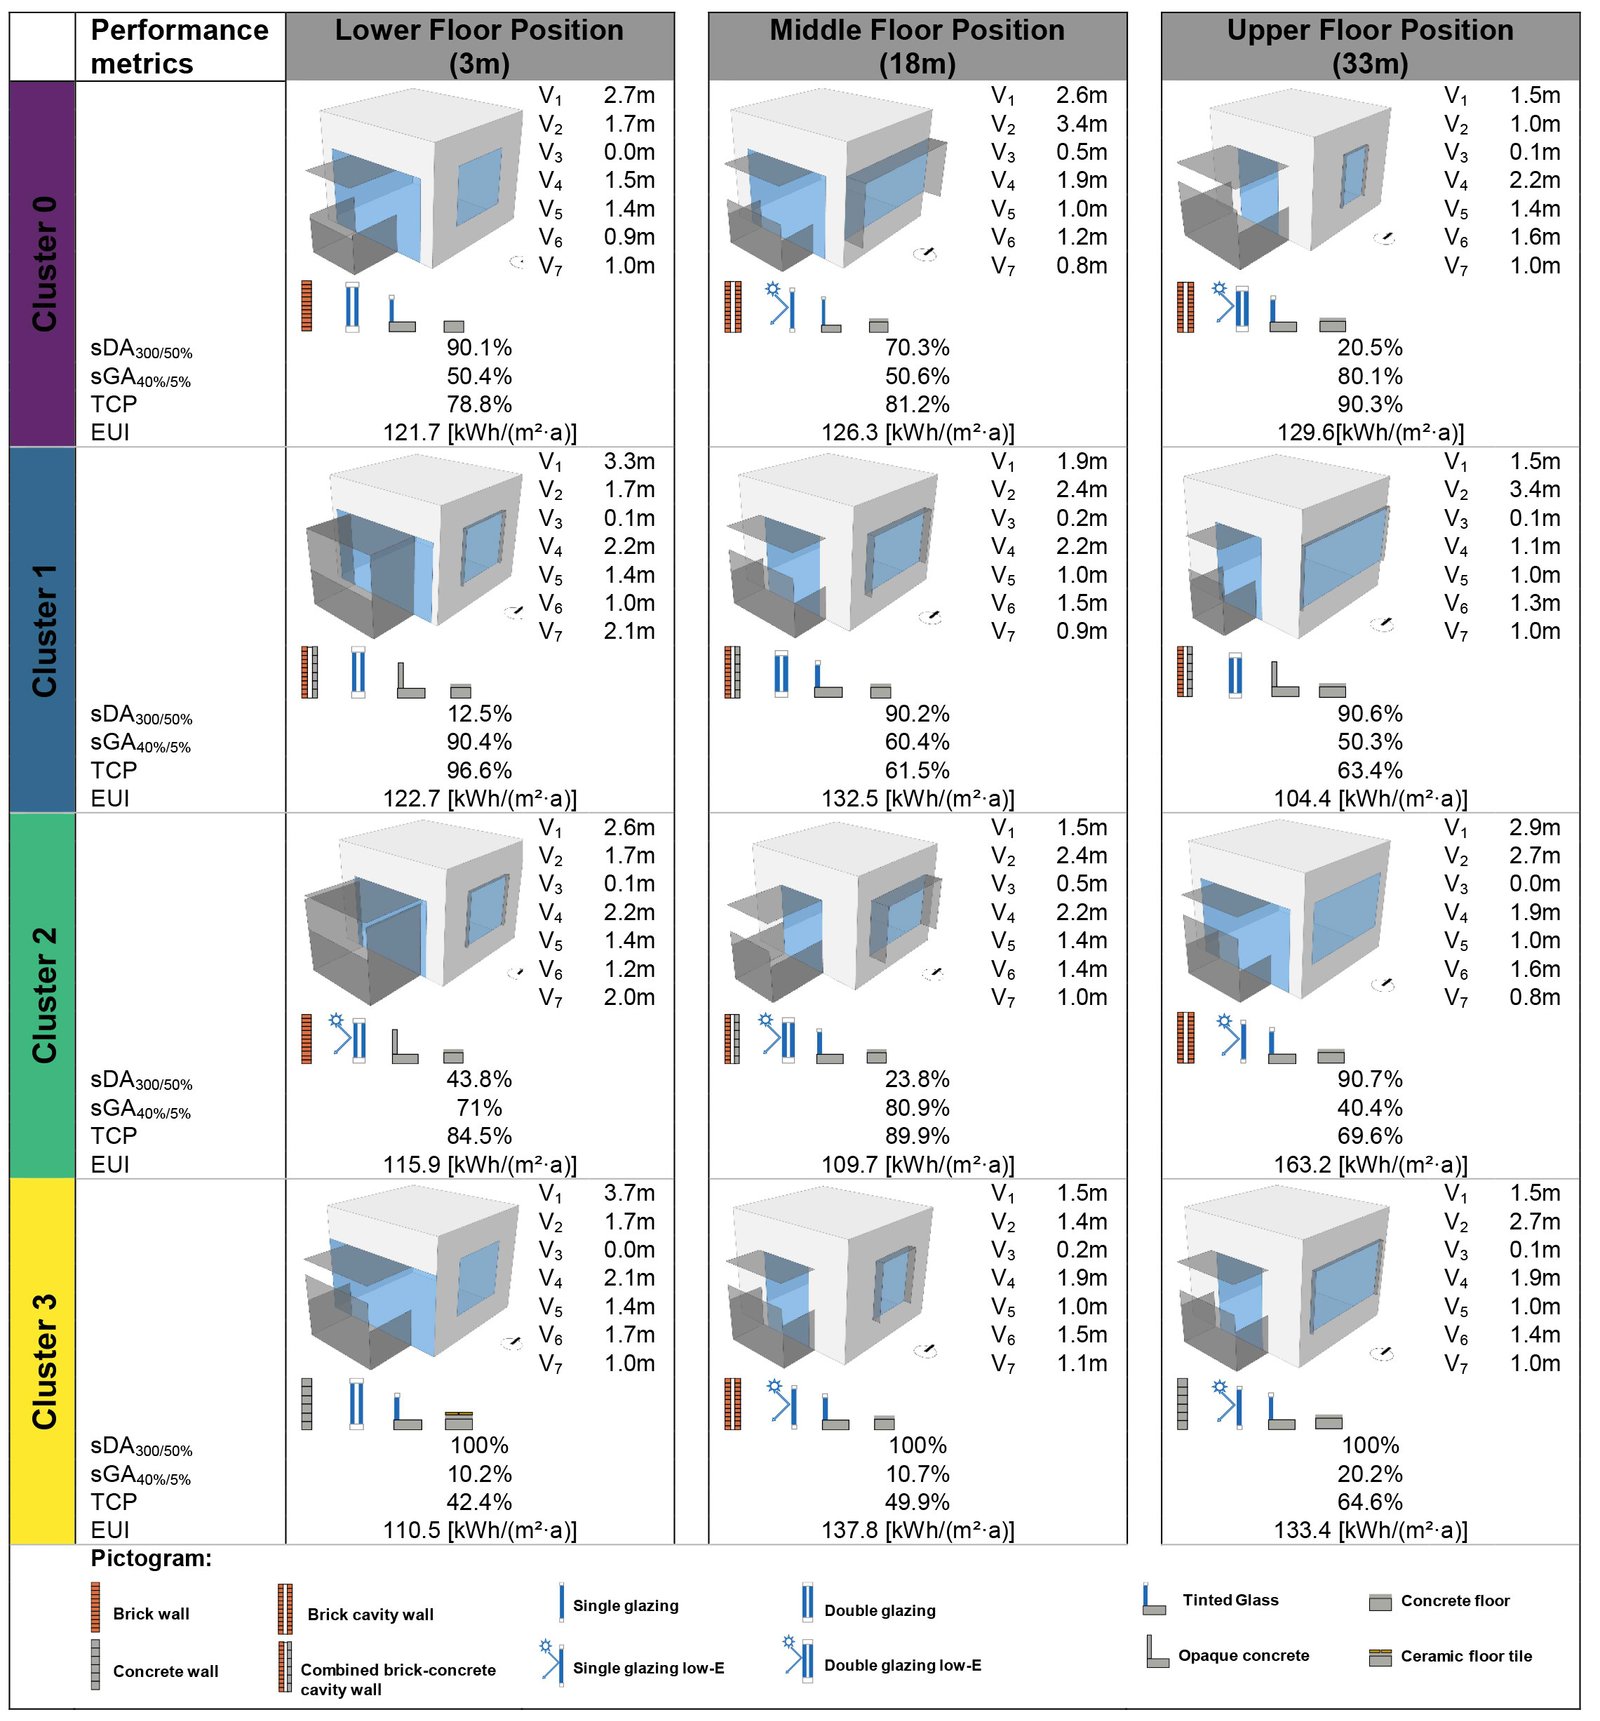
Fig. 9. Selected envelope design schemes for three floor positions based on cluster analysis.
For the lower floor position, Cluster 0 achieves high sDA300/50% and low sGA40%/5%, with average thermal comfort and energy use. It features wide glazed doors, moderate window sizes, and minimal shading and balcony features. Cluster 1 has the highest EUI and lowest sDA300/50% but performs well in glare and thermal comfort due to a wide balcony, opaque parapet, tall wing walls, and brick cavity walls- highlighting the effectiveness of these elements. Cluster 2 shows low sDA300/50% with moderate values for other metrics, reflecting the effect of reduced glazed door width and low-E double glazing for better energy performance. Cluster 3 achieves the highest sDA300/50% and the lowest EUI, though performance in the remaining two metrics is weak. Overall, results suggest an inverse relationship between daylight (sDA300/50%) and both glare (sGA40%/5%) and thermal comfort (TCP), with a positive link between sGA40%/5% and TCP. Key design variables driving cluster differences include parapet height, balcony depth, and glazed door width.
For the middle floor position, Cluster 0 demonstrates moderate performance across all four metrics. The representative solution features a wider window and a glazed door with single low-E glazing, combined with high shading and parapet height. Cluster 1 shows high sDA300/50%, low sGA40%/5% with average thermal comfort and energy performance. The solution leans toward a moderate glazed door and window with double glazing and a high parapet with tinted glass. Cluster 2 has the lowest sDA300/50% but delivers the best performance in the other three metrics. The solution is characterized by a narrow glazed door, moderate window with double glazing low-E glass along with high shading, balcony depth, and parapet height- suggesting a strong insulation and shading trade-off for daylight for improved overall performance. Cluster 3 achieves the highest sDA300/50% but underperforms in the other three metrics. The key differences between Clusters 2 and 3 representative solutions lie in shading depth, balcony configuration, and glazing type. The use of single low-E glazing in Cluster 3 boosts daylight but reduces overall comfort and efficiency. The relationships between the performance objectives are similar to those observed on the lower floor. Key design variables driving cluster differences include window width, parapet height, balcony depth, and glazing material.
For the upper floor position, Cluster 0 demonstrates the best performance in glare control (sGA40%/5%) and thermal comfort (TCP), but the lowest in daylight autonomy (sDA300/5%). This is primarily due to the use of a narrow glazed door and window, which limits direct solar penetration, thereby reducing glare and thermal discomfort. The combination with a wider and deeper balcony and a high parapet made of tinted glass further shades the openings from intense solar exposure typical of upper floors. Additionally, the use of brick cavity walls and double-glazed low-E glass enhances insulation, reducing heat transfer and improving energy efficiency. However, this high level of shading and reduced glazing area also limits daylight penetration, resulting in lower sDA300/50%. This trade-off reflects a strategy prioritizing thermal and glare comfort over maximum daylight availability.Cluster 1 demonstrates the lowest energy use with high sDA300/50%, though sGA40%/50% and TCP values are low. The key difference between cluster 0 and 1 solutions lies in the balcony configuration, window width, wall, and glazing materials. The highest window width with double glazing increases sDA300/50% but reduces sGA40%/5%. Cluster 2 exhibits the highest energy use, along with high daylighting and thermal comfort, but performs poorly in glare reduction. It features a wider glazed door and window with single low-E glazing, paired with shallow shading elements and a shallow balcony. While this configuration maximizes daylight penetration—reflected in the high sDA300/50%—it lacks sufficient control mechanisms (like deeper overhangs or taller parapets) to mitigate excessive brightness, leading to poor glare performance (low sGA40%/5%). Additionally, the increased solar gain through larger glazing areas contributes to higher cooling demand, which raises EUI, despite low-E coating offering partial mitigation. This cluster highlights how maximizing daylight without adequate shading or insulation can negatively affect both glare control and energy efficiency. Cluster 3 achieves the highest sDA300/50%, indicating strong daylight access, but also shows the lowest sGA40%/5%, reflecting increased glare. Compared to Cluster 2, a 50% reduction in glazed door width of same glazing type and a slight decrease in parapet height (0.2 m) of same type leads to a significant rise in glare risk. This suggests that the lower parapet height allows more low-angle or reflected sunlight to enter, especially on upper floors where solar exposure is intense and prolonged, highlighting its critical role in glare control despite smaller openings. Overall, results suggest an inverse relationship between sGA40%/5% and both sDA300/50% and EUI, and a positive correlation between sDA300/50% and EUI. As solar radiation is the key concern, clusters vary in how they balance between daylight and thermal mitigation through shading, materials, and balcony geometry.
3.3. Analysis of the MOO results
The MOO simulations ran for 25 generations with 20 individuals each, producing 1560 solutions across three floor positions. Comparison of the performance objectives along with design variables across the three studied floor positions is discussed in this section.
3.3.1. Analysis of the performance objectives
The spatial distribution of the entire set of optimization solutions is shown in Fig. 10 using a 4D scatter diagram, where each point denotes a distinct solution. Three performance objectives- sDA300/50% [%], sGA40%/5% [%], and EUI [kWh/(m2a)] are represented in the x, y, and z- axes, respectively, while another objective, TCP [%], is shown using a color scale. In lower floor positions, performance metrics, particularly sDA300/50% and sGA40%/5%, exhibited greater variability than in higher floor positions. Higher sDA300/50% values correlated with improved energy performance but also with lower sGA40%/5% and TCP, suggesting increased glare and reduced thermal comfort. On the contrary, solutions with better visual and thermal comfort tended to have poorer daylight availability and energy performance (Fig. 10(a)). This highlights an inverse relationship between daylight availability and the other performance metrics driven by increased solar exposure.
Figure 10
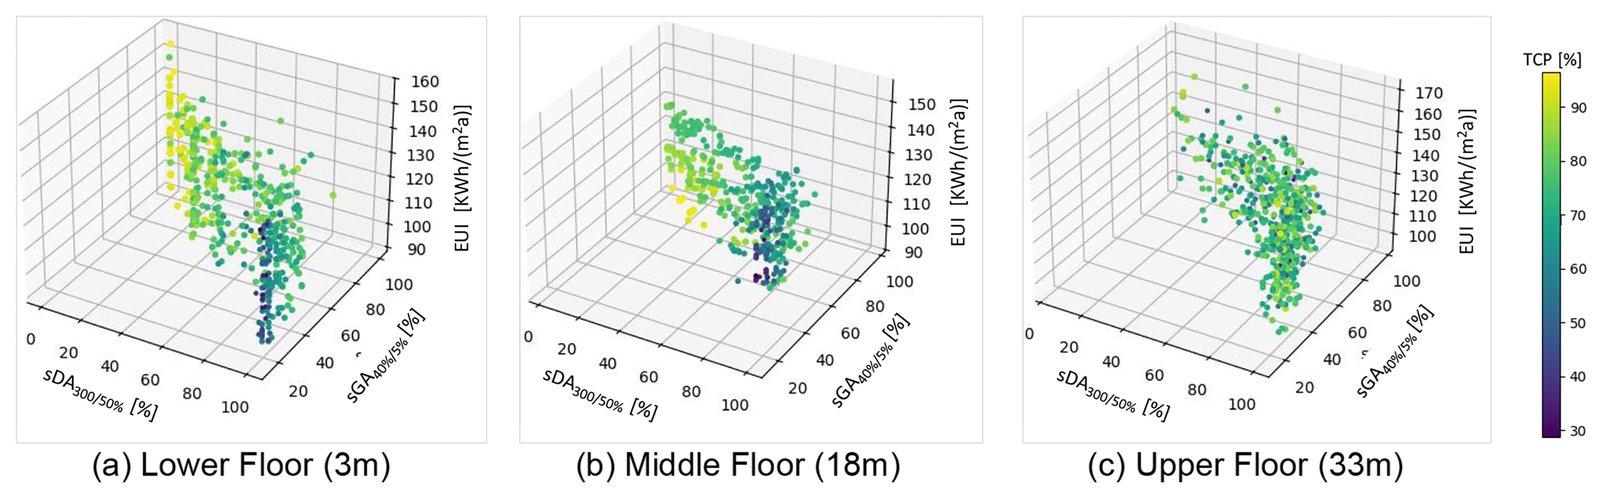
Fig. 10. Pareto front diagram obtained from MOO process for three floor positions.
The middle floor demonstrates a more balanced performance (Fig. 10(b)), with many solutions achieving a good trade-off between daylight availability and energy use. The solutions cluster in a wedge-like pattern, with fewer points at the extremes (very low sDA300/50% or very high sGA40%/5%), indicating that extreme daylight or glare conditions are less common. Points with lower EUI values (90–100 [kWh/(m²a)]) tend to occur when sGA40%/5% values are moderate (around 50%) and sDA300/50% is within the standard limit of LEED 4.1. This suggests that optimal energy performance is achieved with a balance between daylight access and glare mitigation. The solutions from the center of the graph (Fig. 10(b)) feature relatively high sDA300/50% and elevated sGA40%/5% values, contributing to improved thermal comfort and slightly lower EUI.
In the upper floor position, there is a concentration of solutions with higher sDA300/50% values (80-100%) and lower sGA40%/5% (30-50%) (Fig. 10(c)), reflecting strong daylight penetration and increased glare risk. Solutions with higher thermal comfort (80-90%) tend to coincide with higher sDA300/50% (75-80%) and higher sGA40%/5% (70-90%), along with a slight increase in EUI. This suggests that the trade-off between daylight, thermal comfort, and energy use is less pronounced in upper floors.
The value distribution of all objectives across three floor positions is compared and presented in Fig. 11. For visual comfort metrics, the median value of sDA300/50% increases from lower to upper floor positions while sGA40%/5% decreases, indicating a higher risk of glare on upper floor positions. In the case of thermal comfort, the lower floor shows the highest median TCP, which gradually declines with floor position. EUI values are increasing with the floor height. The Upper floor position has a higher EUI, suggesting higher cooling loads due to solar gains. The Middle floor performs slightly better in terms of energy use.
Figure 11
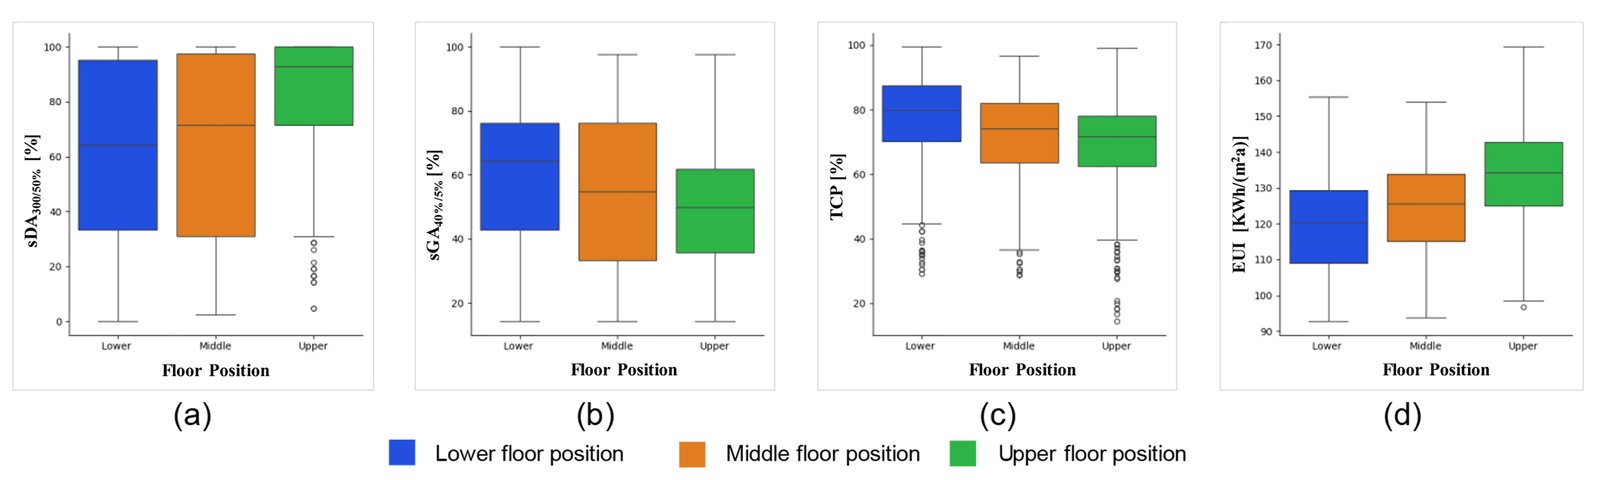
Fig. 11. Comparison of performance objectives- (a) sDA300/50%, (b) sGA40%/5%, (c) TCP and (d) EUI, across three floor positions.
To sum up, the upper floor position is best for daylight availability (sDA300/50%), but at the cost of a higher risk of glare, energy use, and slightly reduced thermal comfort. On the contrary, a lower floor position is best for thermal comfort and energy performance, but has limited daylight availability (sDA300/50%). The middle floor offers the most balanced trade-off among all four performance objectives, potentially making it the most optimal choice.
3.3.2. Analysis of the design variables
The distribution of design variables related to the envelope (V1–V3) and balcony geometry (V4–V7) in Pareto-optimal solutions is analyzed using violin plots (Fig. 12) to highlight variations across the three floor positions. The width of each violin indicates the concentration of solutions at specific variable values, revealing how each parameter varies for optimal performance across floor levels. In the case of glazed door width, the median decreases from 2.8 m on lower floors to 2.6 m on upper floors, suggesting a need for wider doors on lower levels to ensure adequate daylight. A bimodal distribution on lower floors, with peaks near 1.8 m and 3.5 m, indicates a mix of narrow and wide openings. In contrast, middle floors show a higher density at 1.5-1.8m, reflecting a conservative design to balance performance metrics. Upper floors display a smoother distribution, with a preference for larger doors (peaking around 2.5–3 m). For window width, the median decreases from 1.7 m (lower floor) to 1.4 m (middle floor) and increases to 2.5 m on upper floor. The lower floors skew toward 1.5–1.8 m, suggesting smaller openings to manage glare, heat, and energy use. The Middle floor shows a bimodal distribution (peaks at 1.4 m and 3 m), while the upper floor exhibits a broader, smoother distribution, peaking at 2.5–3 m, indicating a preference for larger windows.
Figure 12
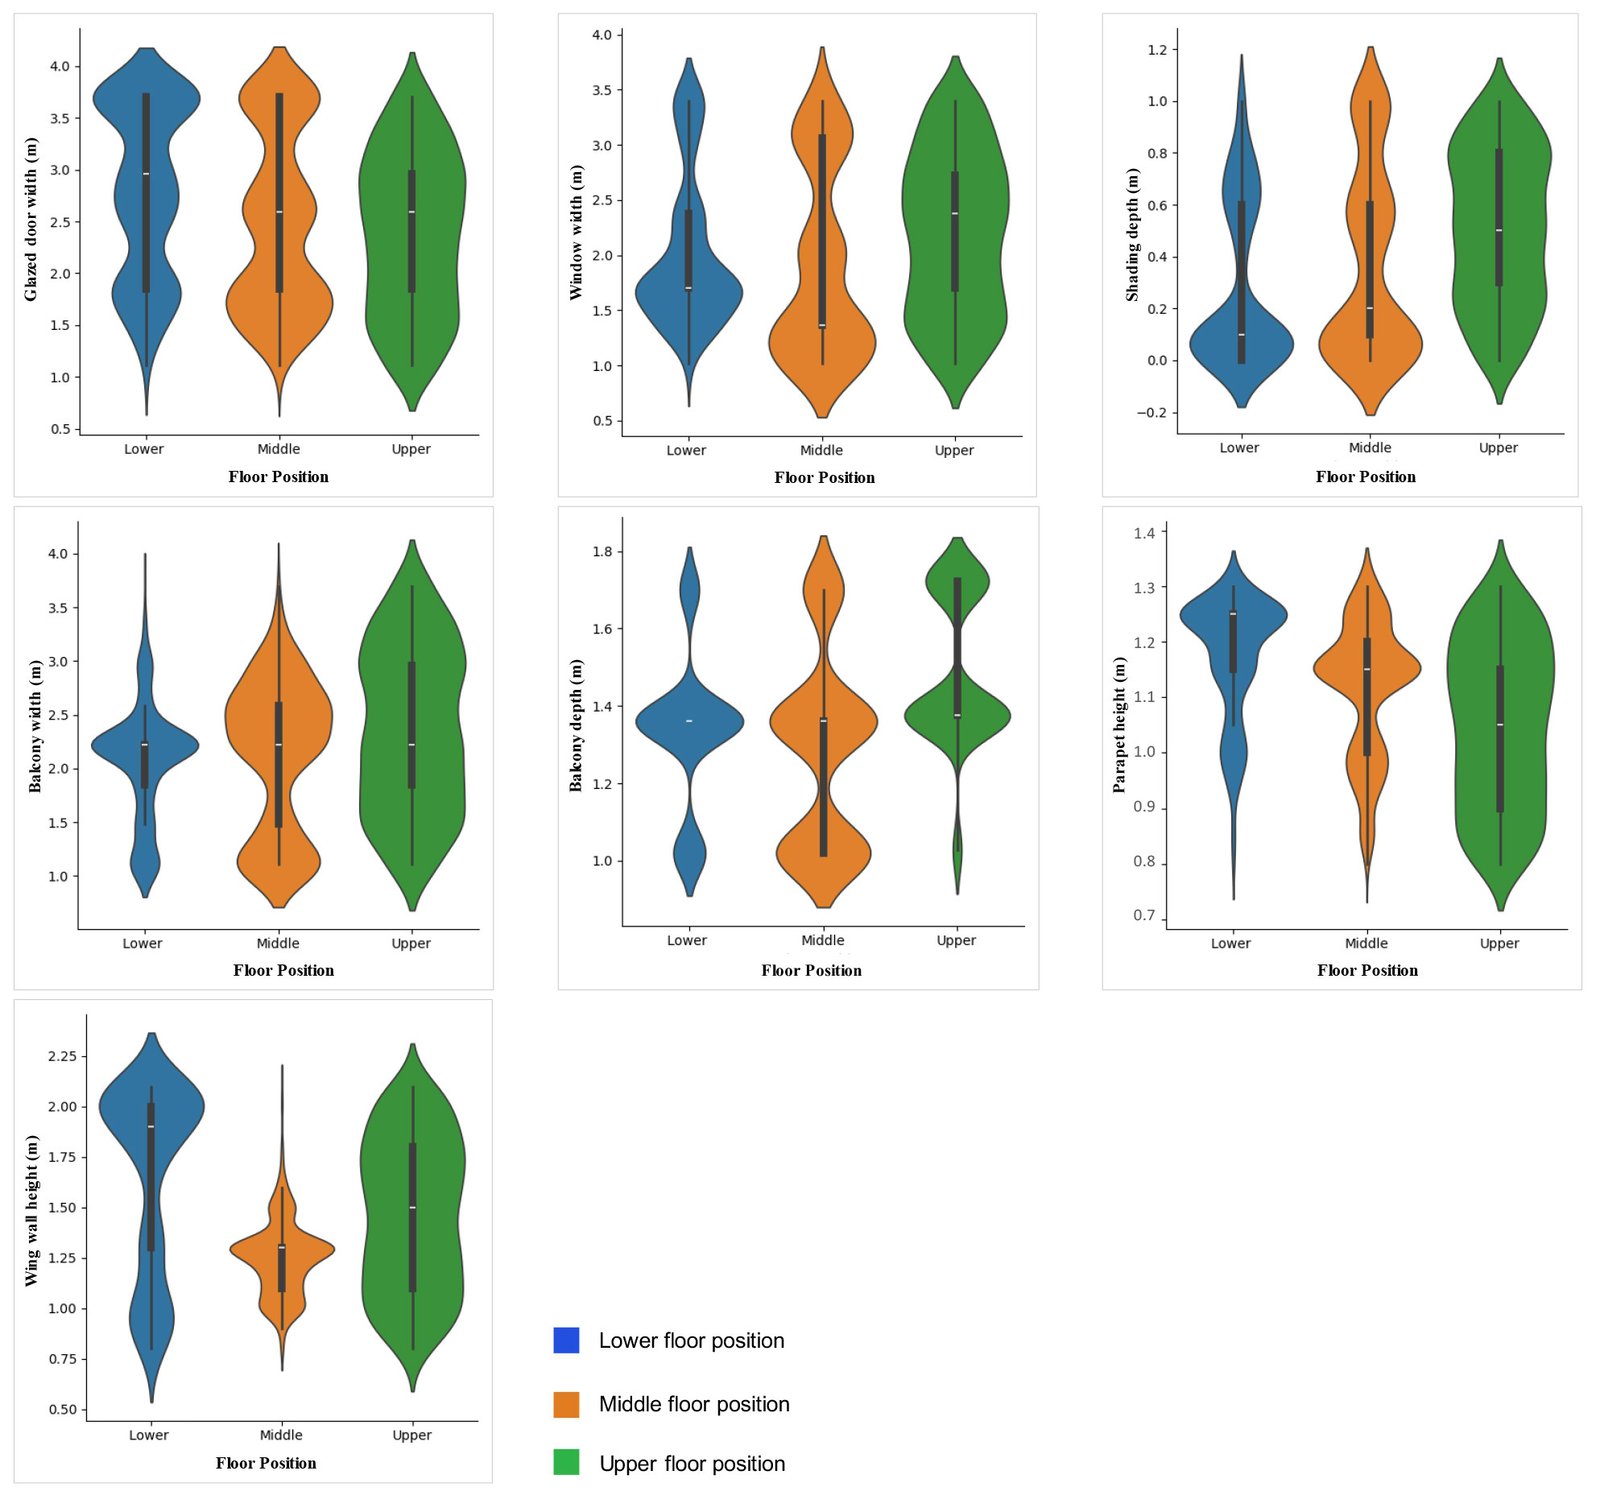
Fig. 12. Distribution of envelope and balcony geometry variables in Pareto solutions of the three floor positions.
The median shading depth increases from lower to upper floors, helping reduce glare and cooling energy demand for larger windows on upper floors. On the lower floor, the distribution peaks at the median of 0.1 m, with 50% of Pareto solutions exceeding this value. On the middle floor, the median rises to 0.2 m with a similar peak at 0.1 m, and half the values lie above 0.2 m. The upper floor shows a broader, smoother distribution, peaking between 0.8 and1.0 m, reflecting a preference for deeper shading.
The median balcony width across all floors is 2.1 m. The lower floor shows limited variation, with a strong concentration at 2.1 m and a smaller peak at the lower end (1.0–1.3 m), indicating a preference for narrower balconies. The middle floor displays a bimodal distribution (peaks at 1.0 and 2.5 m), reflecting a mix of small and wide balconies in the Pareto solutions. The upper floor has a broader, smoother distribution with peaks between 1.5 and3.2 m, suggesting a preference for wider balconies to provide shade for larger windows. In case of balcony depth, the median value of all floor positions is 1.3 m, but the middle floor shows the most significant variation. Its wide spread (1.0–1.6 m) and peaks suggest diverse balcony designs, with a slight skew toward smaller depths. In contrast, the lower and upper floors have more consistent balcony depths with a notable concentration around 1.3m. The upper floor also shows a distinct peak at 1.6 m, indicating the presence of deeper balconies.
Parapet height shows a decreasing median from lower to upper floors. The lower floor has limited variation, with a strong concentration at 1.2 m and a minor peak at 0.9–1.1 m, reflecting a preference for higher parapets to block low-angle sunlight reflected from nearby surfaces and reduce glare (sGA40%/5%). The middle floor shows a bimodal distribution (peaks at 0.8 and 1.1 m) with a median of 1.1 m, indicating a balanced design aligned with glazed door widths. The upper floor exhibits a broader, smoother distribution, peaking between 0.9m and1.2 m with the median at 1.0m, suggesting a shift toward lower parapets to reduce the surface area exposed to direct solar radiation and thus reduce overheating. Overall, parapet heights are adjusted floor-wise to respond to specific environmental needs- higher for glare control below, lower for daylight and thermal comfort above. Similar to the parapet height, the highest median for wing wall height is observed on the lower floor peaking around 1.8 m, though 50% of the Pareto solutions have wing wall height between 1.3-1.8m. The middle floor shows less variation, with a median of 1.25 m and a noticeable concentration between 1.25 and 1.4 m. The upper floor exhibits a broader, smoother distribution, peaking between 1.6 and 1.8 m, with a median of 1.5 m, suggesting a shift toward taller wing walls to mitigate direct solar radiation and thus reduce overheating and glare.
Figure 13 presents stacked bar charts illustrating the frequency distribution of material variables (V₈–V₁₁) across the Pareto-optimal solutions for the lower, middle, and upper floor positions. The numerical values are included within each bar segment to aid quick comparison. This dual-layer visualization captures both floor-wise variation and overall material preference. Among the wall types, combined brick-concrete cavity walls show the highest total frequency (496 occurrences: 97 in lower, 177 in middle, 222 in upper floors), followed by brick cavity walls (459 occurrences: 153 lower, 138 middle, 168 upper). These two types dominate due to their low U-values (Table 2), offering superior thermal resistance. Notably, brick cavity walls are more prominent in lower floors where moderate insulation is sufficient, while combined cavity walls are preferred on upper floors due to greater solar exposure. Concrete walls and brick walls are less frequently selected, with total counts of 316 and 289, respectively.
Figure 13
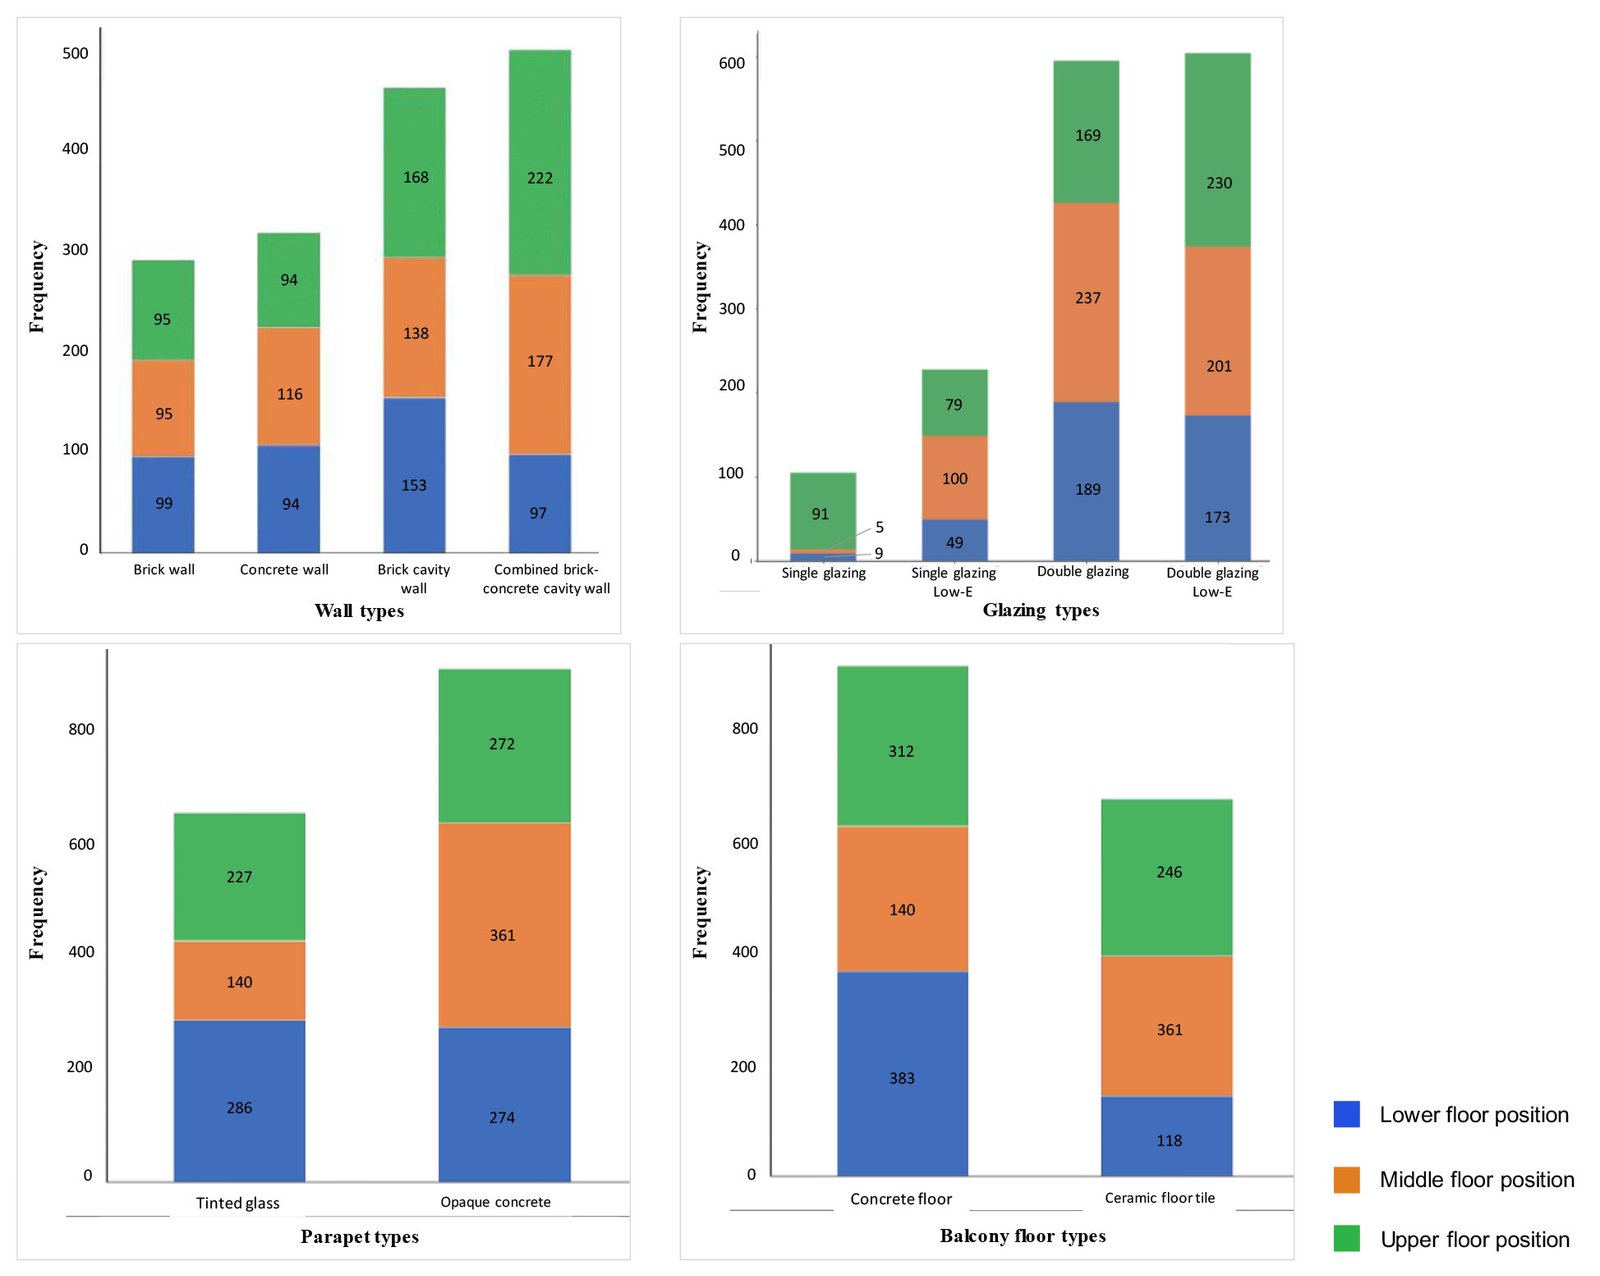
Fig. 13. Distribution of wall, glazing, parapet and balcony floor types in Pareto optimal solutions of three floor positions.
In glazing, double glazing (total 595) and double glazing low-E (604) dominate across all floor levels, owing to their lower SHGC values (Table 3), which help reduce heat gain while maintaining adequate daylight. Specifically, double glazing is most frequent on lower (189) and middle floors (237), In contrast, double glazing low-E is predominant in the upper floors (230), reflecting the need for enhanced insulation at higher elevations. Single glazing and single glazing low-E show significantly lower frequencies (105 and 228 total, respectively), indicating reduced effectiveness in meeting comfort and energy goals.
The preference for opaque concrete parapets is evident, with the highest overall count (907: 274 lower, 361 middle, 272 upper), likely due to its better solar blocking properties. Tinted glass parapets, totaling 653 (286 lower, 140 middle, 227 upper), are more prevalent on the lower floor where direct exposure is limited. The similar frequency of both types on lower floors suggests that parapet material plays a less dominant role in that context.
Concrete floors are most frequently selected (total 835: 383 lower, 140 middle, 312 upper), indicating a strong preference for materials that help mitigate glare and overheating, especially in lower and upper floors. In contrast, ceramic floor tiles are used less often (724: 118 lower, 361 middle, 245 upper), with the highest concentration in middle floors. This could be due to moderate exposure and less intense solar gain at that elevation.
Overall, the distribution shows clear material preferences aligned with floor-specific performance needs. Combined cavity walls and double-glazing (with and without low-E coatings) are essential for ensuring thermal performance. Opaque concrete parapets and concrete floors are consistently effective in controlling heat and glare.
3.3.3. Sensitivity analysis
To identify key design elements influencing each performance objective and support early-stage design decisions, a Sobol sensitivity analysis was conducted. Sobol's approach is model-independent, requiring no assumptions about linearity, monotonicity, or input variable distributions. In this study, the total-order Sobol index (ST) and second-order Sobol index (S2) were calculated to quantify the impact of individual and combined design variables on the variance of four performance metrics (sDA300/50%, sGA40%/5%, TCP, and EUI). The design variables were ranked according to the ST value for each performance metric and compared across three different floor positions Fig. 14. In the case of sDA300/50% (Fig. 14(a)), due to obstructions, parapet height and shading depth are most influential on the lower floor, while on the middle floor, parapet height and balcony depth gain importance. In contrast, the upper floor is primarily influenced by glazed door width and window width due to greater solar exposure. This indicates a clear shift from obstruction-related elements to glazing variables as floor height increases. For sGA40%/5% (Fig. 14(b)), the pattern of dominant variables resembles that of sDA300/50%, with parapet height and shading depth being most influential on the lower floor. On the middle floor, balcony width and shading depth take prominence. Similarly, on the upper floor, the key influencing variables for sGA40%/5% align with those identified for sDA300/50%. However, the impact of window width on the east façade shows a clear increasing trend from the lower to upper floors for both sDA300/50% and sGA40%/5%, indicating that in the lower and middle floors, daylight primarily enters through the glazed door attached to the balcony due to surrounding obstructions.
Figure 14
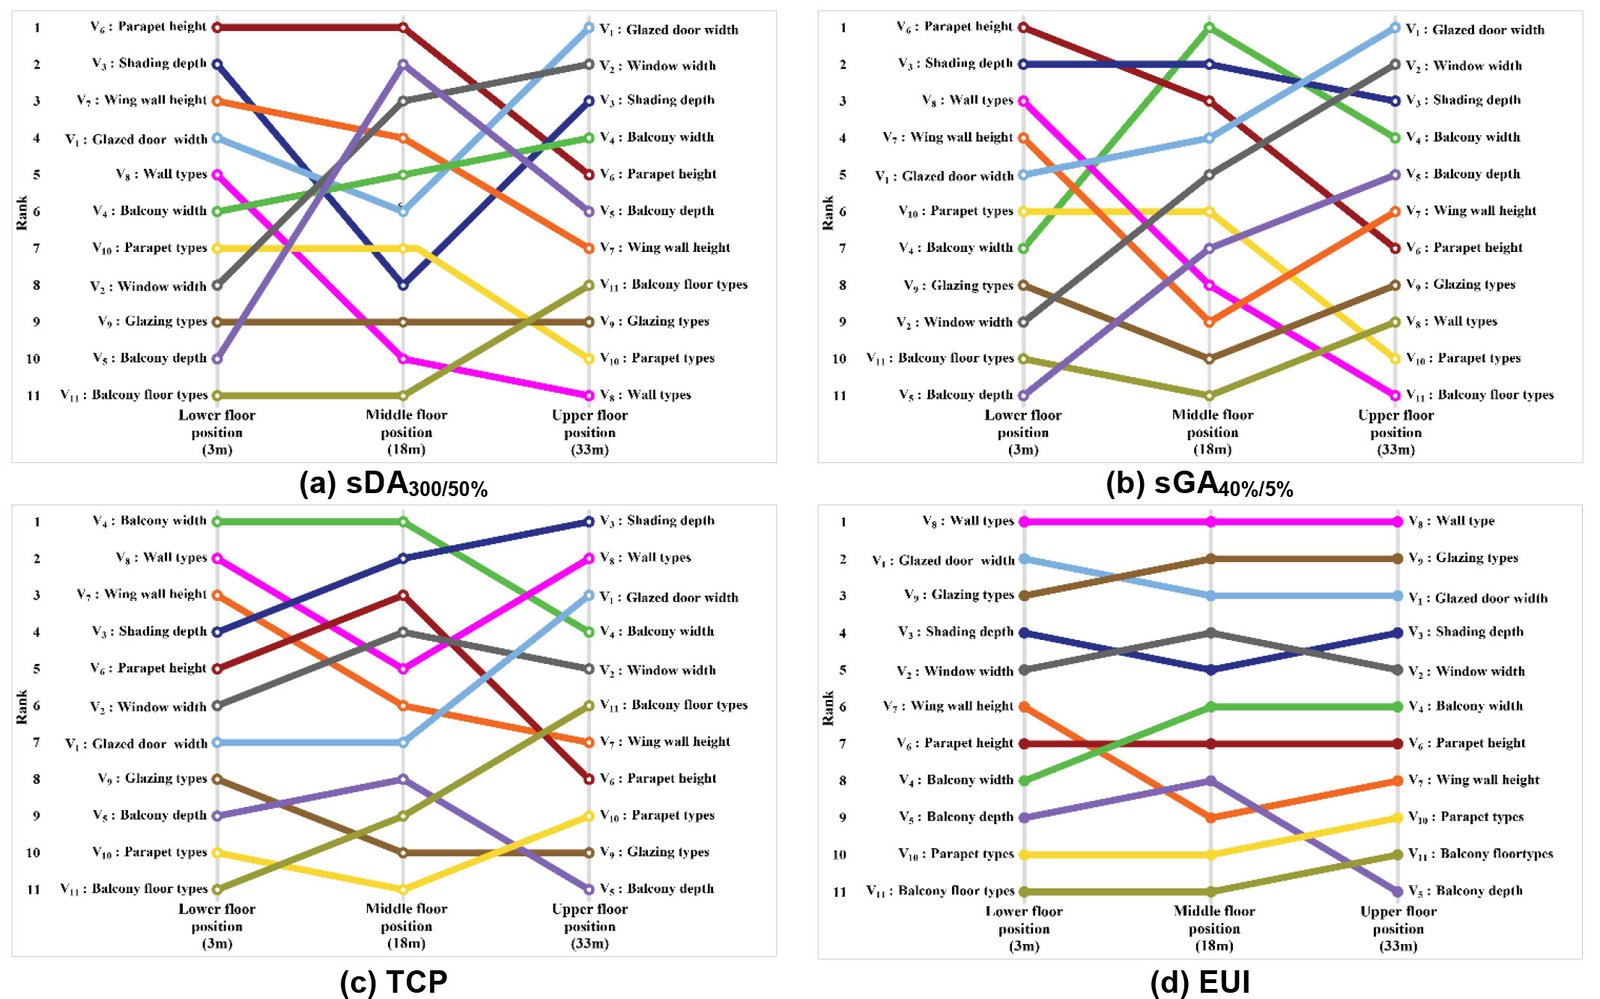
Fig. 14. Bump chart illustrating the ranking of design variables across three floor positions, based on four performance metrics derived from Sobol's sensitivity analysis.
For thermal comfort (Fig. 14(c)), balcony width and wall types hold the top ranks on the lower floor, while shading depth and wall types lead on the upper floor. On the middle floor, balcony width and shading depth emerge as the most influential variables. Overall, shading features and wall construction are key in regulating thermal comfort, particularly on the upper and lower levels. In the lower and middle floors, the east-facing window width has a greater impact on thermal comfort than the south glazed door, as it receives intense morning sun. In contrast, the south façade remains shaded by balconies and surrounding obstructions. However, on the upper floor, the impact of the south-glazed door width surpasses that of the east window due to reduced obstruction and prolonged direct solar exposure. While the east window still contributes to morning heat gain, its influence is lower compared to the intensified solar load from the south. In a hot-humid city like Dhaka, south-facing surfaces become increasingly vulnerable to solar gain at higher elevations.
For energy consumption (Fig. 14(d)), wall types consistently rank highest, highlighting the significant impact of envelope materials on energy performance. Glazing types appear as the next most influential, ranking second on both the middle and lower floors for managing intense solar radiation. The width of the south-glazed door plays a more dominant role in energy efficiency than the window width of the east across all floor levels due to its orientation, larger surface area, and solar exposure duration, while window width shows moderate influence, affected more by early-day solar gains and contextual shading. The results of the sensitivity analysis suggest that distinct design priorities based on performance goals are needed for different floor positions.
To investigate and quantify the pairwise interactions between design variables and performance objectives, second-order Sobol indices were calculated and are presented in Fig. 15. The strongest interactions are observed on the lower floors, particularly for sDA300/50% and sGA40%/5%. For sDA300/50%, the most significant interaction is between parapet height (V6) and wing wall height (V7), while for sGA40%/5%, it is between balcony width (V4) and balcony depth (V5)- highlighting the role of balcony configuration in regulating visual comfort. The highest interaction for TCP occurs between balcony width (V4) and wall material (V8), indicating that wall material influences the shading effectiveness of balconies to enhance thermal comfort.
Figure 15
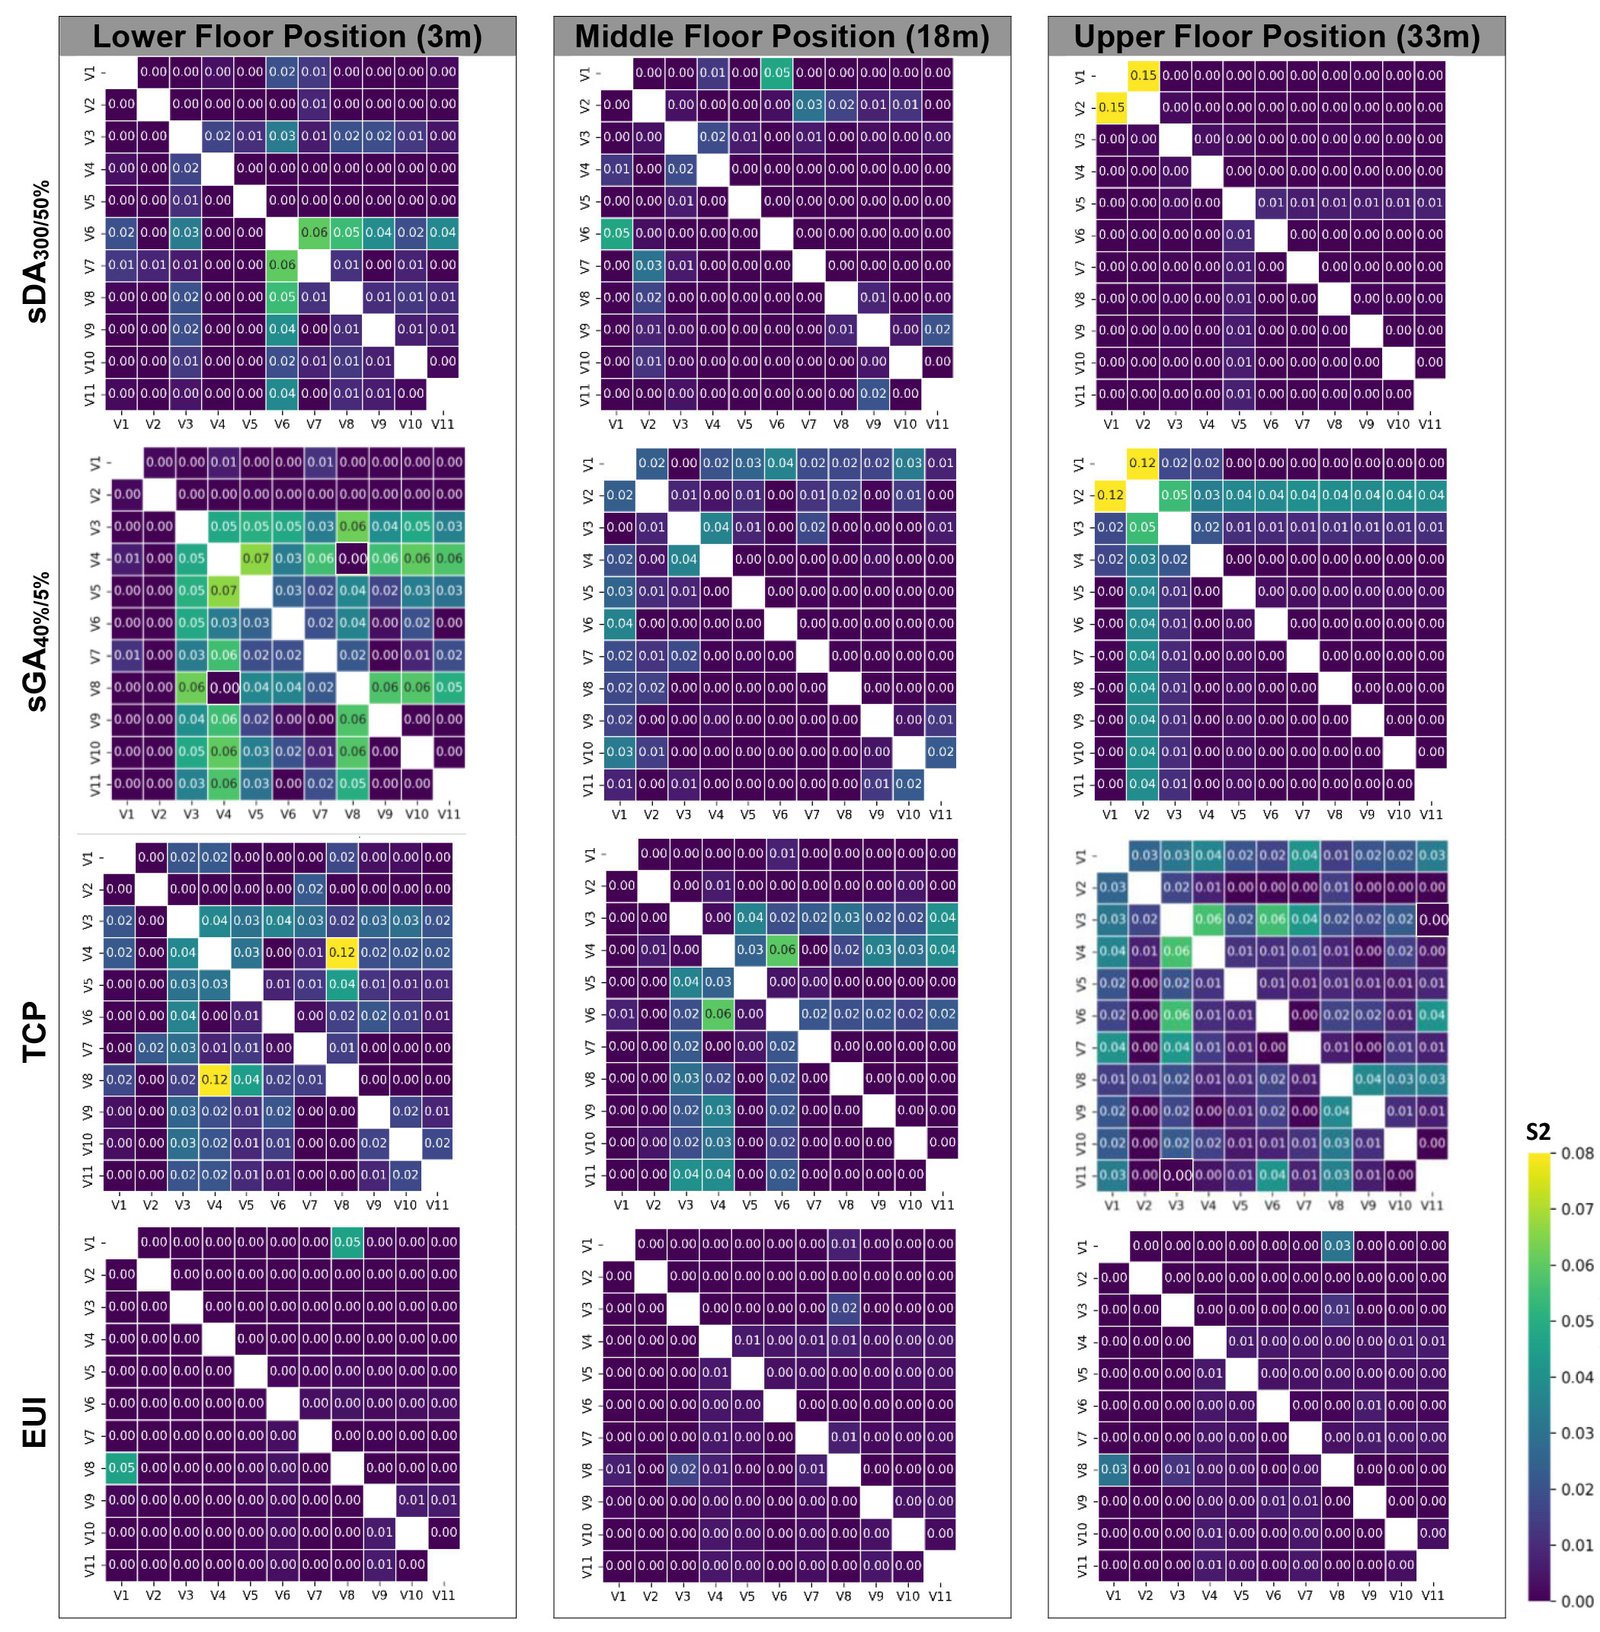
Fig. 15. Heatmap of second-order Sobol's indices on the four performance objectives across three floor positions.
The middle floors show the weakest second-order interactions, indicating that performance is more influenced by individual design variables. For sGA40%/5% and TCP, the strongest interactions involve parapet height (V6) paired with glazed door width (V1) and balcony width (V4), respectively.
Upper floor position presents moderate interaction effects, mainly between glazing and shading variables due to higher solar exposure. The strongest interaction- between glazed door width (V1) and window width (V2) for both sDA300/50% and sGA40%/5%- highlights the dominant role of glazed area in visual comfort. For thermal comfort, the key interaction is between shading depth (V3) and balcony depth (V4), underscoring the importance of shading. Across all floors, EUI shows minimal second-order interactions, indicating that energy use is primarily governed by individual envelope materials (wall and glazing types) (Fig. 14).
4. Discussion
This study applied multi-objective optimization (MOO) to refine the envelope and balcony design of residential bedrooms across three distinct floor levels, aiming to improve visual comfort, thermal comfort, and energy performance. The results demonstrate that an optimal combination of design parameters varies significantly depending on the floor position, emphasizing the need for floor-specific strategies. Prior studies have primarily focused on limited aspects of balcony or window design and specific performance metrics, without considering the influence of floor position and surrounding context. Consequently, direct comparisons with earlier research remain limited due to differences in space types, methodological approaches, and performance metrics.
A previous study suggested that a 2-meter deep balcony paired with a 3-meter wide glazed door works well for all orientations and floor levels of an office space in the subtropical climate of São Paulo, Brazil [17]. However, the current study offers a different perspective by incorporating the envelope and surface materials of the balcony. Balcony design is found to be interdependent with wall and glazing materials, parapet height, and glazed door width, varying by floor position. On the lower floors, optimal visual, thermal, and energy performance is achieved through a combination of a wide glazed door (3.2 m) and window (3.1 m) with double-glazed clear glass, paired with a 0.7 m shading depth. This is complemented by a widest (3.3 m) and moderately deep balcony (1.4 m), along with a high parapet (1.4 m) and wing wall (2.1 m). In contrast, the middle floor achieves balanced performance with smaller glazed door and window openings (1.4 m each) using single-glazed low-E glass, combined with a deeper shading depth of 1.0 m. A moderate balcony configuration—1.4 m in both width and depth—paired with a high parapet (1.3 m) and a lower wing wall (1.1 m) proves to be effective. On the upper floor, performance is balanced through a wider glazed door (2.6 m) and a small window (1.4 m) with double-glazed clear glass, along with a 1.0 m deep shading element. This is supported by the wider (3.0 m) and deepest (1.7 m) balcony, a lower parapet (1.1 m), and a moderately tall wing wall (1.8 m). This highlights that comparisons are performance-based rather than specification-based. The optimization framework consistently uses the same variable space and objectives, enabling fair comparison of context-specific design trade-offs. Another study recommended that a deep-shaded balcony combined with enhanced thermal insulation can reduce energy usage up to 12.72%, particularly with a deeper balcony [8]. The current study reported similar improvement in energy consumption, ranging from 7.7% to 10.7% depending on floor level. Moreover, it showed improvement in other metrics also. The highest improvements of 23.7%, 10.2% and 16.8% are observed in the case of sDA300/50%, sGA40%/5%, and TCP across three floor positions.
Previous studies identified window width, balcony presence, and depth as key factors influencing daylight, glare, and thermal performance [9,50-52]. In contrast, through sensitivity analysis, the present study revealed that design priorities vary across floor positions and performance objectives. Parapet height, shading depth, and envelope material were critical for daylight, glare, and energy use in lower and middle floor positions. However, glazed door width primarily influenced glare on upper floors. This divergence results from differences in methodological approaches, as earlier studies did not comprehensively examine balcony design variables alongside envelope variables. Unlike previous works, this study incorporated variables such as parapet height and type, wing wall height, and balcony surface materials and optimized for four performance metrics (sDA300/50%, sGA40%/5%, TCP, and EUI) considering the surrounding context across three floor positions.
5. Conclusion
This study developed a framework to optimize envelope and balcony designs for residential bedrooms in high-rise apartments across different floor positions, aiming to enhance visual and thermal comfort as well as energy performance while considering the surrounding context. A parametric model integrated with multi-objective optimization and multi-criteria decision-making was employed. Envelope geometry, balcony configuration, and material types were comprehensively analyzed through a prototype south-facing high-rise residential building in Dhaka, demonstrating the framework's effectiveness.
The following are the key findings of this study:
- Impact of floor positions on performance objectives: Despite identical envelope features, significant performance differences across floor positions of the base case challenge the conventional repetitive envelope designs in high-rise residential buildings. Results demonstrated that upper floors offer better daylight but face higher glare, energy use, and reduced thermal comfort; lower floors perform better in thermal comfort and energy use but have limited daylight, while middle floors provide the most balanced performance across all objectives.
- The optimal solutions for three floor positions: The optimal solutions vary across floor positions. Lower floors benefit from wide glazed openings, shallow shading, wider balconies, and high parapets to enhance thermal comfort and reduce glare from surrounding reflections. Middle floors favor smaller openings, deeper shading, moderate balcony features, and low-E glazing for balanced performance. Upper floors incorporate wider openings, reflective materials, and deeper balconies with opaque parapets to manage higher solar exposure.
- Decision-making according to preferences: Each project demands tailored trade-offs based on design priorities. Cluster analysis revealed varied solutions emphasizing individual performance goals. For instance, prioritizing energy efficiency on upper floors results in smaller glazed openings, deeper balconies, shallow shading, and the use of low U-value wall materials, low-SHGC glazing, tinted glass parapets, and concrete balcony flooring.
- Sensitivity of design variables: Sensitivity analysis revealed the need for floor-specific design strategies aligned with distinct performance objectives. For example, visual comfort on lower and middle floors is driven by parapet and balcony width, while glazed door width dominates upper floors.
- Correlation between design variables: The interaction of design variables affects the performance objectives which vary across floor positions. Second-order Sobol analysis highlighted strong balcony-related interactions on lower floors, minimal interactions on middle floors, and moderate glazing-shading interactions on upper floors for glare and thermal comfort. Energy use (EUI) remains controlled mainly by individual envelope materials.
The proposed framework can be applied to a variety of building types, offering designers practical guidelines not only for early design stages but also for renovation and refurbishment. Visual charts further aid in comparing design alternatives to support informed decisions. Additionally, the approach may inform future building codes and guidelines for envelope and balcony design. However, the study is limited to a specific balcony type and south orientation. Future work should explore varied balcony configurations, positions, wing wall inclinations, and the effects of balcony features on indoor and outdoor airflow patterns.
Appendix A
Table A1
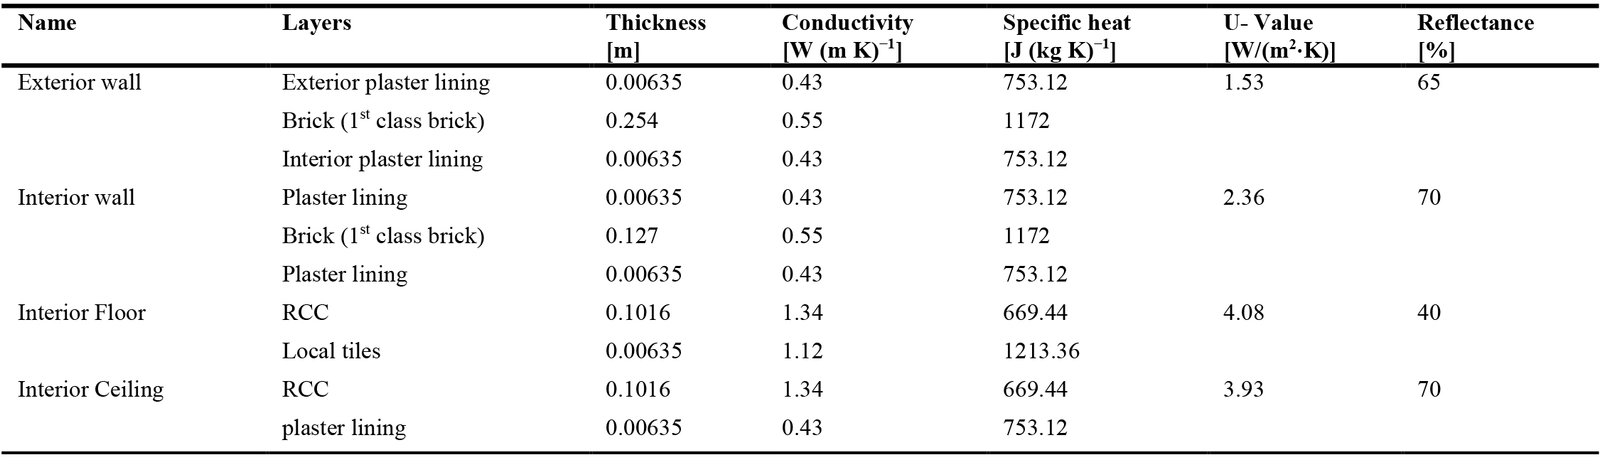
Table A1. Thermal properties of the base case materials.
Appendix B
To identify the optimal number of clusters for each dataset obtained from MOO (lower, middle, and upper floors), the elbow method was applied by calculating and plotting the sum of squared distances between data points and their respective cluster centers. The value of K was identified from the point on the graph where the sum of squared errors no longer showed significant reduction with increasing K (Fig. B1). For each dataset, the optimal K was found to be 4.
Figure B1
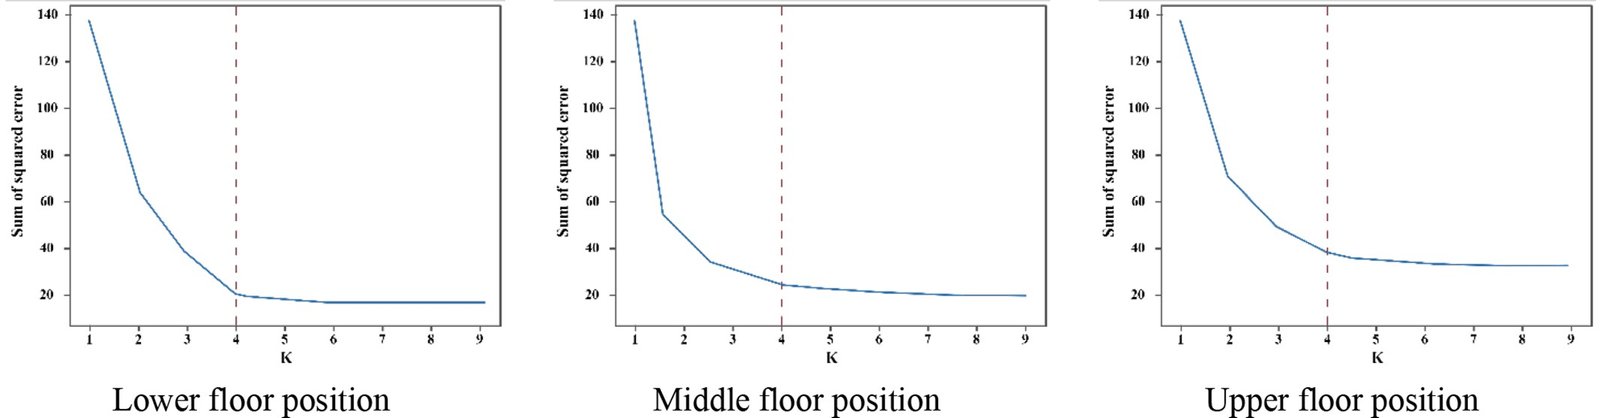
Fig. B1. Graph showing the elbow point for identifying the optimal number of clusters (K) for K- means clustering across three floor positions.
Funding
This work was funded by Dhaka University of Engineering & Technology, Gazipur (DUET) through the Vice Chancellor's Research Fund (2022-2024), which enabled the author to conduct field investigations, collect data, and acquire instruments and software.
Data availability statement
The data supporting the findings of this study are openly available in Figshare at https://doi.org/10.6084/m9.figshare.28375409, reference number 28375409.
Declaration of competing interest
The authors declare no conflict of interest.
References
- Y. Sun, R. Wilson, Y. Wu, A Review of Transparent Insulation Material (TIM) for building energy saving and daylight comfort, Applied Energy, 226:9 (2018) 713-729. https://doi.org/10.1016/j.apenergy.2018.05.094
- IEA, Energy efficiency statistics: Energy efficiency indicators highlights, International energy Agency, 2021, https://www.iea.org/data-and-statistics/data-product/energy-efficiency-indicators-highlights.
- DESCO, Annual Report of Dhaka Electric Supply Company Limited, Dhaka Electric Supply Company Limited, Bangladesh, 2021. https://www.desco.org.bd/uploads/attachments/annual_report_2021.pdf.
- M. Mourshed, The impact of the projected changes in temperature on heating and cooling requirements in buildings in Dhaka, Bangladesh, Applied Energy, 88:11 (2011) 3737-3746. https://doi.org/10.1016/j.apenergy.2011.05.024
- C. Ribeiro, N.M.M. Ramos, I. Flores-Colen, A review of balcony impacts on the indoor environmental quality of dwellings, Sustainability, 12:16 (2020) 1-19. https://doi.org/10.3390/su12166453
- K. Hilliaho, V. Kovalainen, S. Huuhka, J. Lahdensivu, Glazed spaces: A simplified calculation method for the evaluation of energy savings and interior temperatures, Energy and Buildings, 125:8 (2016) 27-44. https://doi.org/10.1016/j.enbuild.2016.04.063
- A.L.S. Chan, T.T. Chow, Investigation on energy performance and energy payback period of application of balcony for residential apartment in Hong Kong, Energy and Buildings, 42:12 (2010) 2400-2405. https://doi.org/10.1016/j.enbuild.2010.08.009
- K.S. Liu, C.C. Chen, The effects of deep balcony of different building heights on indoor lighting and thermo-environment, Applied Ecology and Environmental Research, 15:2 (2017) 103-109. https://doi.org/10.15666/aeer/1502_103109
- I. Loche, C. Bleil de Souza, A.B. Spaeth, L.O. Neves, Decision-making pathways to daylight efficiency for office buildings with balconies in the tropics, Journal of Building Engineering, 43:11 (2021) 1-24. https://doi.org/10.1016/j.jobe.2021.102596
- Q. Li, J. Haberl, Prediction of Annual Daylighting Performance Using Inverse Models, Sustainability, 15:15 (2023) 1-25. https://doi.org/10.3390/su151511938
- MHPW, Dhaka Metropolitan Building Construction Act, Government of the People's Republic of Bangladesh, Ministry of Housing and Public Works, 2008.
- MHPW, Bangladesh National Building Code (BNBC) 2020, Government of the People's Republic of Bangladesh, Ministry of Housing and Public works, 2020.
- Q. Yang, N. Li, Optimal design of residential balcony based on environmental benefit: A case study in hot summer and cold winter area of China, Indoor and Built Environment, 32:4 (2023) 750-762. https://doi.org/10.1177/1420326X221136212
- C. Ribeiro, P.F. Pereira, N.M.M. Ramos, I. Flores-Colen, N. Valentim, Assessment of the impacts of balconies on indoor environmental quality in mild climate conditions, Portugal, Building Research & Information, 52: 3 (2024) 292-310. https://doi.org/10.1080/09613218.2023.2229451
- N. Li, X. Miao, W. Geng, Z. Li, L. Li, Comprehensive renovation and optimization design of balconies in old residential buildings in Beijing: A study, Energy and Buildings, 295: 9 (2023) 1-17. https://doi.org/10.1016/j.enbuild.2023.113296
- N. Izadyar, W. Miller, B. Rismanchi, V. Garcia-Hansen, A numerical investigation of balcony geometry impact on single-sided natural ventilation and thermal comfort, Building and Environment, 177: 6 (2020) 1-18. https://doi.org/10.1016/j.buildenv.2020.106847https:/doi.org/10.1016/j.buildenv.2020.106847
- I. Loche, R. Loonen, L. Oliveira Neves, Balcony design recommendations to enhance daylight, thermal and energy performance of mixed-mode office buildings, Energy and Buildings, 321: 10 (2024) 1-16. https://doi.org/10.1016/j.enbuild.2024.114702
- F. Chi, Y. Xu, Building performance optimization for university dormitory through integration of digital gene map into multi-objective genetic algorithm, Applied Energy, 307: 2 (2022) 1-14. https://doi.org/10.1016/j.apenergy.2021.118211
- W. Ji, J. Sun, H. Wang, Q. Yu, C. Liu, Research on the Design of Recessed Balconies in University Dormitories in Cold Regions Based on Multi-Objective Optimization, Buildings, 14: 5 (2024) 1-14. https://doi.org/10.3390/buildings14051446
- A. Momenaei, A. Ardekani, S. Khaghani, Enhancing Energy Efficiency of High-Rise Buildings through Generative Design of Balcony Configurations, Journal of Architectural Engineering, 31:1 (2024) 1-24. https://doi.org/10.1061/JAEIED.AEENG-1871
- D. Tuhus-Dubrow, M. Krarti, Genetic-algorithm based approach to optimize building envelope design for residential buildings, Building and Environment, 45:7 (2010) 1574-1581. https://doi.org/10.1016/j.buildenv.2010.01.005
- Ladybug Tools, EPW Map, (2024). https://www.ladybug.tools/epwmap/ (accessed April 12, 2025).
- R. McNeel, Rhinoceros 3D, (2023). https://www.rhino3d.com/ (accessed April 21, 2025).
- D. Rutten, Grasshopper Algorithmic Modeling for Rhino, Add-Ons Grasshopper. (2015). https://www.grasshopper3d.com/ (accessed April 21, 2025).
- K. Lakhdari, L. Sriti, B. Painter, Parametric optimization of daylight, thermal and energy performance of middle school classrooms, case of hot and dry regions, Building and Environment, 204:7 (2021) 1574- 1581. https://doi.org/10.1016/j.buildenv.2021.108173
- N. Jannat, A. Hussien, B. Abdullah, A. Cotgrave, A comparative simulation study of the thermal performances of the building envelope wall materials in the tropics, Sustainability, 12:12 (2020) 1- 26. https://doi.org/10.3390/su12124892
- S. Chowdhury, K.S. Ahmed, Y. Hamada, Thermal performance of building envelope of ready-made garments (RMG) factories in Dhaka, Bangladesh, Energy and Buildings, 107:11 (2015) 144-154. https://doi.org/10.1016/j.enbuild.2015.08.014
- S. Chowdhury, Study of thermal performance of building envelope of ready-made garment factories in Dhaka, M. Arch Thesis, Department of Architecture, Bangladesh University of Engineering and Technology (BUET), (2014). http://lib.buet.ac.bd:8080/xmlui/handle/123456789/693 (accessed April 20, 2025).
- IESNA, Approved Method: IES Spatial Daylight Autonomy (sDA) and Annual Sunlight Exposure (ASE), New York, (2012).
- N.L. Jones, Fast climate-based glare analysis and spatial mapping, in: Proceedings of Building Simulation 2019: 16th Conference of IBPSA, Rome, Italy, 2-4 September 2019, pp. 982-989. https://doi.org/10.26868/25222708.2019.210267
- J. Wienold, J. Christoffersen, Evaluation methods and development of a new glare prediction model for daylight environments with the use of CCD cameras, Energy and Buildings, 38:7 (2006) 743-757. https://doi.org/10.1016/j.enbuild.2006.03.017
- M. Wang, X. Peng, Y. Cai, A multi-metric evaluation of classroom daylighting: Integrating myopia prevention and visual comfort, Journal of Building Engineering, 99:4 (2025) 1- 17. https://doi.org/10.1016/j.jobe.2024.111616
- ASHRAE, ANSI/ASHRAE Standard 55-2013: Thermal environmental conditions for human occupancy, (2013).
- X. Jia, B. Cao, Y. Zhu, B. Liu, Thermal comfort in mixed-mode buildings: A field study in Tianjin, China, Building and Environment, 185: 11 (2020) 1- 13. https://doi.org/10.1016/j.buildenv.2020.107244
- Ladybug Tools, Ladybug Tools | Home Page, (2017). https://www.ladybug.tools/ (accessed April 21, 2025).
- Z.N. Ahmed, A.T. Howarth, J.M. Zunde, Thermal comfort studies and applications for Dhaka, Building Services Engineering Research & Technology, 11:3 (1990) 105-108. https://doi.org/10.1177/014362449001100304
- EnergyPlus, EnergyPlusTM Version 9.6.0 Documentation: Input Output Reference, (2021) 655-662. https://energyplus.net/assets/nrel_custom/pdfs/pdfs_v9.6.0/InputOutputReference.pdf.
- M. Maki, M. Showkatbakhsh, Y. Song, Wallacei, (2022). https://www.wallacei.com/about (accessed April 22, 2025).
- S.S. Wang, Y.K. Yi, N.X. Liu, Multi-objective optimization (MOO) for high-rise residential buildings' layout centered on daylight, visual, and outdoor thermal metrics in China, Building and Environment, 205:11 (2021) 1- 19. https://doi.org/10.1016/j.buildenv.2021.108263
- S. Verma, M. Pant, V. Snasel, A Comprehensive Review on NSGA-II for Multi-Objective Combinatorial Optimization Problems, IEEE Access, 9 (2021) 57757-57791. https://doi.org/10.1109/ACCESS.2021.3070634
- K. Deb, A. Pratap, S. Agarwal, T. Meyarivan, A fast and elitist multi-objective genetic algorithm: NSGA-II, IEEE Transactions on Evolutionary Computation, 6 (2002) 182-197. https://doi.org/10.1109/4235.996017
- I.M. Sobol, Global sensitivity indices for nonlinear mathematical models and their Monte Carlo estimates, Mathematics and Computers in Simulation, 55 (2001) 271-280. https://doi.org/10.1016/S0378-4754(00)00270-6
- J. Herman, W. Usher, SALib: An open-source Python library for Sensitivity Analysis, Journal of Open Source Software, 2:9 (2017) 1-2. https://doi.org/10.21105/joss.00097
- C.F. Reinhart, M. Andersen, Development and validation of a Radiance model for a translucent panel, Energy and Buildings, 38: 7 (2006) 890-904. https://doi.org/10.1016/j.enbuild.2006.03.006
- A. McNeil, E.S. Lee, A validation of the Radiance three-phase simulation method for modelling annual daylight performance of optically complex fenestration systems, Journal of Building Performance Simulation, 6: 1 (2013) 24-37. https://doi.org/10.1080/19401493.2012.671852
- H. Wu, T. Zhang, Multi-objective optimization of energy, visual, and thermal performance for building envelopes in China's hot summer and cold winter climate zone, Journal of Building Engineering, 59: 11 (2022) 1- 18. https://doi.org/10.1016/j.jobe.2022.105034
- L. Wang, A.H.C. Ng, K. Deb, Multi-objective Evolutionary Optimisation for Product Design and Manufacturing, Illustrated ed., Springer Science & Business Media: Germany, 2011, pp. 3-34. https://doi.org/10.1007/978-0-85729-652-8_1
- L. Rachmawati, D. Srinivasan, Multiobjective evolutionary algorithm with controllable focus on the knees of the pareto front, IEEE Transactions on Evolutionary Computation, 13: 4 (2009) 810-824. https://doi.org/10.1109/TEVC.2009.2017515
- T. Thornton, Design Explorer 2, Github. (2017). https://tt-acm.github.io/DesignExplorer/ (accessed May 24, 2025).
- P. Xue, C.M. Mak, H.D. Cheung, J. Chao, Post-occupancy evaluation of sunshades and balconies' effects on luminous comfort through a questionnaire survey, Building Services Engineering Research & Technology, 37: 1 (2016) 51-65. https://doi.org/10.1177/0143624415596472
- L. Gábrová, Design of Balcony from the Point of View of Daylighting, Advanced Materials Research, 899 (2014) 298-301. https://doi.org/10.4028/WWW.SCIENTIFIC.NET/AMR.899.298.
- N.D. Dahlan, P.J. Jones, D.K. Alexander, E. Salleh, J. Alias, Daylight ratio, luminance, and visual comfort assessments in typical malaysian hostels, Indoor and Built Environment, 18: 4 (2009) 319-335. https://doi.org/10.1177/1420326X09337041
2383-8701/© 2025 The Author(s). Published by solarlits.com. This is an open access article distributed under the terms and conditions of the Creative Commons Attribution 4.0 License.

4963
Total views
Citations
SHARE ON


