Article | 16 November 2025
Volume 12 Issue 2 pp. 491-505 • doi: 10.15627/jd.2025.29
Multi-Criteria Optimization of Tubular Daylighting Devices for Classrooms in High-Solar Climates through Parametric Simulation
Fatima Zohra Ferahta,1,* Mourad Dahmani2
Author affiliations
1 University of Batna1, Faculty of Sciences, LPEA, 2005 Batna, Algeria
2 University of Blida 1, institute of aeronautics and space studies, Blida, Algeria
*Corresponding author.
fatimazohra.ferahta@gmail.com (F. Z. Ferahta)
dahmanimor70@gmail.com (M. Dahmani)
History: Received 22 July 2025 | Revised 26 September 2025 | Accepted 7 October 2025 | Published online 16 November 2025
2383-8701/© 2025 The Author(s). Published by solarlits.com. This is an open access article distributed under the terms and conditions of the Creative Commons Attribution 4.0 License.
Citation: Fatima Zohra Ferahta, Mourad Dahmani, Multi-Criteria Optimization of Tubular Daylighting Devices for Classrooms in High-Solar Climates through Parametric Simulation, Journal of Daylighting, 12:2 (2025) 491-505. doi: 10.15627/jd.2025.29
Figures and tables
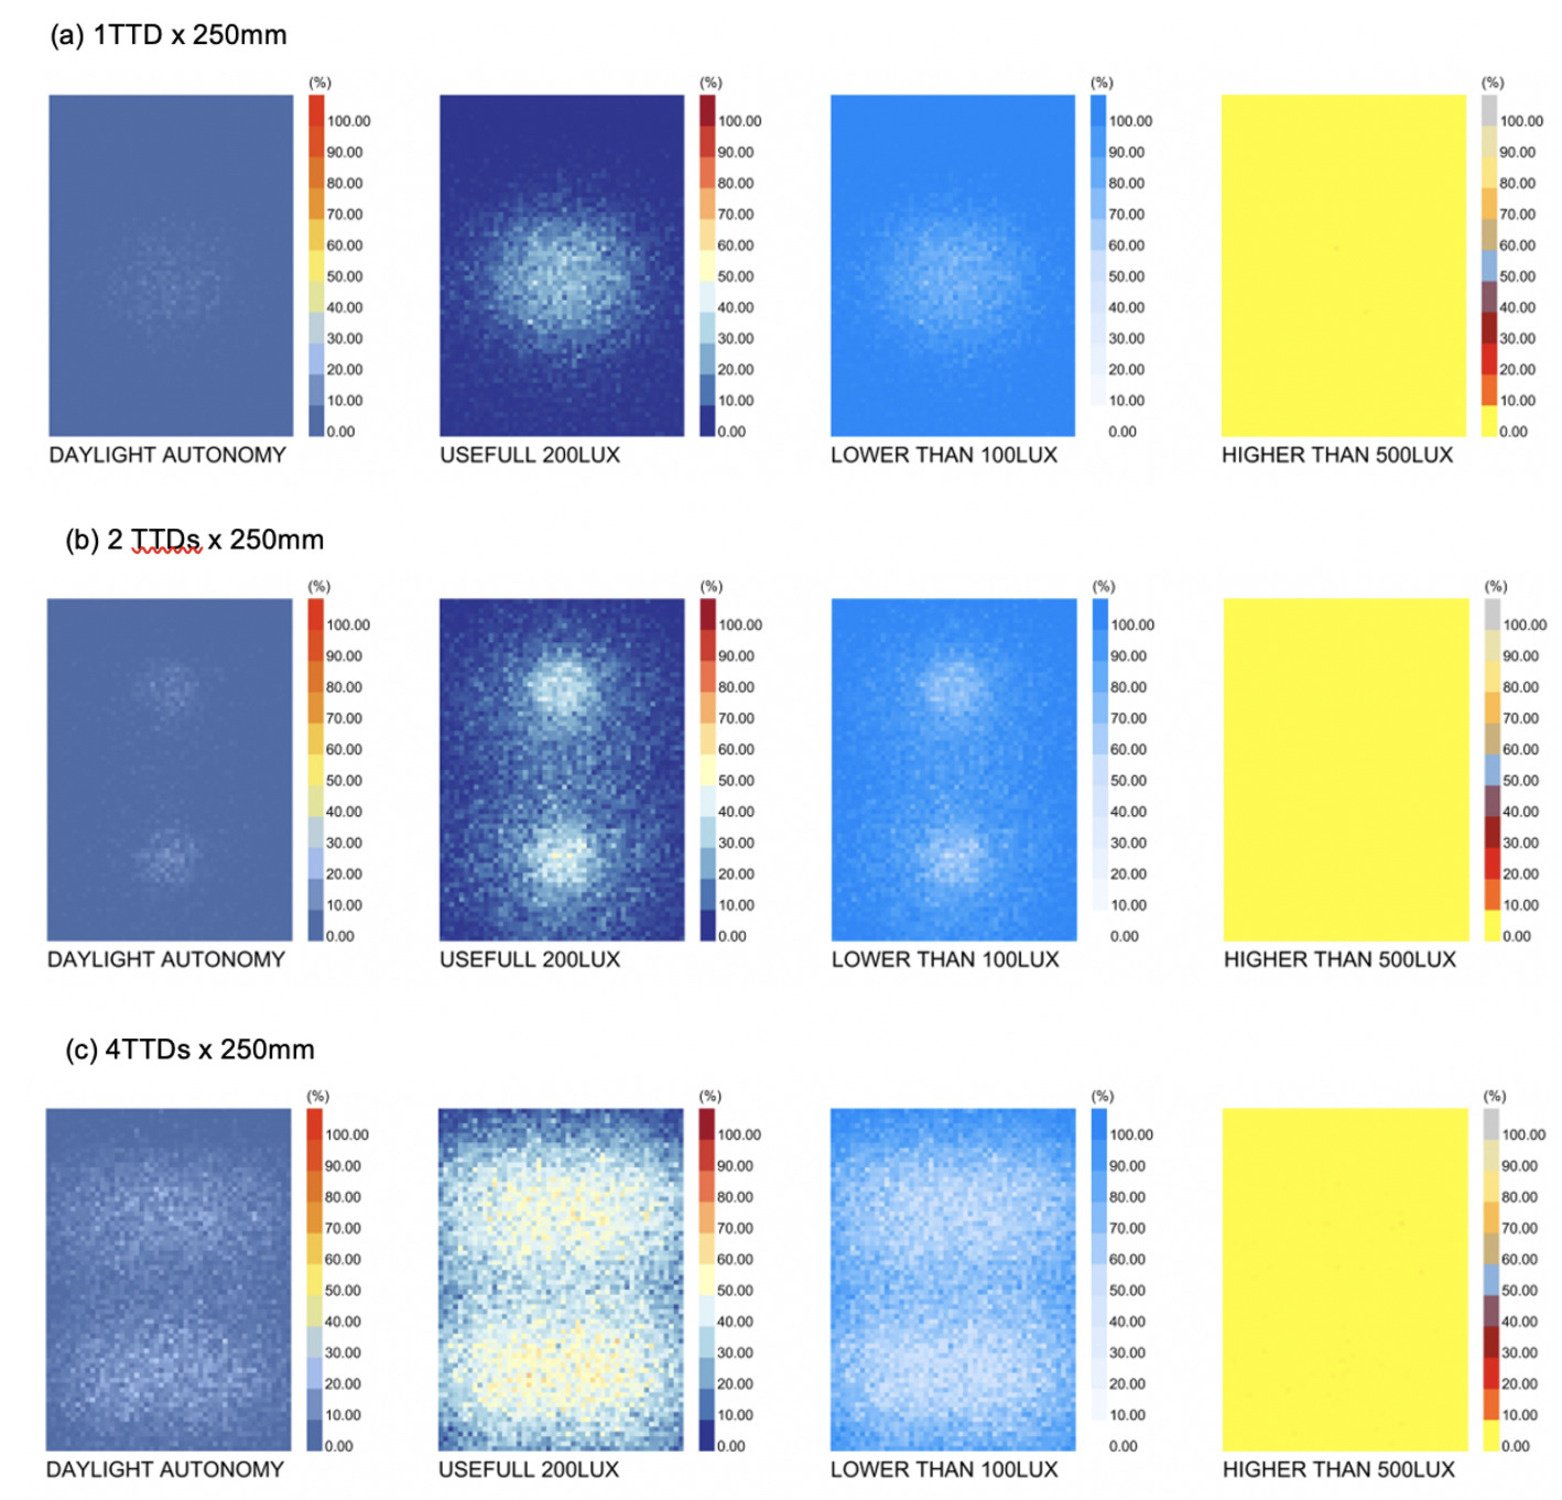 Figure 3
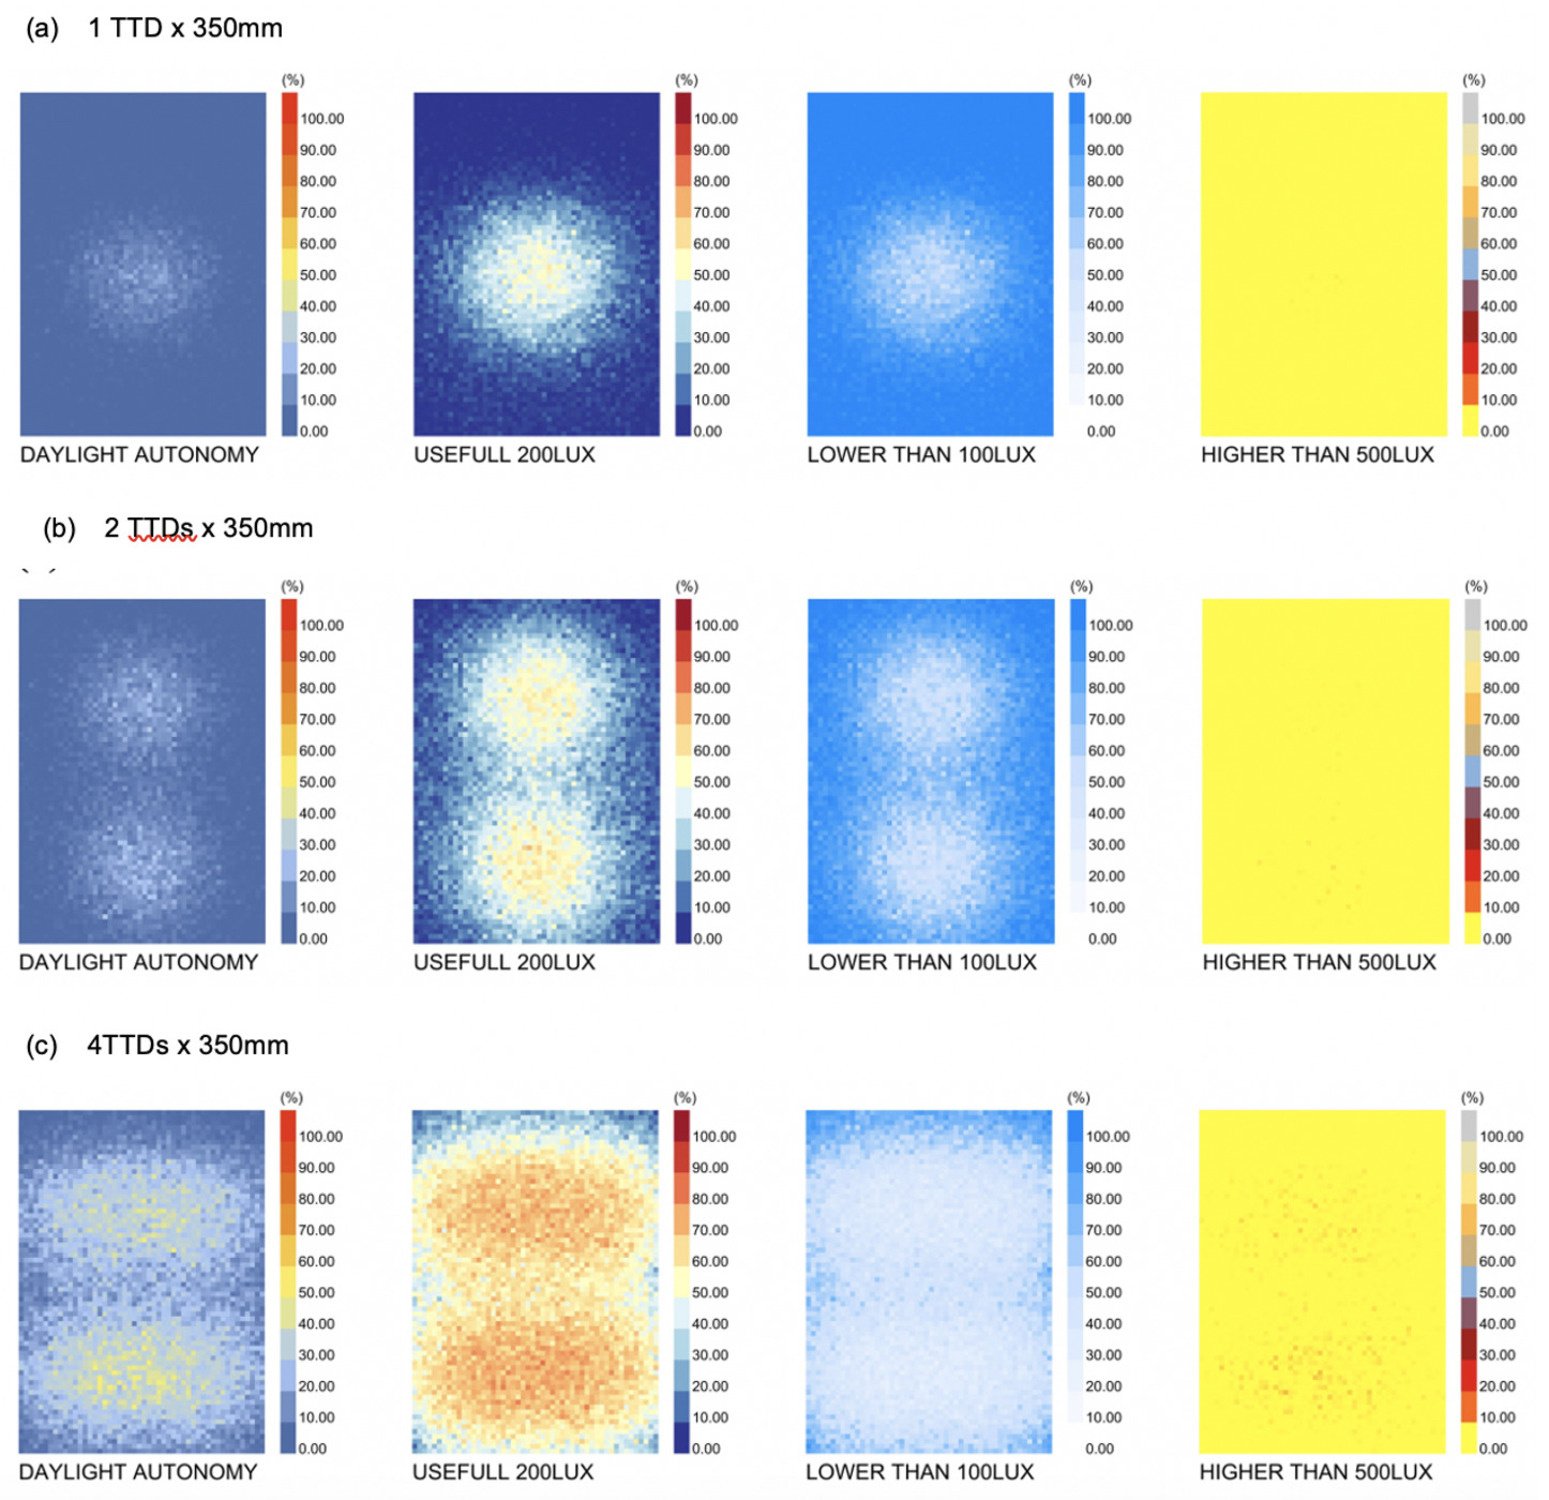 Figure 4
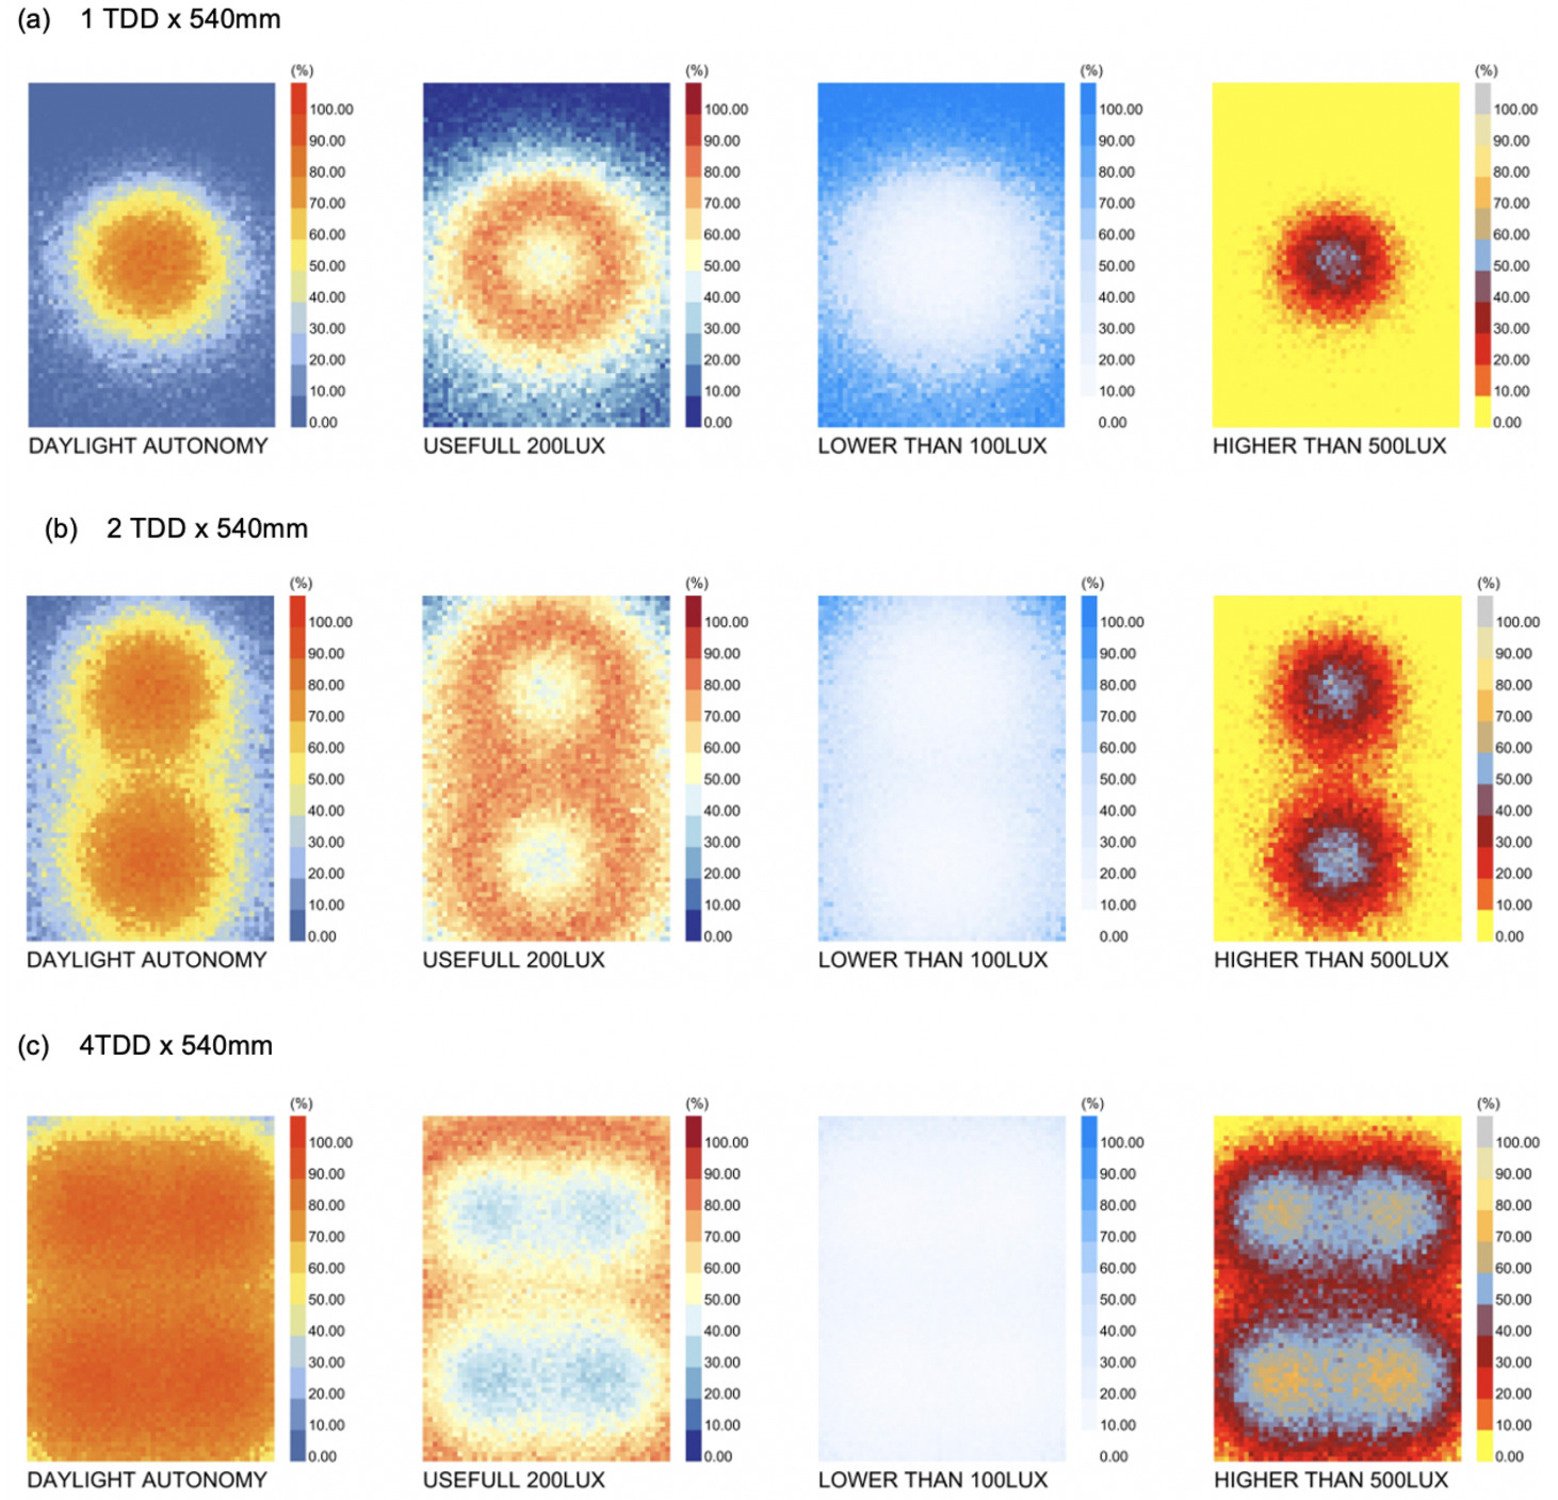 Figure 5
Abstract
In educational architecture, particularly in high-solar climates, achieving a balance between ample daylight and visual comfort is a significant challenge. This numerical study evaluates the daylighting performance of nine tubular daylight device (TDD) configurations, with diameters of 250 mm, 350 mm, and 540 mm, using one, two, or four units, in a 35 m² classroom located in Batna’s high-sun climate. By combining glare hotspot distribution with a weighted multi-criteria assessment (Daylight Autonomy, Useful Daylight Illuminance, Annual Sunlight Exposure, and uniformity), the research identifies optimal solutions that balance daylight provision and visual comfort. Among them, the 4×350 mm configuration performs best, limiting overlit areas to 20.7% (vs. 37.1% for 4×540 mm) and significantly reducing glare hotspots, while the 2×540 mm and 4×540 mm setups lead to 1.6-fold and 3.6-fold increases in glare zones, respectively, compared to 4×350 mm. This configuration also achieves the highest global score (66.5%) thanks to its low ASE (10%) and high UDI-a (74%). In contrast, the 4×540 mm setup, despite its superior DA (81%), presents unacceptable glare risks (65% ASE) and poor lighting uniformity. The study underscores the importance of prioritizing daylight quality metrics (UDI-a, ASE, glare control) over simply maximizing illuminance in sunny climates. These findings align with EN 17037 and LEED v4 guidelines and offer actionable insights for improving visual comfort in educational spaces.
Keywords
tubular daylight devices, daylight autonomy, visual comfort, multi-criteria optimization, arid climates, radiance
1. Introduction
In educational environments, the quality of daylight is paramount. International standards such as EN 17037 [1] and certification systems like LEED v4.1[2] emphasize that sufficient daylight is critical for students' visual comfort, concentration, and cognitive performance, directly impacting learning outcomes. Ensuring adequate daylight availability is therefore not merely a design preference but a requirement, especially in classrooms where prolonged visual tasks demand high-quality lighting conditions (Heschong, 2003) [3]. This is particularly relevant in hot and semi-arid regions such as the city of Batna (Algeria), where high solar availability offers a significant opportunity for daylight harvesting. Such strategies are recognized as key for reducing energy consumption from artificial lighting in frameworks like LEED v4.1 [2]. However, architectural constraints such as deep floor plans or limited glazing can hinder compliance with daylight penetration depth criteria defined in EN 17037 [1], leading to zones of visual discomfort.
To overcome these limitations and achieve the objectives set by modern daylighting standards, Tubular Daylighting Devices (TDDs) provide a promising passive solution. By capturing and channeling light deep into interior spaces while minimizing thermal gains, they offer a practical means of reconciling visual comfort with energy efficiency in demanding climates.
Over the past decade, numerous studies have sought to model, simulate, and evaluate the performance of Tubular Daylighting Devices (TDDs) in response to various climatic constraints and architectural configurations.
One of the pioneering analytical studies was conducted by Swift and Smith [4], who developed mathematical models to predict luminous flux transmission in tubular daylight devices. They demonstrated that increasing the tube diameter enhances transmitted flux, while transmission decreases exponentially with tube length due to multiple internal reflections on the reflective liner. Their study also highlighted the role of dome geometry in capturing diffuse skylight and the effect of orientation on the angular distribution of transmitted light. Building on this theoretical foundation, Samuhatananon et al. [5], carried out complementary experimental investigations, validating these predictions through controlled laboratory tests and in-situ measurements. Carter et al. [6] further assessed the performance of passive light pipe systems using combined experimental data and predictive models, reporting good agreement between measured and simulated luminous flux, and thereby confirming the reliability of analytical approaches in practical daylighting design. Zhang et al. [7,8] developed further analytical models aimed at predicting the optical performance of light pipes. Jenkins et al. [9] proposed a semi-empirical model that combined theoretical assumptions with experimental validation, allowing for more accurate predictions under various sky conditions and contributing to the refinement of daylighting design tools. These findings were further consolidated by Malet-Damour et al. [10,11], who validated simulation results by comparing them with experimental measurements conducted in real-world environments, thereby reinforcing the reliability of numerical daylight modeling. Azad et al. [12] examined optimized tubular daylight-pipe configurations in tropical Indian climates, comparing single- and dual-reflector designs. Their controlled experiments and simulations demonstrated up to 23% savings in lighting energy consumption during peak summer months in both temperate (Pune) and hot-dry (Jodhpur) zones. Fernandes and Regnier [13] conducted a comprehensive experimental evaluation of commercially available TDDs, examining dome and diffuser types (clear, prismatic, Fresnel) and diameters (53 vs 35 cm). Their findings indicate energy savings between 16-34 Wh/m²/day depending on solar altitude, with no reported glare issues.
Later, numerous studies evaluated TDD performance under different climatic conditions. An experimental study by Thakkar [14] in the warm-humid subtropical climate of India found that some TDDs can match artificial lighting levels during daytime. Meanwhile, in the cold continental climate of northern China, Wu and Li [15,16] highlighted the energy-saving potential of TDDs during winter. Research in hot-arid regions by Mayhoub et al. [17] observed that acrylic domes lose up to 30% of light, compared to 13% for glass, with performance strongly influenced by solar angles and dust accumulation. Finally, a study from South Korea's temperate monsoon climate by Ji et al. [18] developed a TDD-LED hybrid system for underground parking, which achieved target illuminance (~ 45 lux in driveways) and notable energy savings through DIAlux-based control strategies.
The geometry of domes and diffusers has also been widely investigated. Kavuthimadathil and Ramamurthy [19] showed that hemispherical domes with flat diffusers offer the best uniform illuminance, and that increasing tube diameter or branching improves light coverage by 10-25%, even at distances >1.5 m from the center. Bisht et al. [20] analyzed the impact of tube diameter, length, dome shape, and orientation on TDD performance under different sky conditions. They showed that larger tube diameters increase luminous flux but risk localized glare beneath the diffuser, while longer tubes reduce transmission efficiency due to higher reflection losses. Hemispherical domes were found to capture more diffuse light compared to flat domes, and optimal orientation (south-facing in their study) significantly improved daylight penetration and spatial uniformity. Based on these results, the authors proposed design guidelines for selecting TDD dimensions and orientations according to climatic conditions. Alongside experimental approaches, the development of numerical simulation has enabled more in-depth analysis of TDDs in complex configurations. Jakubiec and Reinhart [21] integrated DAYSIM, Radiance, and EnergyPlus into the DIVA 2.0 plugin for Rhino, enabling cross-evaluation of daylighting, visual comfort, and thermal loads. Other studies, such as Ellis et al. [22], incorporated TDDs into EnergyPlus to analyze their combined effect with light shelves.
The optical modeling of complex TDD geometries has also progressed. The ray-tracing model developed by Laouadi et al. [23] for complex dome geometries was experimentally validated in a companion study, demonstrating consistent agreement for luminous flux transmission and angular light distribution. Similarly, Chen et al. [24] developed a numerical model based on luminous flux and angular distribution, confirming its predictive accuracy across various configurations.
From an optimization perspective, Fang and Cho [25] used genetic algorithms to simultaneously enhance daylighting and energy performance, achieving up to 39% UDI and 20% EUI improvements across three U.S. climates. In colder regions, Zhou and Li [26] and demonstrated that integrating nanofluids into TDDs as solar filters can reduce energy demand by up to 43.6%, while enhancing light distribution and glare reduction.
Architectural integration of TDDs has also evolved. Cılasun Kunduracı and Kızılörenli [27] showed that combining TDDs with movable shading in deep classrooms improves sDA at the back and reduces ASE near windows, as confirmed by field-validated simulations. Li et al. [28] confirmed the benefits of tubular daylighting devices (TDDs) in architectural environments, particularly in educational settings. They demonstrated improved corridor lighting conditions using a light-pipe system in a Hong Kong school. Mesloub et al. [29] found that in arid climates, acrylic domes lose up to 30% of light, versus 13% for glass, with performance influenced by solar angles and dust. Some studies also explored LED–TDD hybrids as complementary solutions. Goharian and Mahdavinejad [30] proposed a multi-opening vertical pipe system to improve light distribution in complex layouts. Furthermore, the assessment of visual comfort and luminous performance in spaces equipped with daylighting systems TDDs or conventional remains a key challenge. Mardaljevic et al. [31] introduced the DA, UDI, and sDA indicators to better reflect visual comfort and energy savings, illustrated through real case studies. Using Radiance, Dubois [32] showed that while fixed external shading systems, such as horizontal louvers and light shelves, improved light uniformity, they did not always eliminate glare near windows. More recently, Li et al. [33] provided a comprehensive review of evaluation methods for tubular daylight guidance systems, covering experimental measurements, analytical models, and simulation-based approaches. They emphasized that while early analytical studies (e.g., Swift and Smith, 1995) laid the theoretical foundation, current research increasingly relies on advanced Climate-Based Daylight Modelling (CBDM) to assess performance indicators such as DA, UDI, ASE, and glare probability. Their review also highlighted the importance of contextual applications (e.g., classrooms and offices) for linking luminous performance to energy savings and visual comfort. Our work follows this perspective by applying a multi-criteria evaluation to TDDs in deep classrooms under hot-arid climatic conditions.
Other studies emphasized the critical importance of selecting appropriate optical properties for interior surfaces and shading systems, as these parameters strongly influence the reliability of daylighting simulations (e.g., Brembilla et al., [34]; Chan and Tzempelikos, [35]) showed that incorrect assumptions on reflectance or transmittance could lead to 30–40% error in daylight predictions, underscoring the need for accurate material data.
Finally, the performance evaluation of daylighting systems, particularly TDDs, is increasingly guided by international reference standards such as IES LM-83-12[36], LEED v4 [2], and EN 17037 [1], which establish criteria for daylight availability, glare protection, and visual comfort within the framework of Climate-Based Daylight Modelling (CBDM).
However, despite the proven potential of TDDs and the abundance of solar resources in regions like North Africa, comprehensive, multi-criteria design guidance tailored to the specific challenges of deep classrooms in high-solar climates remains scarce. Most existing studies focus on energy savings or on single performance metrics, often overlooking the critical trade-off between sufficient daylight provision and glare control. Moreover, the impact of combining multiple TDDs of varying diameters on overall visual comfort has received little attention. To address this gap, this study presents the first systematic, climate-based daylight modelling of multiple TDD configurations (diameter × number) in a real high-solar context. By combining glare-hotspot mapping with key daylight metrics (DA, UDI, ASE and uniformity), it provides practical, multi-criteria guidance for designers seeking to optimise daylight quantity and quality in deep classrooms.
2. Methodology
2.1. Geometry and room configuration
This study focuses on a typical classroom with a floor area of 35 m² and a ceiling height of 3m, representative of educational facilities located in hot and arid climates, such as in Batna (Algeria). A deep classroom refers to a teaching space where the distance from the primary façade or daylight aperture to the back of the room exceeds twice the floor-to-ceiling height or approximately 6-7 m (EN 17037 [1], Heschong [3]), making it more dependent on daylight guidance systems such as TDDs to ensure adequate lighting at the rear zones. The workplane, corresponding to students’ desks, is positioned 0.8 m above the floor, in accordance with international standards for illuminance assessment in learning environments (EN 12464-1; IESNA). This reference height is also widely adopted in scientific literature (Reinhart et al., [37]). Visual comfort criteria were defined in line with major international standards. IES LM-83-12 specifies daylight metrics such as Spatial Daylight Autonomy (sDA) and Annual Sunlight Exposure (ASE), with a recommended threshold of ASE 10 % of the analysis area to limit glare. LEED v4 adopts these metrics, rewarding projects achieving sDA 55 % at 300 lux and ASE 10 %. Similarly, EN 17037 defines requirements for daylight provision, view out, and glare protection, emphasizing ASE thresholds and daylight uniformity to ensure visual comfort in occupied spaces.
The reflectance values of the interior surfaces were set at 80% for the ceiling, 50% for the walls, and 19% for the floor, following ASHRAE/IES guidelines for K-12 educational buildings and consistent with previous studies conducted on primary schools.
Several TDD configurations were simulated, combining three diameters : 250 mm, 350 mm, and 540 mm, and three layouts:1, 2, and 4 units placed in a 7 m × 5 m classroom. For consistency with manufacturers’ catalogues, duct lengths were fixed at 1.8 m for the 250 mm and 350 mm models and at 3 m for the 540 mm model. These nine configurations enable a systematic assessment of how tube diameter and unit count influence daylight penetration and illuminance uniformity on the work plane.
Figure 1, summarizes the numerical model: (a) cross-sections of the three tube diameters; (b) 2-D floor plans showing the 1-, 2-, and 4-TDD layouts and (c) the corresponding 3-D Radiance geometry used for the simulations.
Figure 1
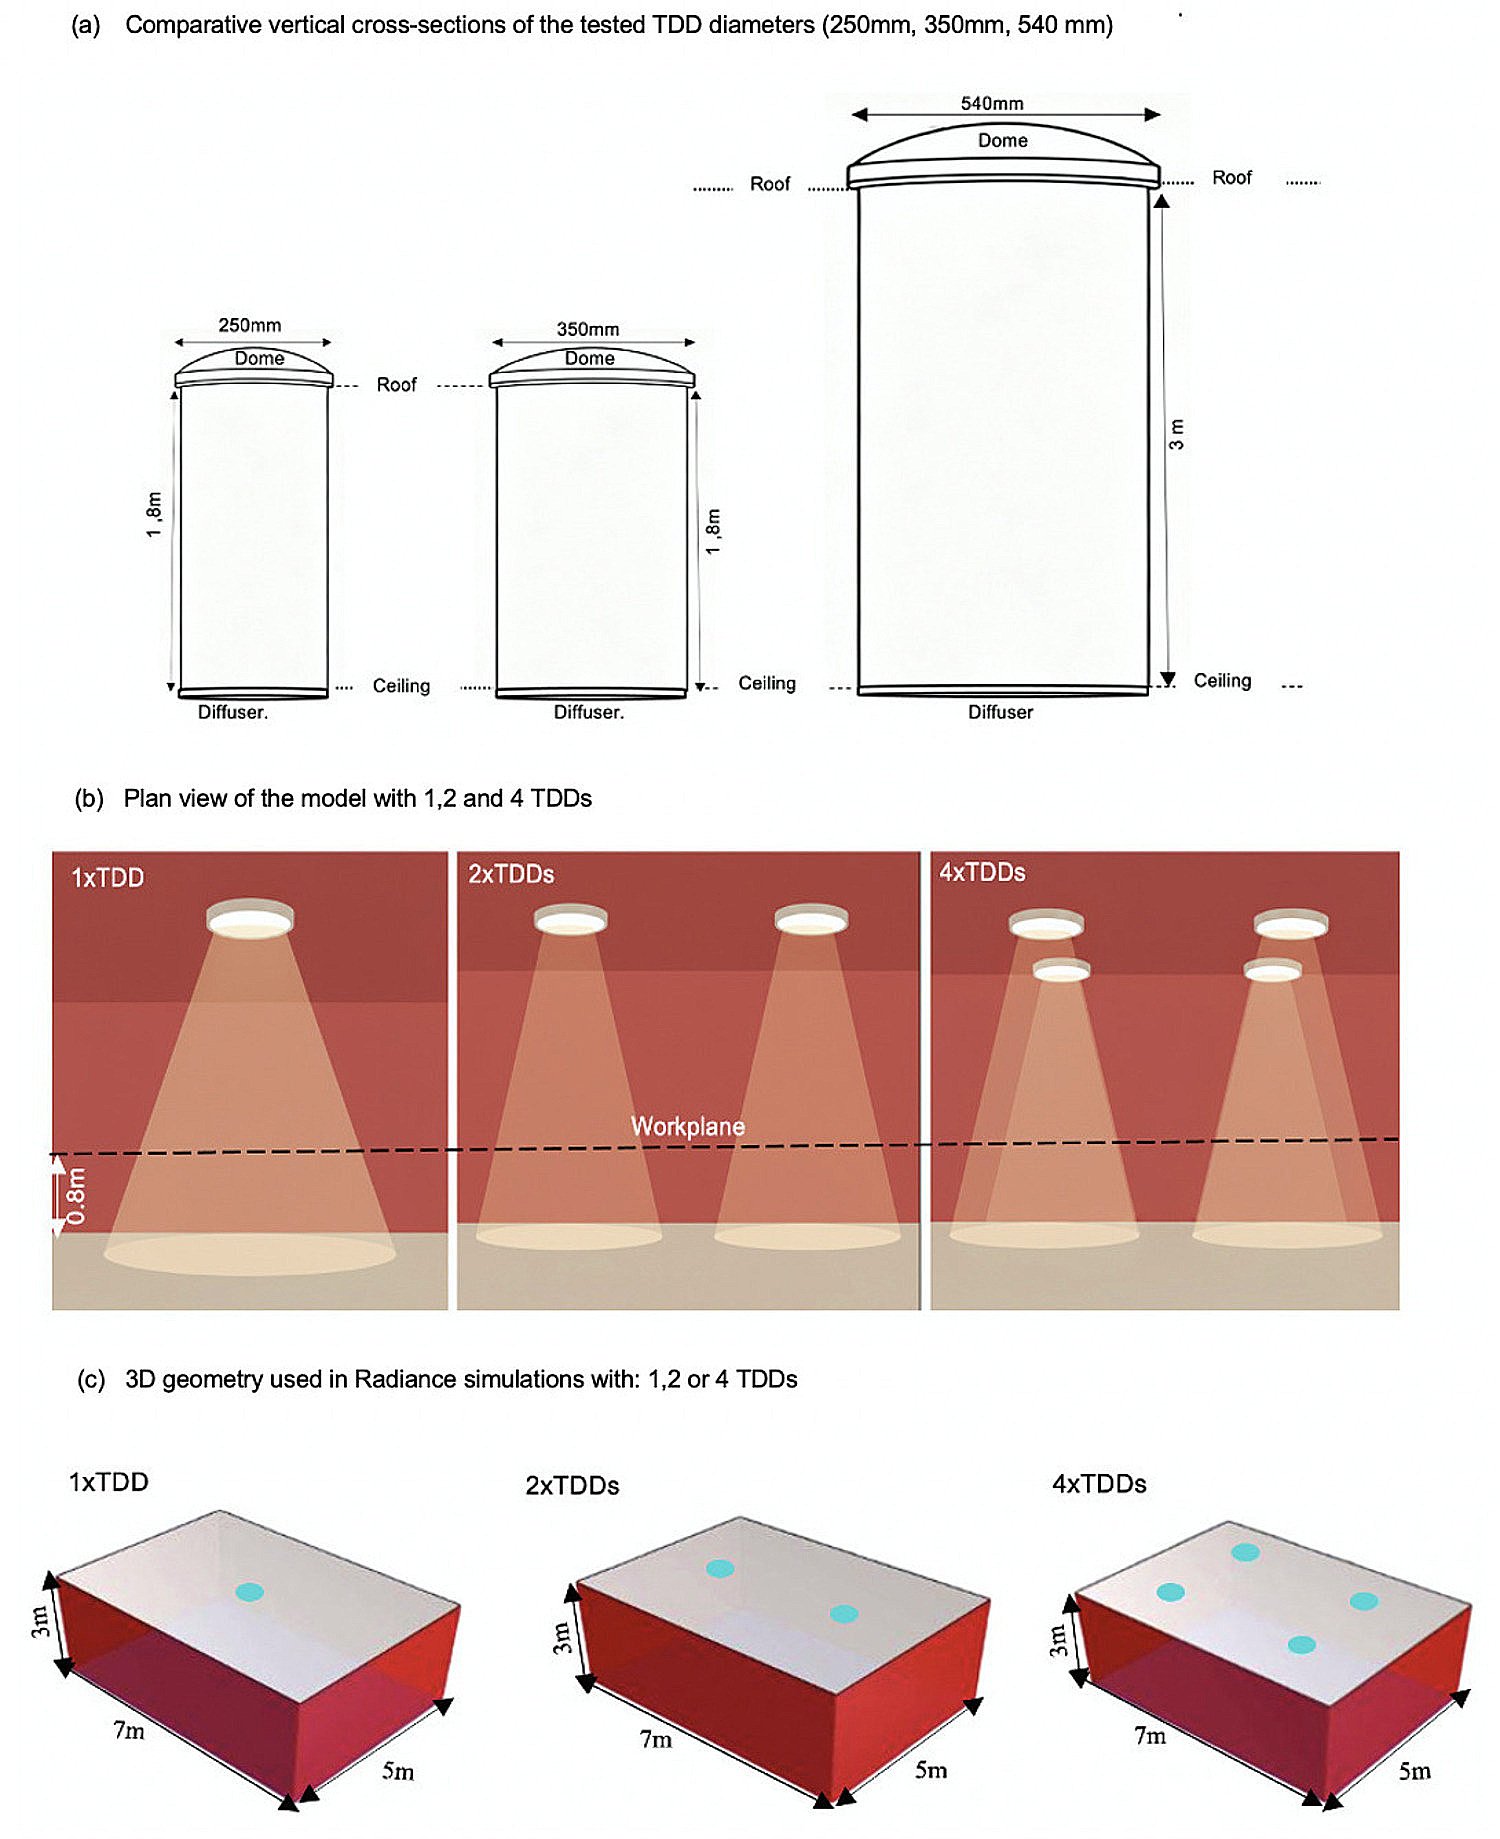
Fig. 1. Comparative section of three TDD diameters (250 mm, 350 mm, 550 mm). (b) Plan view of the model with 1, 2 and 4 TDDs. (c) 3D geometry used in Radiance simulations with: 1,2 or 4TDDs.
2.1. Tools and simulation setup
2.2.1. Modeling approach
The geometric modeling was carried out using Rhinoceros 3D, with the Grasshopper plugin enabling the parametric generation of various TDD configurations (number, diameter, and position). Ladybug and Honeybee were employed to integrate climatic data (EPW file for Batna) and to run daylight simulations using Radiance.
Ladybug was used to analyze solar conditions and direct/diffuse radiation, while fHoneybee was utilized to define the optical properties of materials, model internal reflections, and represent terminal diffusers using BSDF (Bidirectional Scattering Distribution Function) files, thereby ensuring a realistic representation of the optical behavior of the TDDs.
2.2.2. Light transport and BSDF modeling
The optical behavior of the TDDs was modeled using the Bidirectional Scattering Distribution Function (BSDF), which describes how light is either transmitted (BTDF) or reflected (BRDF). The model accounts for the spectral transmittance of the dome, multiple internal reflections within the highly reflective tube, and diffusion occurring at the terminal diffuser.
Mathematically, these functions are defined as follows (Swift & Smith [4] ; CIE 173:2006 [38]):
where, wi and wo are the incident and outgoing light directions, respectively, dLr(wo),dLt(wo),dLo(wo) are the Reflected, transmitted, and emitted luminances in direction wo, respectively, and dEi(wi)is the incident irradiance from direction wi. A simplified approach can also be used to estimate the average illuminance E at the TDD output (Littlefair [39]).
where E is the illuminance (in lux) on the workplane, \(\tau_{TDD}\) is the total transmittance of the TDD system, accounting for the dome transmission, internal reflections within the tube, and the diffuser transmission, and Iext is the exterior horizontal illuminance (lux) incident on the TDD dome.
The total transmittance τTDD can be expressed as (Swift & Smith [4]):
where \(\tau_{dome}\) is the transmittance of the TDDdome (function of material and incident angle), \(\rho_{tube}\) is the reflectivity of the tubular conduit, n is the number of internal reflections, typically estimated as n ≈ L/D (L: longueur du tube et D son diamètre), and \(\tau_{diffuser}\) is the transmittance coefficient of the diffuser
This simplified approach is widely used in the literature, as demonstrated by several studies and technical guides (Littlefair, [39]; Swift and Smith [4], 1995; CIE 173:2006 [38]; Solatube, [40]).
2.2.3. Light transport and BSDF modeling
The indoor light distribution in the room is simulated using the RADIANCE ray-tracing engine, originally developed by Gregory J. Ward (1994) [41]. This engine is based on Monte Carlo integration and is designed to solve the rendering equation, which governs the transport of light in a scene by accounting for emission and reflection phenomena. The rendering equation is expressed as:
where,
\(L(x,\omega)\) is the total radiance in direction ω at point x.
\(L_e(x,\omega)\) is the emitted radiance from point x in direction ω.
\(fr(x,\omega\prime,\omega)\) is the bidirectional reflectance distribution function (BSDF)
\(L(x\prime,\omega\prime\) is the incoming radiance at point x from direction ω
n is the surface normal at point x
\(\Omega\) is the hemisphere of incoming directions
The integral is approximated using the Monte Carlo method, expressed as (Ward [41]):
where,
N is the number of randomly sampled rays, xi are the sampled directions or points, drawn from a probability distribution, pxi is the probability density function associated with the sampling of xi, and f(x) is the integrand function.
This approach allows for a realistic simulation of multiple reflections on walls, floor, and ceiling surfaces, as well as the light diffusion through BSDF modeled diffusers.
2.3. Illuminance calculation method
For all simulations, horizontal illuminance was calculated on a regular analysis grid placed at 0.8 m above the floor level, corresponding to standard desk height. The grid resolution was set to 0.5 m × 0.5 m, yielding a total of 140 analysis points over the 35 m² room surface (i.e., one point per 0.25 m²). This spatial resolution complies with international recommendations such as EN 17037 and IESNA LM-83, ensuring that both localized illuminance variations and overall spatial uniformity are accurately captured. The computed illuminance values were then used to extract climate-based daylight performance metrics, including Daylight Autonomy (DA), Useful Daylight Illuminance (UDI), Annual Sunlight Exposure (ASE), and spacial uniformity. ASE was also used as an indirect indicator of potential glare risk, as higher ASE values correspond to increased direct sunlight exposure and greater likelihood of visual discomfort. Furthermore, a direct analysis of glare hotspots was conducted by quantifying the number of grid points exceeding the absolute illuminance threshold of 2000 lux, as recommended by EN 17037 for educational spaces. The spatial distribution and intensity of these points were categorized and mapped to identify zones of potential visual discomfort. Additionally, statistical averages were calculated, and illuminance distribution maps were generated to support comparative analysis.
3. Performance indicators of TDDS
The evaluation of the luminous performance of Tubular Daylighting Devices (TDDs) configurations relies on several photometric indicators. These indicators are calculated from Radiance simulations and compared to reference thresholds derived from standards (EN 17037, LEED v4, WELL v2) and the scientific literature, in order to highlight the effect of diameter on luminous quality.
3.1. Daylight autonomy (DA300)
Defined as the percentage of occupied hours during which at least 300 lux is achieved at each analysis point. A higher DA300 implies better daylight sufficiency.
3.2. Spatial uniformity (U)
Computed as the ratio of minimum to average illuminance across all points on the analysis grid at a representative hour. This metric assesses the visual homogeneity of lighting.
where Emin is a minimum illumination on the work surface and Emin is average spatial illumination.
3.3. Useful daylight illuminance (UDI)
The Useful Daylight Illuminance (UDI) metric quantifies the proportion of time during which illuminance levels remain within the useful range for occupants. It is divided into three categories: UDI-i (insufficient, <100 lux), UDI-a (adequate, 100–2,000 lux), and UDI-e (excessive, >2,000 lux).
3.4. Annual sunlight exposure (ASE)
ASE quantifies the percentage of the floor area that receives at least 1000 lux of direct sunlight for more than 250 hours per year. Excessive exposure to direct sunlight can lead to glare and thermal discomfort. A threshold of 10 is often cited as a maximum acceptable value to minimize the risk of visual discomfort, as recommended by LEED v4 and supported by research in the field (Lo Verso et al., 2014 [42]) . ASE is therefore a useful metric to assess the potential risk of visual or thermal discomfort in interior spaces.
3.5. Multi-criteria performance assessment
Following the individual analysis of the photometric indicators, a multi-criteria assessment framework was adopted to objectively compare and rank the overall performance of the different TDD configurations. This approach makes it possible to resolve potential conflicts between metrics (e.g., high DA but also high ASE) and to provide a holistic evaluation of daylighting quality.
A global performance score was developed for this purpose using a linear weighted sum method, a standard technique for constructing composite indicators (OECD, 2008[43]):
where, w1, w2, w3 and w4 are the weighting coefficients assigned to each criterion. The term (100 − ASE) is used simply to align ASE with the other reward-based indicators. These coefficients were established based on international daylighting standards and certification systems (IES LM-83, LEED v4.1, EN 17037) and were adapted to prioritize visual comfort and reduce glare risks in educational spaces exposed to high solar conditions. This multi-criteria approach aligns with established daylighting research methodologies (Reinhart & Wienold, 2011])and reflects best practices for constructing composite indicators [OECD, 2008].
4. Results and discussion
4.1. Illuminance availability in Batna
Figure 2, below illustrates the annual variation of global horizontal illuminance in Batna (Algeria), based on SRC-TMYx climate data. A clear seasonality can be observed: illuminance levels are lowest in winter, with daily averages ranging from 3,690 to 11,000 lux between December and February, while maximum values are reached in summer, frequently exceeding 30,000 lux from May to August. This dynamic reveals a particularly high solar potential, highly favorable for exploiting daylighting throughout the year.
Figure 2
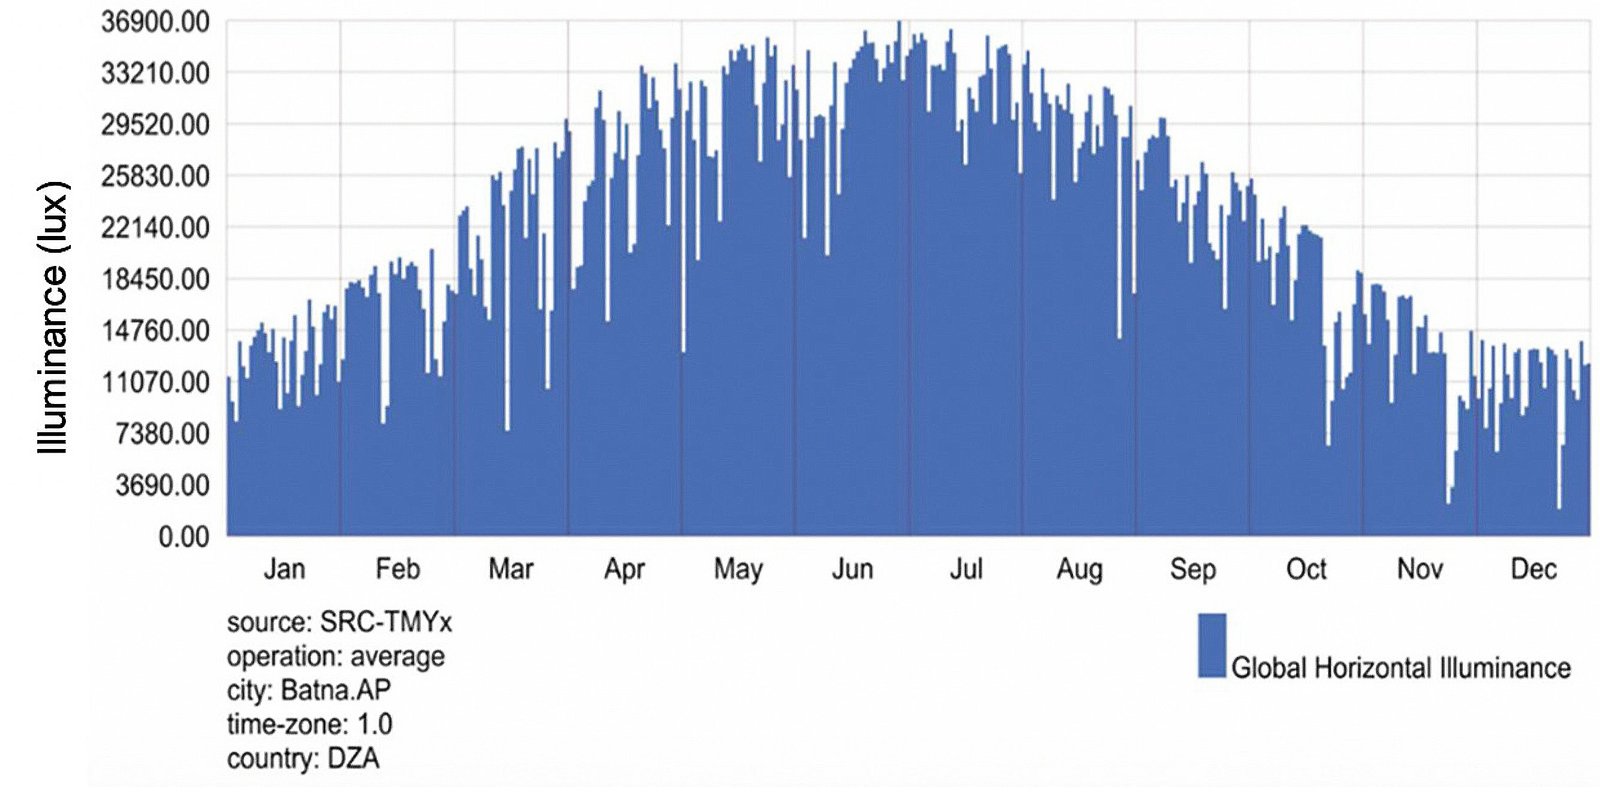
Fig. 2. Annual variation of global horizontal illuminance in Batna.
This climatic context provides a relevant basis for assessing the performance of different TDD configurations. The analysis relies on annual performance indicators (Daylight Autonomy (DA), Useful Daylight Illuminance (UDI), Annual Sunlight Exposure (ASE), and illuminance uniformity) thus integrating all seasonal and meteorological variations. This approach ensures a representative evaluation of daylight quality in the context of annual school use.
4.2. Qualitative analysis of illuminance distribution on the work plane
The illuminance maps (Figures 3, 4, and 5) illustrate the spatial distribution of daylight in the classroom for configurations with 1, 2, and 4 TDDs, using diameters of 250 mm, 350 mm, and 540 mm.
Figure 3
Fig. 2. Illuminance maps for TDDs with 250 mm diameter in configurations of 1, 2, and 4 units (a)1TDDs x 250mm, (b) 2TDDs x250mm, (c) 4TTDs x 250mm.
Figure 4
Fig. 2. Illuminance maps for TDDs with 350 mm diameter in configurations of 1, 2, and 4 units. (a)1TDDs x 350mm, (b) 2TDDs x350mm, (c) 4TTDs x350mm.
Figure 5
Fig. 2. Illuminance maps for TDDs with 540 mm diameter in configurations of 1, 2, and 4 units. (a)1TDDs x 540mm, (b) 2TDDs x540mm, (c) 4TTDs x 540mm.
Illuminance is calculated on a regular grid positioned 0.8 m above the floor, covering the entire floor area of the room. This grid enables the generation of a detailed map of dalight distribution.
These maps clearly highlight the influence of both the number and diameter of TDDs on the uniformity and intensity of indoor illuminance. Illuminance levels are classified as follows, in accordance with EN 12464-1 recommendations:
- Below 100 lux: Insufficient for most classroom activities.
- 100–300 lux: Acceptable for general educational tasks.
- 300–500 lux: Optimal range for visually demanding tasks.
- Above 500 lux: May support highly demanding visual work, but excessive values can lead to visual discomfort and glare.
4.2.1. TDDs with 250 mm Diameter (1.8 m Length)
The illuminance maps in Fig. 3, corresponding to the 250 mm TDD configurations, indicate that with a single TDD, the useful daylight area ( 200 lux) remains very limited, while the map for 100 lux shows that more than 70% of the room is underlit. The absence of red zones on the 500 lux map indicates a negligible risk of over-illumination. Adding a second TDD improves daylight coverage, but the distribution remains uneven, with underlit areas persisting at the room's periphery. With four TDDs, the useful area ( 200 lux) covers nearly the entire room, and underlit zones become marginal. The risk of over-illumination ( 500 lux) remains very low, highlighting the benefit of multiple light sources for improving uniformity without causing glare.
4.2.2. TDDs with 350 mm Diameter (1.8 m Length)
The illuminance maps in Fig. 4 reveal a similar pattern to the 250 mm TDDs, but with overall improved performance. A single 350 mm TDD produces a larger, centrally illuminated area, while the room’s edges remain partially underlit. Adding a second TDD significantly reduces these peripheral low-light zones.
The four-TDD configuration stands out for its very uniform light distribution: the 200 lux map shows nearly 100 coverage of the useful area, and zones below 100 lux are almost completely eliminated. The 500 lux map remains predominantly yellow, indicating a low risk of over-illumination despite the substantial increase in total luminous flux.
4.2.3. TDDs with 540 mm Diameter (3 m Length)
Large diameter configuration (Fig. 5) exhibit distinctive daylighting characteristics. A signle 540mm TDD produces a highly illuminated central area, with elevated levels of 200 lux, but illuminance rapidly decreases toward the room’s periphery. The 500 lux map displays a pronounced red zone at the center, indicating a localized risk of over-illumination. With two TDDs, daylight coverage improves, although bright zones persist directly beneath the diffusers. In the case of four 540 mm TDDs, the useful daylight area is nearly fully covered; however, the 500 lux map reveals extensive red areas beneath each unit, pointing to a significant risk of localized glare.
The qualitative analysis of the illuminance maps reveals a strong concentration of light beneath each TDD, with a rapid decrease in illuminance toward the room’s periphery. This phenomenon can be attributed to the quasi-point source nature of the diffusers, which emit light in a pattern resembling that of a point source. According to the inverse square law, the illuminance E received at a point decreases proportionally to the square of the distance ddd from the source, expressed as :
where I is the luminous intensity. Although the surface reflectance coefficients (50% for walls, 80% for the ceiling, 19% for the floor) help diffuse light throughout the space, this diffusion is insufficient to fully compensate for the sharp illuminance drop. As a result, light distribution on the work plane (at 0.8 m height) remains uneven, with high brightness directly under the TDDs and darker zones near the edges.
Increasing the number of TDDs significantly improves both the amount and uniformity of daylight by reducing underlit zones and expanding the useful illuminated area. Larger diameters also allow for greater luminous flux transmission. However, configurations that combine large diameters with a high number of TDDs may lead to increased localized light intensity, resulting in over-illuminated zones. This phenomenon is due to the overlapping of light beams and concentrated diffusion beneath the diffusers, which can compromise visual comfort if not properly managed during the design process.
It is also worth noting that visual inspection of illuminance maps provides valuable insights into lighting behaviors that global metrics alone may fail to capture, such as unexpected shadow areas, unwanted reflections, or directional hotspots. These issues can be mitigated through refined design adjustments of the daylighting system.
4.3. Daylight metrics performance
To assess the daylighting performance of the various TDD configurations in the classroom ( ), two complementary analyses were conducted: Daylight Autonomy (DA) and illuminance quality, based on the breakdown of Useful Daylight Illuminance (UDI). These indicators allow for evaluating not only the quantity of available daylight, but also its suitability in meeting visual comfort requirements during occupied hours.
4.3.1. Daylight autonomy (DA) analysis
The histogram in Fig. 6 highlights the impact of both the diameter and the number of TDDs on daylight autonomy. For a diameter of 250 mm, DA increases from 3% with a single TDD to 11% with two, and up to 25% with four. With 350 mm TDDs, the values reach 8%, 17%, and 38% respectively. Finally, the 540 mm TDDs achieve the highest levels: 40% (one TDD), 53% (two), and up to 81% with four devices. These results reflect an increasing capacity to meet lighting needs without relying on artificial lighting as both the diameter and the number of TDDs increase.
Figure 6
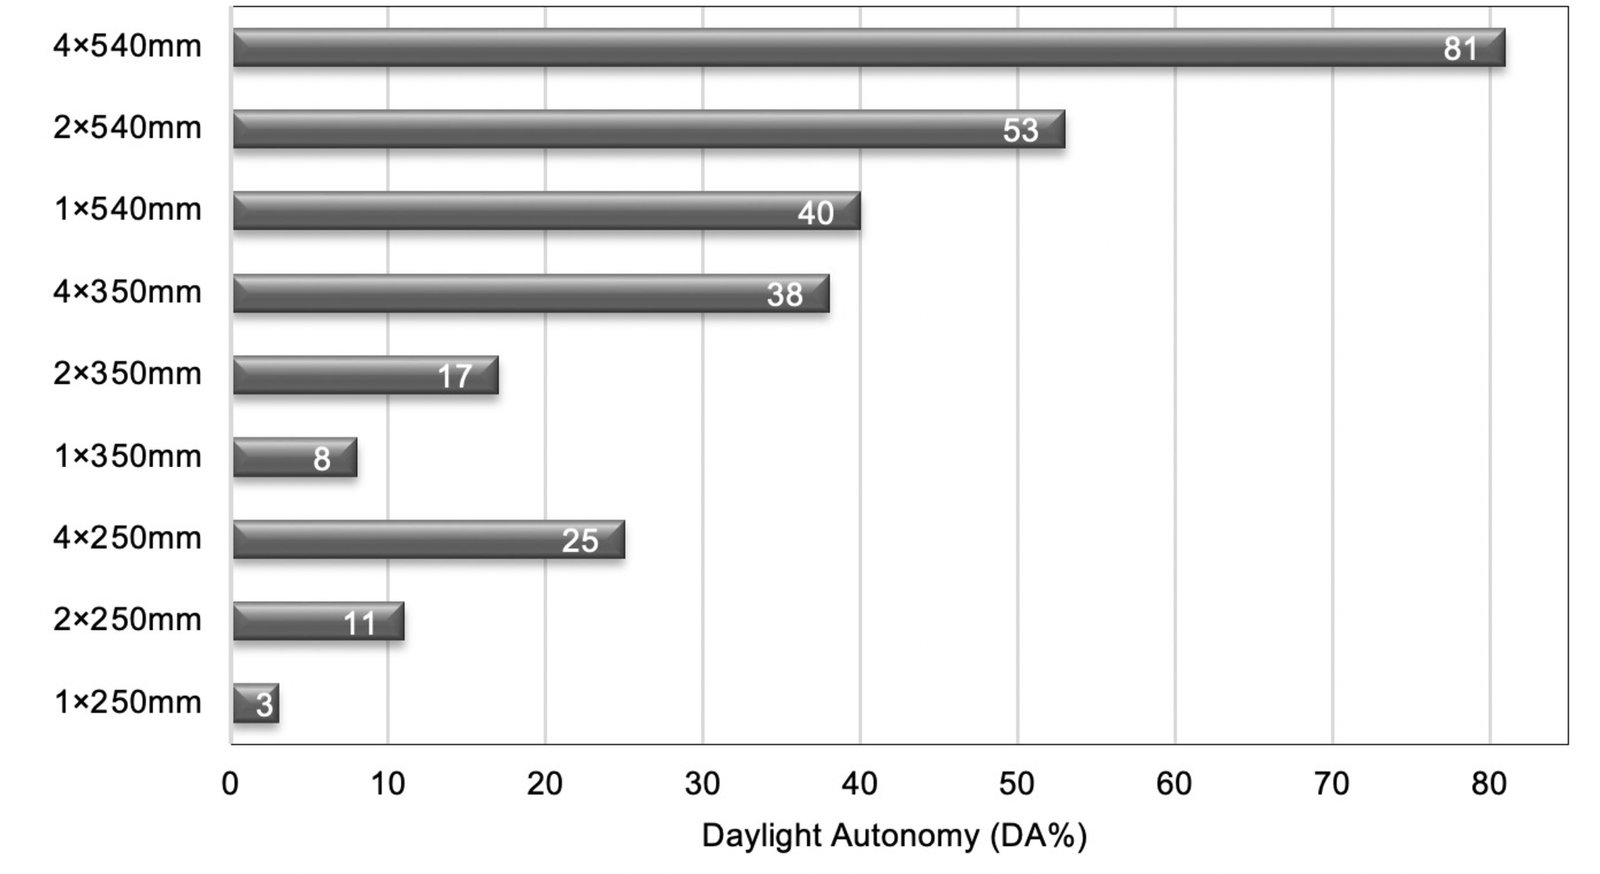
Fig. 6. Average Daylight Autonomy (DA) for different TDD configurations.
However, this quantitative performance does not necessarily guarantee optimal lighting quality. Indeed, the illuminance maps reveal that the 4×540 mm configuration exhibits zones of light saturation, which may lead to visual discomfort. Conversely, the 4×350 mm configuration offers a better balance between light quantity and uniformity.
For a more refined analysis, DA can be related to the total surface area of the openings, allowing the evaluation of luminous efficiency per unit area.
The 2×540 mm configuration (total area ≈ 0.46 m²) shows a higher efficiency (≈ 115% DA per m²) than the 4×350 mm configuration (≈ 0.38 m², or ≈ 99%).
4.3.2. Useful daylight illuminance (UDI-a)
Figure 7, illustrates the average distribution of the three categories of Useful Daylight Illuminance (UDI-a, UDI-i, UDI-e), as defined in Section 3.3, which assess the quality of daylighti in the classroom for each TDD configuration.
Figure 7
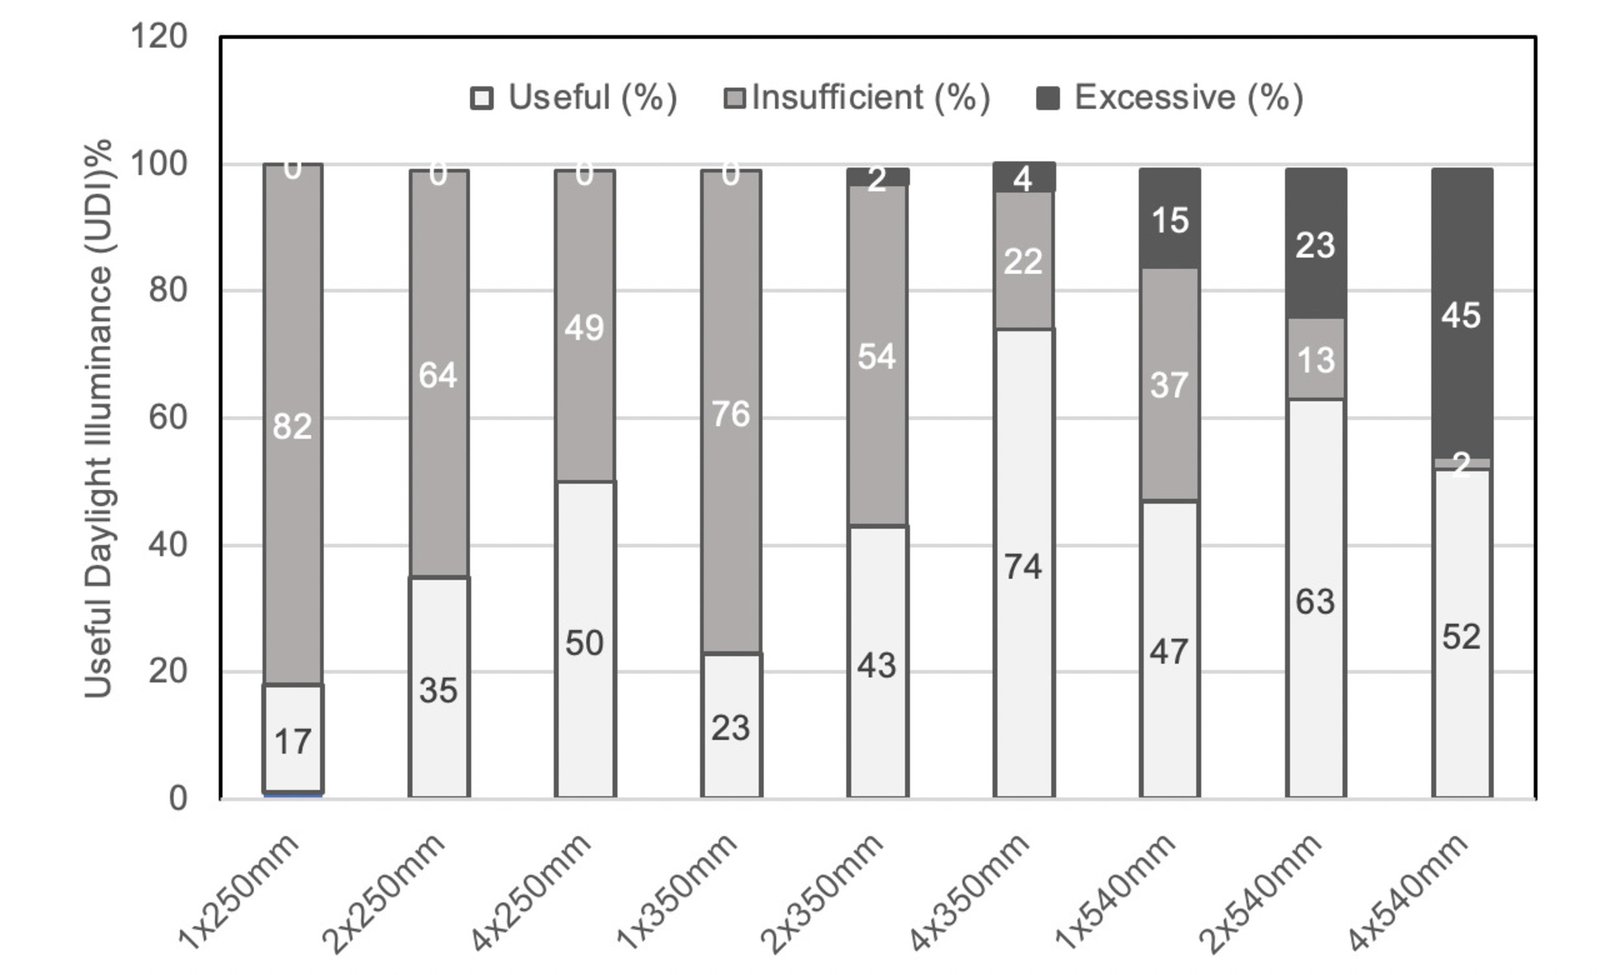
Fig. 7. Average UDI (a / i / e) Distribution by TDD Configuration.
This visualization allows for a direct comparison of each configuration’s ability to deliver daylight levels that meet visual comfort and learning needs.
The results highlight the combined effect of diameter and number of TDDs on daylight distribution .
- Small-diameter TDDs (250 mm) offer limited performance, even when the number of units increases.
- With a single TDD, the useful surface (UDI-a) does not exceed 17%, while over 82% of the room remains underlit.
- Two TDDs improve the outcome (UDI-a ≈ 35%), but underlit areas still dominate.
- Even with four TDDs, UDI-a barely reaches 50%, with persistent dark zones and no significant over-illumination observed.
- Medium-diameter TDDs (350 mm) provide a better compromise.
- A single unit delivers ~23% useful coverage.
- With two 350 mm TDDs, UDI-a reaches 43%. However, this configuration performs worse in reducing underlit zones (UDI-i = 37%) compared to the four 250 mm TDD setup (UDI-i = 30%), highlighting the trade-off between the number of units and their individual size.
- The 4×350 mm configuration stands out: over 74% of the room receives comfortable illuminance, overlit areas are limited (~4%), and underlit zones drop to 22%.
- Large-diameter TDDs (540 mm) show a different trend
- A single 540 mm TDD already achieves 47% UDI-a, but with 15% over-illumination.
- With two TDDs, UDI-e increases to ~23%.
- With four 540 mm TDDs, useful daylight coverage (UDI-a) reaches 52%, but overexposure becomes dominant (UDI-e = 45%), and only 2% of the area remains underlit (UDI-i). This configuration provides high daylight levels, but at the cost of visual discomfort due to extensive glare risks.
Consequently, increasing the diameter and number of TDDs improves DA but always increases the risk of over-illumination. The best compromise is the 4×350 mm configuration, which offers a satisfactory DA (38%), a high UDI-a (74%), and minimal over-illuminated zones.
4.4. Performance synthesis based on DA and UDI metrics
A cross-analysis of Daylight Autonomy (DA) and Useful Daylight Illuminance (UDI) highlights clear performance trade-offs between TDD configurations. The three most promising configurations display distinct profiles:
- 4×350 mm: Delivers a high level of useful daylight (UDI-a = 74%) with minimal over-illumination (UDI-e = 4%), ensuring balanced visual comfort.
- 2×540 mm: Offers good daylight coverage (UDI-a = 63%) and reduced underlit zones (UDI-i = 13%), but introduces moderate overexposure (UDI-e = 24%).
- 4×540 mm: Achieves the highest daylight autonomy (DA = 81%) and nearly eliminates underlit areas, but results in significant over-illumination (UDI-e = 45%), raising concerns for visual comfort.
The results demonstrate that prioritizing DA maximization (Wu and Li, [15]) often compromises visual comfort in sun-intensive climates.
This DA/UDI analysis reveals a key paradox: high-DA configurations (e.g., 4×540 mm) generate critical over-illuminated zones yet fail to identify localized hotspots. We therefore conduct systematic evaluation of areas exceeding 2,000 lux (EN 17037 threshold).
4.5. Glare hotspot analysis in classroom TDD configurations
Daylight levels exceeding 2,000 lux (the glare threshold for educational spaces EN 17037) were mapped using a 0.5 m × 0.5 m analysis grid (1 point per 0.25 m² of work-plane). Each measurement point represents potential visual discomfort at student desk height (0.8 m above floor).
Data from Table 1, reveals three distinct risk profiles:
- 4×350 mm configuration exhibits a low-risk glare profile:
- 7% of the simulated room area (7.25 m²) exceeded the 2000 lux threshold.
- Only 5 severe glare points (>2666 lux) were identified, constituting 17.2% of critical zones.
Table 1
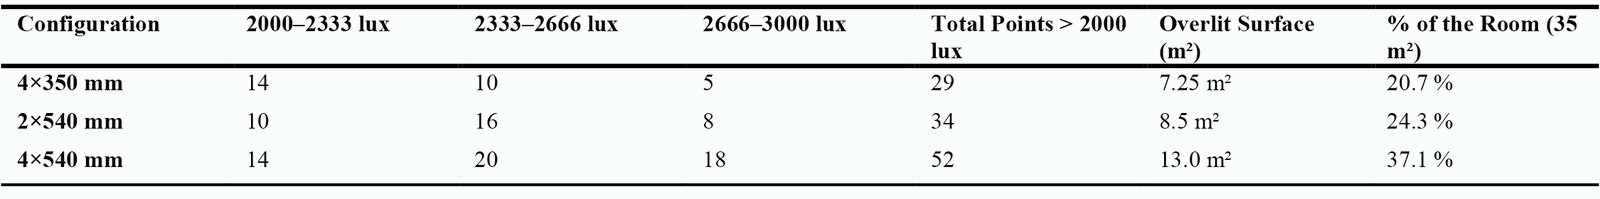
Table 1. Glare intensity distribution (>2000 lux).
This configuration fully complies with the EN 17037 [1] glare probability thresholds for workspaces (2000 lux), demonstrating its suitability for glare-sensitive environments.
- 2×540 mm configuration presents a moderate-risk profile:
- 3% of the room area (8.5 m²) surpassed 2000 lux.
- Severe hotspots increased to 8 (23.5% of critical zones), reflecting a 60% rise relative to the 4×350 mm baseline.
The results suggest that optical mitigation strategies, such as micro-prismatic films or luminance-reducing diffusers, are necessary to align with visual comfort standards in applications requiring uniform illumination.
- 4×540 mm Configuration represents a high-risk situation:
- 1% of the room area (13.0 m²) exceeded glare thresholds, nearly double the EN 17037 recommended limit of 20%.
- Severe hotspots peaked at 18 (34.6% of critical zones), a 3.6fold increase compared to the 4×350 mm configuration.
This outcome underscores the inherent trade-off between high daylight availability and visual discomfort in unoptimized lighting designs, corroborating findings from Hirning et al. [44] on LED array density and glare perception.
The 4×350 mm configuration emerged as the optimal balance between daylight provision and glare control, whereas the 4×540 mm array necessitates redesign (e.g., luminance zoning or dynamic controls) to meet ergonomic standards.
Figure 8 illustrates the illuminance distribution at each point within the classroom, covering the full range of lux values, including the over-illuminated zones mentioned in Table 1 (over-illuminated areas highlighted in red). Three representative configurations are compared (4×350 mm, 2×540 mm, and 4×540 mm), providing a clear view of the range of lighting conditions in the studied space.
Figure 8
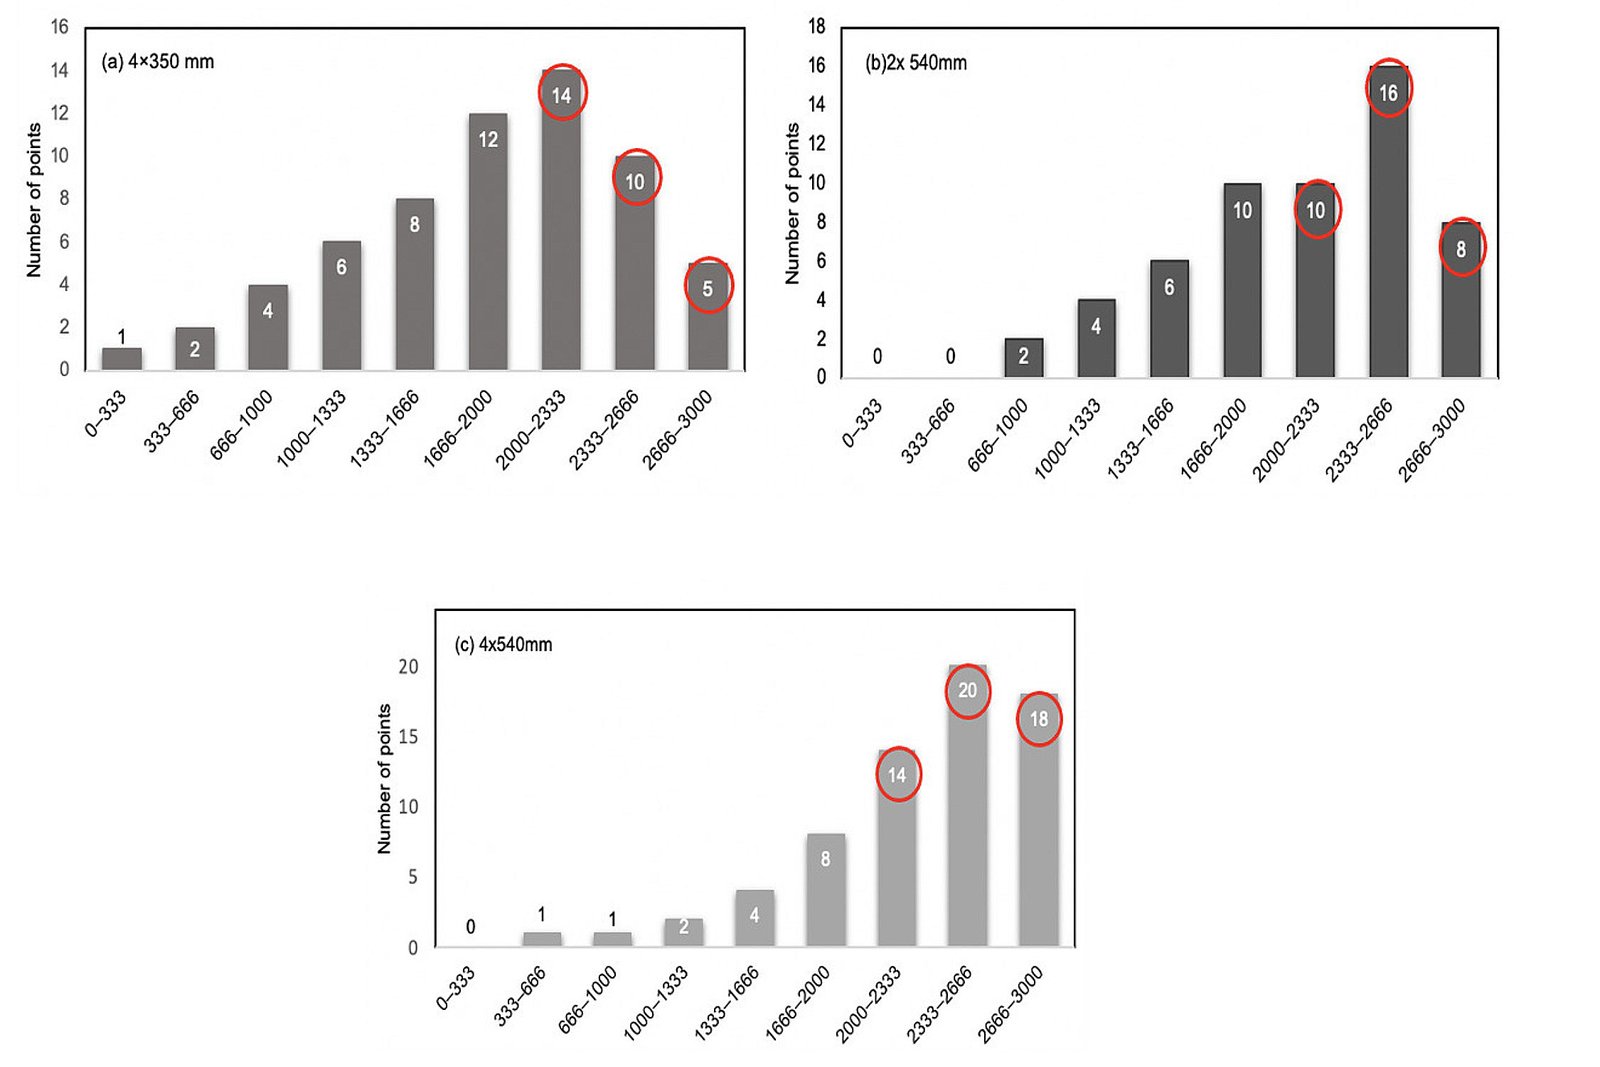
Fig. 8. Distribution of illuminance levels in the classroom for different TDD configurations: (a) 4x350mm, (b) 2x540mm, (c) 4x540mm).
The glare analysis therefore highlights a clear trade-off: while larger TDDs increase daylight, they exacerbate glare. The 4×350 mm configuration is the optimal compromise, ensuring visual comfort without sacrificing significant daylight provision.
4.6. Multi-criteria evaluation and benchmarking
The overall performance of each TDD configuration was assessed using the global performance score described in Section 3.5. This score integrates the four key daylighting metrics DA, UDI-a, ASE,
and Uniformity into a single value, facilitating a direct comparison and objective ranking of all design alternatives.
(13)
The final scores, calculated using Equation (13), are presented in Table 2 alongside the individual metric values for each configuration.
Table 2
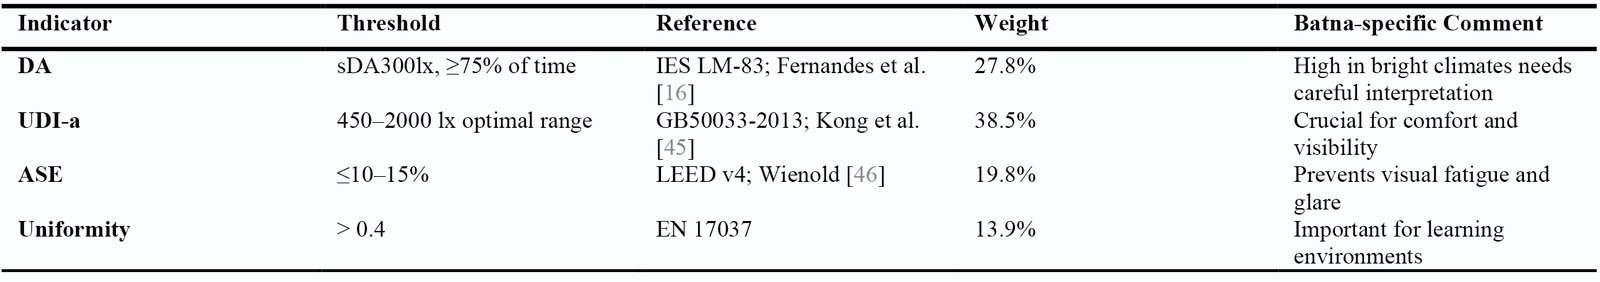
Table 2. Weighting scheme for multi-criteria daylighting assessment.
When applied to the three best-performing TDD configurations, the results shown in Table 3 highlight key trade-offs: The ranking derived from this score (Configuration A > B > C) identifies the solution that offers the best compromise between daylight availability, visual comfort, and glare protection, aligning with the priorities defined for this study.
Table 3
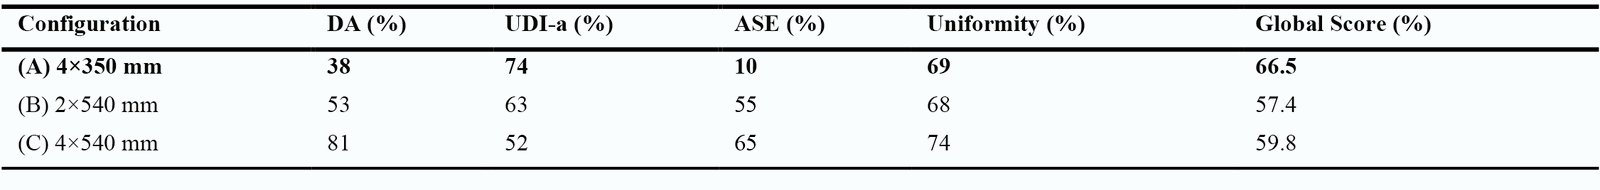
Table 3. Daylighting performance indicators and global scores.
The 4×350 mm configurations demonstrate the best balance between daylight provision and comfort, with:
- DA = 38%, aligned with values observed by Fernandes and Regnier [16], and Boubekri et al. [47] for educational spaces in sunny climates (35–45%). The 4×540 mm configuration reaches 81%, matching the 80–97% range reported for 530 mm TDDs by Fernandes and Regnier.
- UDI-a = 74%, consistent with optimal comfort zones (65–75%) reported by Kong et al. [45],
- ASE = 10%, within the strict limits recommended by LEED v4 and Wienold [46] for glare prevention.
In contrast, the 4×540 mm configuration, despite its excellent DA (81%), suffers from excessive ASE (65%), far exceeding comfort thresholds and creating visual discomfort. Similarly, 2×540 mm yields moderate UDI-a and high ASE, reflecting suboptimal glare management.
Overall, this analysis underscores that maximizing DA alone is not a reliable design strategy. Beyond ~ 40% DA, additional daylight often leads to non-uniform distribution and increased glare, particularly below diffusers. Even when uniformity appears acceptable, it may mask local overexposure, as seen in the 4×540 mm case. Thus, the 4×350 mm layout emerges as the most context-appropriate option, offering a resilient balance between daylight sufficiency, uniformity, and visual comfort under the intense solar conditions of Batna.
The multi-criteria analysis confirms the 4×350 mm configuration as the optimal solution. It successfully balances daylight provision with visual comfort, unlike larger TDDs which, despite higher DA, cause excessive glare. For Batna's high-solar climate, this demonstrates that prioritizing visual quality over sheer light quantity is paramount.
5. Conclusion
This study provides a comprehensive multi-criteria assessment of Tubular Daylighting Devices (TDDs) for deep classrooms in high-solar climates, using advanced climate-based simulation and internationally recognized daylighting metrics. Our findings demonstrate that increasing TDD diameter and quantity enhances daylight autonomy but also raises the risk of excessive illuminance and associated glare highlighting that more daylight does not automatically translate to better visual comfort.
Through a weighted evaluation incorporating Daylight Autonomy (DA), Useful Daylight Illuminance (UDI), Annual Sunlight Exposure (ASE), and spatial uniformity, the 4×350 mm configuration emerges as the most balanced solution for the case-study classroom under the specific architectural and climatic conditions analyzed.
This arrangement provides high-quality daylight (DA = 38%, UDI-a = 74%), mitigates overexposure risks (ASE = 10%, 20.7% of area > 2000 lux), and ensures uniform distribution (uniformity = 69%) all while aligning with international recommendations for visual comfort and learning efficiency.
Our approach advances current practice by integrating high-resolution spatial mapping with a robust multi-criteria decision framework. This method can be readily adapted to other building types and climatic contexts, offering architects and designers a reliable roadmap for optimizing both daylight quantity and quality. Future work should aim to validate these findings with field measurements, explore hybrid daylight-artificial lighting strategies, and account for long-term maintenance factors such as material degradation and dust deposition.
Ultimately, this research affirms that the optimal design of daylighting systems in hot-arid climates must prioritize not only the maximization of daylight input but also the control of over-illumination and visual comfort ensuring healthy, productive, and sustainable learning environments. This study was conducted using actual climatic data (EPW file) for Batna. It does not account for the influence of furniture or occupants on light distribution and focuses exclusively on natural lighting, without considering artificial lighting or automatic control systems. These aspects will be addressed in future work to refine and expand the analysis.
Acknowledgments
The authors thank Mr Leberrara Abdelhey, former Master's student at the LPEA laboratory, for the initial idea that inspired this work. The authors also gratefully acknowledge all members of the LPEA laboratory for their scientific and technical support throughout this study.
Funding
This research received no external funding.
Contributions
F. Z. Ferahta: Conceptualization, refinement of the numerical model, simulations, data analysis, interpretation of results, and writing of the manuscript; M. Damani: Development of the initial numerical model and execution of the simulations.
Declaration of competing interest
The authors declare no conflict of interest.
References
- EN 17037:2018. Daylight in buildings. European Committee for Standardization (CEN).
- U.S. Green Building Council. (2019). LEED v4.1 for Building Design and Construction. Washington, DC.
- Heschong, L. (2003). Windows and Classrooms: A Study of Student Performance and the Indoor Environment. Heschong Mahone Group.
- P.D. Swift, G.B. Smith, Cylindrical mirror light pipes, Solar Energy Materials and Solar Cells, 36:2 (1995) 159-168. https://doi.org/10.1016/0927-0248(94)00172-3
- S. Samuhatananon, S. Chirarattananon, P. Chirarattananon, An experimental and analytical study of transmission of daylight through circular light pipes, LEUKOS, 7:4 (2011) 203-219. https://doi.org/10.1080/15502724.2011.10732147
- D.J. Carter, The measured and predicted performance of passive solar light pipe systems, Lighting Research & Technology, 34:1 (2002). https://doi.org/10.1191/1365782802li029oa
- X. Zhang, T. Muneer, Mathematical model for the performance of light pipes, Lighting Research & Technology, 32:3 (2000) 141-146. https://doi.org/10.1177/096032710003200306
- X. Zhang, T. Muneer, J. Kubie, A design guide for performance assessment of solar light pipes, Lighting Research & Technology, 34:2 (2002) 149-168. https://doi.org/10.1191/1365782802li041oa
- D. Jenkins, T. Muneer, J. Kubie, A design tool for predicting the performances of light pipes, Energy and Buildings, 37:5 (2005) 485-492. https://doi.org/10.1016/j.enbuild.2004.09.014. https://doi.org/10.1016/j.enbuild.2004.09.014
- B. Malet Damour, H. Boyer, A.-H. Fakra, M. Bojic, Light pipes performance prediction: inter-model and experimental confrontation on vertical circular light guides, Energy Procedia, 57 (2014) 1977-1986. https://doi.org/10.1016/j.egypro.2014.10.062
- B. Malet Damour, S. Guichard, D. Bigot, H. Boyer, Study of tubular daylight guide systems in buildings: Experimentation, modelling and validation, Energy and Buildings, 129 (2016) 308-321. https://doi.org/10.1016/j.enbuild.2016.08.019
- A.S. Azad, K.V.S.K. Donthu, M.P. Wan, S.C. Kaushik, D. Rakshit, Energy savings of an optimized daylight-pipe system with single and dual reflectors in tropical climates of India, Journal of Solar Energy Engineering, 144:5 (2022) 051011. https://doi.org/10.1115/1.4054470
- L.L. Fernandes, C.M. Regnier, Lighting and visual comfort performance of commercially available tubular daylight devices, Solar Energy, 251 (2023) 420-437. https://doi.org/10.1016/j.solener.2023.01.022
- V. Thakkar, Experimental study of Tubular Skylight and comparison with Artificial Lighting of standard ratings, International Journal of Enhanced Research in Science Technology & Engineering, 2:6 (2013) 1-6.
- R. Wu, D.H.W. Li, Daylighting and energy performance of light pipes in northern China, Applied Energy, 95 (2012) 95-103.
- T.K.K. Wu, D.H.W. Li, Estimation of average daylight factor under obstructed CIE Standard General Skies, Lighting Research & Technology, 46:2 (2012). https://doi.org/10.1177/1477153512453578
- M.S. Mayhoub, A. Mesloub, M.A. Said, Comparative analysis of tubular daylighting device performance with acrylic and glass domes in arid climates, Journal of Building Engineering, 92 (2024) 108410. https://doi.org/10.1016/j.jobe.2023.108410
- S. Ji, G. Cao, J. Zhang, Y. Gao, N. Zou, Lighting design of underground parking with tubular daylighting devices and LEDs, Optik, 127:3 (2016) 1213-1216. https://doi.org/10.1016/j.ijleo.2015.10.189
- S. Kavuthimadathil, K. Ramamurthy, Location-specific optimization of free conic-dome daylight collectors for improved light pipe performance, Building and Environment, 256 (2024) 111497. https://doi.org/10.1016/j.buildenv.2024.111497
- D.S. Bisht, H. Garg, R.R. Shravana Kumar, V. Karar, Study and analysis of parameters affecting tubular daylighting device, in: V.K. Jain, V. Kumar, A. Verma (Eds.), Advances in Solar Power Generation and Energy Harvesting, Springer, 2020, pp. 73-92. https://doi.org/10.1007/978-981-15-3635-9_9
- J.A. Jakubiec, C.F. Reinhart, DIVA 2.0: Integrating daylight and thermal simulations using Rhinoceros 3D, DAYSIM and EnergyPlus, in: Proceedings of Building Simulation 2011, 12th Conference of IBPSA, Sydney, Australia, 2011, pp. 2202-2209.
- P.G. Ellis, R.K. Strand, K.T. Baumgartner, Simulation of Tubular Daylighting Devices and Daylighting Shelves in EnergyPlus, in: SimBuild 2004 Conference Proceedings, IBPSA-USA, 2004.
- A. Laouadi, A.D. Galasiu, H.H. Saber, C. Arsenault, Tubular daylighting devices-Part I: Development of an optical model, HVAC&R Research, 19:5 (2013) 536-556. https://doi.org/10.1080/10789669.2013.803401
- B. Chen, Y. Wei, X. Li, R. Cao, P. Jin, Numerical modeling of tubular daylighting devices, Optik, 145 (2017) 95-98. https://doi.org/10.1016/j.ijleo.2017.06.074. https://doi.org/10.1016/j.ijleo.2017.06.074
- Y. Fang, S. Cho, Design optimization of Building Geometry and Fenestration for Daylighting and Energy Performance, Solar Energy, 191 (2019) 7-18. https://doi.org/10.1016/j.solener.2019.08.039
- Z. Zhou, Z. Li, Energy performance of TDD-nanofluid hybrid systems in cold climates, Renewable Energy, 201 (2023) 1185-1198.
- D. Cılasun Kunduracı, S. Kızılörenli, A design proposal for improving daylight availability of a deep plan classroom by using tubular daylight guidance systems and movable shading devices, Politeknik Dergisi (Journal of Polytechnic), 27:4 (2024) 1305-1316. https://doi.org/10.2339/politeknik.1266467
- D.H.W. Li, E.K.W. Tsang, K.L. Cheung, C.O. Tam, An analysis of light-pipe system via full-scale measurements, Applied Energy, 87:3 (2010) 799-805. https://doi.org/10.1016/j.apenergy.2009.09.008
- A. Mesloub, et al., The visual comfort, economic feasibility, and overall energy consumption of tubular daylighting device system configurations in deep-plan office buildings in Saudi Arabia, Journal of Building Engineering, 68 (2023) 106100. https://doi.org/10.1016/j.jobe.2023.106100
- A. Goharian, M.J. Mahdavinejad, A novel approach to multi apertures and multi aspect ratio light pipe, Journal of Daylighting, 7:2 (2020) 186-200. https://doi.org/10.15627/jd.2020.17
- J. Mardaljevic, L. Heschong, E.S. Lee, Daylight metrics and energy savings, Lighting Research & Technology, 41:3 (2009). https://doi.org/10.1177/1477153509339703
- M.C. Dubois, Impact of Shading on Daylight Quality, Technical Report LUTADL/TABK-3062-SE, Lund University, Lund, Sweden, 2001.
- H. Li, D. Wu, Y. Yuan, L. Zuo, Evaluation methods of the daylight performance and potential energy saving of tubular daylight guidance systems: A review, Indoor and Built Environment, 31:2 (2021). https://doi.org/10.1177/1420326X21992419
- E. Brembilla, C.J. Hopfe, J. Mardaljevic, Influence of input reflectance values on climate-based daylight metrics using sensitivity analysis, Journal of Building Performance Simulation, 11:3 (2018) 333-349. https://doi.org/10.1080/19401493.2017.1364786
- Y.-C. Chan, A. Tzempelikos, Estimating detailed optical properties of window shades from basic available data and modeling implications on daylighting and visual comfort, Energy and Buildings, 126 (2016) 396-407. https://doi.org/10.1016/j.enbuild.2016.05.038
- Illuminating Engineering Society (IES), IES LM-83-12: Approved Method for IES Spatial Daylight Autonomy (sDA) and Annual Sunlight Exposure (ASE), Illuminating Engineering Society: New York, NY, 2012.
- C.F. Reinhart, M. Andersen, Development and validation of a Radiance model for a translucent panel, Energy and Buildings, 38:7 (2006) 890-904. https://doi.org/10.1016/j.enbuild.2006.03.006
- CIE 173:2006, Tubular Daylight Guidance Systems (including Erratum 1), Commission Internationale de l'Éclairage (CIE), Vienna, Austria, 2006.
- P.J. Littlefair, Innovative daylighting: Review of systems and evaluation methods, Lighting Research and Technology, 22:1 (1990) 1-17. https://doi.org/10.1177/096032719002200101
- Solatube International, Product Guide: Solatube Tubular Daylighting Systems, Solatube International: Carlsbad, CA, USA, 2015.
- G.J. Ward, The RADIANCE Lighting Simulation and Rendering System, in: Proceedings of SIGGRAPH '94: Computer Graphics Conference, Orlando, USA, 24-29 July 1994, pp. 459-472. https://doi.org/10.1145/192161.192286
- V.R.M. Lo Verso, E. Fregonara, F. Caffaro, C. Morisano, M.G. Peiretti, Daylighting as the driving force of the design process: From survey results to implementation in an advanced daylighting project, Journal of Daylighting, 1 (2014) 36-55. https://doi.org/10.15627/jd.2014.5
- OECD, Handbook on Constructing Composite Indicators: Methodology and User Guide, OECD Publishing, Paris, France, 2008.
- M.B. Hirning, G.L. Isoardi, V.R. Garcia-Hansen, Prediction of discomfort glare from windows under tropical skies, Building and Environment, 113 (2017) 178-186. https://doi.org/10.1016/j.buildenv.2016.08.015
- Z. Kong, J.A. Jakubiec, Towards an Integration of Visual Comfort and Lighting Impression: A Field Study within Higher Educational Buildings, Building & Environment, 216 (2022) 108989. https://doi.org/10.1016/j.buildenv.2022.108989. https://doi.org/10.1016/j.buildenv.2022.108989
- J. Wienold, J. Christoffersen, Evaluation methods and development of a new glare prediction model for daylight environments, Energy & Buildings, 38:7 (2006) 743-757. https://doi.org/10.1016/j.enbuild.2006.03.017
- M. Boubekri, J. Lee, P. Mac Naughton, M. Woo, L. Schuyler, B. Tinianov, U. Satish, The impact of optimized daylight and views on the sleep duration and cognitive performance of office workers, Building and Environment, 171 (2020) 106663. https://doi.org/10.3390/ijerph17093219
2383-8701/© 2025 The Author(s). Published by solarlits.com. This is an open access article distributed under the terms and conditions of the Creative Commons Attribution 4.0 License.

2420
Total views
Citations
SHARE ON


