Article | 11 December 2025
Volume 12 Issue 2 pp. 520-547 • doi: 10.15627/jd.2025.31
Design Optimization of Atrium Skylights for Enhanced Office Building Performance Using NSGA-II: Case Study in Yazd, Irans
Parisa Javid, Niloufar Nikghadam, Alireza Karimpour,* Jaleh Sabernejad
Author affiliations
Department of Architecture, ST.C, Islamic Azad University, Tehran, Iran
*Corresponding author.
p.javid@iau.ir (P. Javid)
n_nikghadam@iau.ir (N. Nikghadam)
Alireza.karimpour@iau.ir (A. Karimpour)
jaleh.sabernejad@iau.ir (J. Sabernejad)
History: Received 30 June 2025 | Revised 2 September 2025 | Accepted 17 September 2025 | Published online 11 December 2025
2383-8701/© 2025 The Author(s). Published by solarlits.com. This is an open access article distributed under the terms and conditions of the Creative Commons Attribution 4.0 License.
Citation: Parisa Javid, Niloufar Nikghadam, Alireza Karimpour, Jaleh Sabernejad, Design Optimization of Atrium Skylights for Enhanced Office Building Performance Using NSGA-II: Case Study in Yazd, Iran, Journal of Daylighting, 12:2 (2025) 520-547. doi: 10.15627/jd.2025.31
Figures and tables
Abstract
The increasing demand for energy and the impact of climate change underscore the necessity of energy-efficient building designs. This study optimizes atrium skylights as a passive design solution for Yazd, Iran aiming to enhance thermal and visual comfort. The research team used simulation tools, including Rhino 8, Grasshopper, Ladybug, and Honeybee, to model key design parameters: skylight geometry, skylight-to-roof ratio, and material properties. The study applied multi-objective optimizations to four key metrics: Daylight Glare Probability (DGP), Annual Sunlight Exposure (ASE), Predicted Mean Vote (PMV), and Spatial Daylight Autonomy (sDA). The A-3A configuration, with the highest length-to-width ratio of 3, provided the best thermal comfort (PMV = -0.49), optimal daylight distribution (sDA = 98.4%), minimal glare (DGP = 29.6%), and a moderate ASE (29.6%), demonstrating superior comfort and reduced solar heat gain. The sensitivity analysis showed that the A-3A model outperformed other configurations, improving thermal comfort (PMV) by 24% and sDA by 7.2% over the base model. The Morris method identified skylight geometry and SRR as most influential for solar exposure and daylight distribution. This study offers clear guidance for optimizing atrium skylight designs in to enhance thermal and visual comfort, laying the groundwork for further research, including the integration of renewable energy, to enhance performance in hot climates.
Keywords
daylight performance, atrium configuration, thermal comfort, multi-objective optimization, skylight's geometry
Nomenclature
| PMV | Predicted Mean Vote |
| SRR | Skylight to Roof Ratio |
| ASE | Annual Sunlight Exposure |
| MOO | Multi-objective optimization |
| sDA | Spatial Daylight Autonomy |
| U-Value | Thermal transmittance |
| BWh | Refers to a Hot Desert Climate |
| WWR | Window-to-Wall Ratio |
| EPW | Energy Plus Weather File |
| NSGA-II | Non-dominated sorting genetic algorithm II |
| Σ | Mean of elementary effects |
| μ | Standard deviation |
| DGP | Daylight glare probability |
1. Introduction
Buildings designed with high energy performance in mind are not just a theoretical concept, but an essential step towards a net-zero future [1]. The use of daylight as a means of reducing energy loss is an integral part of energy-efficient architecture [2]. Among numerous methods for providing thermal comfort, those using passive systems utilizing natural energy streams such as solar radiation and ventilation have a historical past and remain highly relevant today. The integration of passive design principles into building design has become increasingly important due to increasing concerns over fuel shortages, rising energy costs, and environmental degradation. Such systems draw strongly on the initial and fundamental design choices of the architect, namely deciding on the form of the building and its structural organization so that architectural elements can effectively contribute to passive heating and cooling. Atria, as a significant architectural element, plays a central role in enhancing daylighting and solar gain in interior spaces [3]. The optimization of buildings, using intelligent technologies, is critical to achieving energy efficiency by minimizing energy loss and maintaining occupant comfort [4–5]. A building's solar comfort during the winter months can be improved, and heating costs can be reduced by utilizing direct solar radiation that comes through windows. As natural sunlight provides warmth and brightness, it is said to give a feeling of solar comfort. During the summer, the opposite effect takes place, as uneven sunlight distribution leads to overheating and increased cooling requirements [5]. Single-glazed windows have the primary disadvantage of not providing adequate heat resistance in a window system design, resulting in substantial cooling energy losses during the summer [6]. The use of large glass areas by architects enhances aesthetic qualities and provides expansive views [7].
Nevertheless, some fail to consider the amount of energy consumed, as well as visual and thermal comfort. Office buildings are subjected to very high cooling loads in the summer because of substantial solar gains [8]. Controlling glare in a clear sky is challenging, and it is mainly managed through window shades [9]. However, the right skylight shape not only provides ample daylight but also has the potential to alleviate visual discomfort, offering a promising solution that can inspire hope in the field [10]. As a result of the prolonged operation of active systems in highly glazed buildings, overheating poses a significant challenge to energy regulations. It is preferable to use passive HVAC systems to reduce overheating because they maximize interior daylighting and minimize energy consumption [11].
The design of daylight-rich spaces is a continuous challenge for architects and building researchers. Architects often incorporate a large amount of glazing to maximize natural light [12]. However, glare, which can significantly impact occupant satisfaction, often drives the need for artificial lighting during daytime hours. As a result, architects require straightforward and validated evaluation metrics that can help them determine which methods are most effective in reflecting the actual performance of buildings, as well as identify the most reliable techniques for measuring and reporting them [13]. Defining thermal comfort as a state of mind resulting from satisfaction with the surrounding thermal environment is an essential aspect of building design [14]. The characteristics of the environment influence the exchange of heat between the human body and its surroundings. Thermal comfort assessment is typically based on air temperature, relative humidity, air velocity, and average radiant temperature. Physiological mechanisms such as sweating, shivering, and blood flow regulation maintain thermal equilibrium in the body [15]. The efficiency of these mechanisms decreases with age, making it increasingly difficult for older individuals to adjust their core body temperature in response to changed environmental conditions [16]. Considering the impact of age on thermal comfort in sustainable building design should lead to empathy and understanding among the audience towards the varied needs of occupants. Through windows, visible sunlight is directed into interior spaces, lighting energy is reduced, and solar heat is captured during the winter [17]. By reducing the thermal energy consumption of buildings and increasing visual comfort, they contribute to decreased energy consumption. As window systems are typically established during the early stages of design, modifying them later can be difficult. About 80% of the total building costs are determined during this initial phase of the design process [18]. Although optimizing window designs can enhance occupant comfort, it may not be sufficient to achieve optimal comfort. To improve comfort and minimize energy consumption, advanced daylight control systems must ensure more uniform light distribution [19]. Additionally, researchers have investigated the optimization of shading system designs and configurations [20–21], In addition, the window-to-wall ratio (WWR) and other elements of the building envelope are also considered [22], orientation [23], geometry [24], and types of glazing materials [25,26]. Building designers should integrate these factors during the early design stage of a building to improve its thermal, visual, and energy performance [27]. Thermal comfort and aesthetics often clash in office buildings with extensive glass facades [28]. To enhance accessibility, many developers have incorporated sunshades into buildings as a means of increasing indoor comfort, rather than solely considering energy consumption [29,30]. According to research, solar radiation cooling and window heat loss account for a significant portion of energy loss in offices [25–31]. Buildings can benefit from skylights by maximizing daylight and reducing electrical lighting demand. As a result of excessive sunlight, they can pose problems in tropical climates [32]. The integration of key performance indicators into the design of atrium skylights in office buildings, particularly in regions with extreme climatic conditions, is clearly lacking, as evidenced by existing literature and practical implementations.
2. Literature review
A variety of strategies can be used to maximize the benefits of skylights [33]. There are many daylighting techniques, but skylights are among the best. They enhance daylight entry, uniformity, and reduce the need for artificial light [34,35]. In low-rise structures with expansive floor plans, they are especially suitable [14]. The incorporation of daylight through skylights also promotes comfort, productivity, and health [36] as well as occupant well-being [36–39] Skylights can, however, be problematic in tropical regions due to the risk of excessive sunlight exposure [32–40]. Skylights should therefore be explored in climates like Yazd further, particularly through further research. Buildings with skylights often assess daylight performance through modeling and simulation methods, among others [41]. Skylights are openings or apertures on the roof of a building; their relative size is typically determined by their proportion to the building's total floor area (SFR). Skylights can be classified into various types according to their performance characteristics [41–42]. To promote deeper daylight penetration, clerestory skylights can be aligned with the room's wall. Depending on the trajectory of the sun, a sawtooth skylight can follow its path. In comparison to other types of skylights, monitor skylights typically offer more consistent performance throughout the year. On the other hand, flat skylights are effective for expansive areas in any climate and can provide bright, low-glare lighting [43]. Several studies have evaluated daylight performance in buildings with skylights, although most have been conducted in subtropical or temperate climates [41,42]. Due to geographical factors, the apparent position of the sun (solar radiation) changes consistently in these regions. In contrast, tropical regions experience relatively high levels of solar radiation throughout the year since they are located close to the equator [44].
In low-rise buildings, skylights and similar top lighting methods can pose challenges due to excessive direct sunlight and heat buildup; furthermore, Li et al. [21], Marzouk and ElSharkawy [22], and Motamedi [42] Performed parametric modeling and optimization studies on skylights. Optimization techniques are generally limited by specific cases, variables, and parameters, which are not necessarily applicable to different building types, climate conditions, and floor areas. There is a lack of research regarding how to optimize skylight designs for atriums in office buildings based on geometry, materials, and skylight-to-roof ratios. In hot and dry climates such as Yazd, where annual daylight penetration is relatively high, this gap is particularly significant for office buildings.
Energy consumption is the primary objective in envelope design during early stages of building design, according to literature. Several energy consumption goal functions have been identified, including heating, cooling, and total consumption [23,24]. As part of the global initiative to reduce carbon emissions, the building industry must undergo a low-carbon revolution. Recent studies have increasingly focused on carbon emissions as an objective function of architectural design [45]. The prediction of mean vote (PMV), the duration of thermal discomfort (TDH), and the percentage of thermal discomfort are other objective measures of thermal comfort [23]. In their study, Mohsenin et al. [46] The energy consumption of the atrium was examined not just as a function of its geometry, but also as a function of various design parameters. In addition to climate, building thickness, material reflectance, material transmittance, furniture arrangement, and monitor roof glazing height, these parameters also need to be considered. According to Huang et al.'s research [47] Solar heat gain through windows accounts for 65-80% of the cooling load in buildings in Hong Kong's cooling-dominant climates. During the hottest months of the year, air-gel glazing reduces cooling loads by only 3.5-4% on a commercial building model with 16,000 square meters of air-conditioned space and 3,200 square meters of windows (excluding atriums and skylights). Babak R. et al. [48] Found that four design parameters affect high-rise office building energy consumption sequentially: building orientation, plane shape (aspect ratio), plane depth, and window-to-wall ratio. Aram and Alibaba [49] Identified the optimal single-story office building model with a corner atrium, according to Abdulsalam.et al. Atrium plane geometries and components can significantly impact a building's thermal performance, according to Nasrollahi et al. Narrow, elongated, or rectangular atriums with a high length-to-width ratio consume considerably more energy than square-shaped atriums[50]. Energy performance, lighting, and thermal comfort are optimal when the atrium area ratio is 1:4. However, there has been limited research on the influence of complex atrium vertical dimensions, including platform position, profile shape, and height. Interaction with energy and thermal performance. Based on Haoyi L. et al. in their study [51] Building with an atrium that reaches [52] deeper than 0.183 meters should keep the atrium's ABAR as low as possible, according to Zhen Zhong G. et al. [53] The optimal atrium design parameters include height-to-span ratios, atrium volume ratios, skylight area ratios, and width-to-depth ratios of atria. It is concluded that these parameters have optimal values as DSR = 2, VR = 0.13, SR = 0.1, and FDR = 2.5.
As Wang et al. [36] found, minimizing section aspect ratio (SAR) can reduce energy consumption in cold climates. A study was conducted by Fei Xu et al. and Peihao W. et al. [37], which examined how SAR, transmittivity, and absorption of membrane roofs were affected by the openings at the top of the roof. The thermal performance of Chinese buildings is affected by the top-to-bottom area ratio of their atria (TBAR) [38]. Studies have shown that increasing the span-to-height ratio (SHR) benefits the thermal environment and lowers air temperature. The study by Geng et al. [39], found that maximizing solar heat ratio (SHR) in atriums of office buildings reduces energy consumption within the typical range of 1 to 3. According to a review of atrium design studies, several key parameters are heavily considered, including the building's orientation, plane shape, area ratio, ventilation strategies, skylight configurations, and glazing components. Laouadi et al. [54] investigated the impact of various skylight types, glass types (double gray, double clear, and triple clear low e), and atrium plane shapes (three-sided and linear atria) on thermal and energy performance in cold climates. According to Dai et al. [55], four typologies were compared in terms of cooling and heating loads in nearby air-conditioned zones. Pan et al. [56] examined the effects of non-uniform thermal conditions in the atrium on HVAC load using EnergyPlus and CFD. According to Wang et al. [36], atriums with different section aspect ratios (SAR) and skylight area ratios (AR) perform differently in terms of energy performance. Using their research, they determined the optimal size of atriums to minimize annual energy consumption. Beyraghshamshir et al. [57] investigated the energy efficiency of courtyards and atriums in Iran, finding that converting a courtyard into an atrium resulted in reduced heating and lighting consumption. Further, a canopy can be lowered. Additionally, building shapes can be optimized for energy conservation. Using a genetic algorithm, Jin et al. [58], proposed an initial assessment method for thermal load characteristics using a free-form optimization method. According to Freewan's study, buildings sloped inward and outward in south and north directions showed differing energy use and thermal performance. To determine how vertical facades affect energy efficiency and thermal dynamics in buildings, these results were compared to those observed for horizontal facades [59,60]. The impact of skylights on offices has been investigated in a few studies. A study by Erica Cochran et al. examined the effects of dynamic shading on office skylights [61]. Various researchers, such as Karam et al., believe that skylights may help reduce load and energy consumption. Based on this hypothesis, designers will be able to successfully balance architectural environments at the initial design stage [62]. Recent research has emphasized the importance of visual comfort [63–64]. Zhengshu et al. [65] conducted an initial analysis using Rhino, Honeybee, and Ladybug software, followed by a multi-objective optimization that evaluated energy use, light comfort, and thermal comfort through indicators such as EUI, UDI, and PMV. Zhengshu Chen et al. [66] utilized a four-directional office atrium as the case study in their study. The research team developed a base model using Rhino and Grasshopper, which are parametric modeling software platforms. Ladybug and Honeybee, environmental simulation plugins, were employed to assess daylighting, energy consumption, and thermal comfort. The atrium featured a net height of 18 meters, a skylight-to-roof ratio of 0.6, and a flat roof. The skylight glazing exhibited a U-value of 2.0, a solar heat gain coefficient (SHGC) of 0.35, and a visible transmittance (VT) of 0.6. These tools and parameters facilitated the analysis of energy performance and environmental impact. Multi-objective optimization was applied to enhance energy efficiency, visual comfort, and thermal performance. Wei Xiao et al. [67] Within this research framework, sensitivity analysis is conducted using the Extended Fourier Amplitude Sensitivity Test (EFAST) method. Following the control of geometric parameters, parametric modeling is performed with Rhinoceros and the Grasshopper plug-in. The geometric model is then integrated with EnergyPlus and Radiance, two widely recognized simulation engines, through Ladybug Tools plug-ins. The optimization process is subsequently carried out using Octopus, a multi-objective optimization (MOO) plug-in, to determine optimal solutions. Yibing Xue et al. [39] use advanced design and simulation tools to optimize daylight quality in commercial atriums. They use digital modeling software, including Rhino and Grasshopper. They utilize environmental analysis tools, such as Ladybug and Honeybee, to simulate daylight and glare for each design parameter. These tools enable a thorough analysis of geometric factors, such as shape and size, as well as material properties, including surface type and reflectance. Table 1 shows a literature review of studies in this field.
Table 1
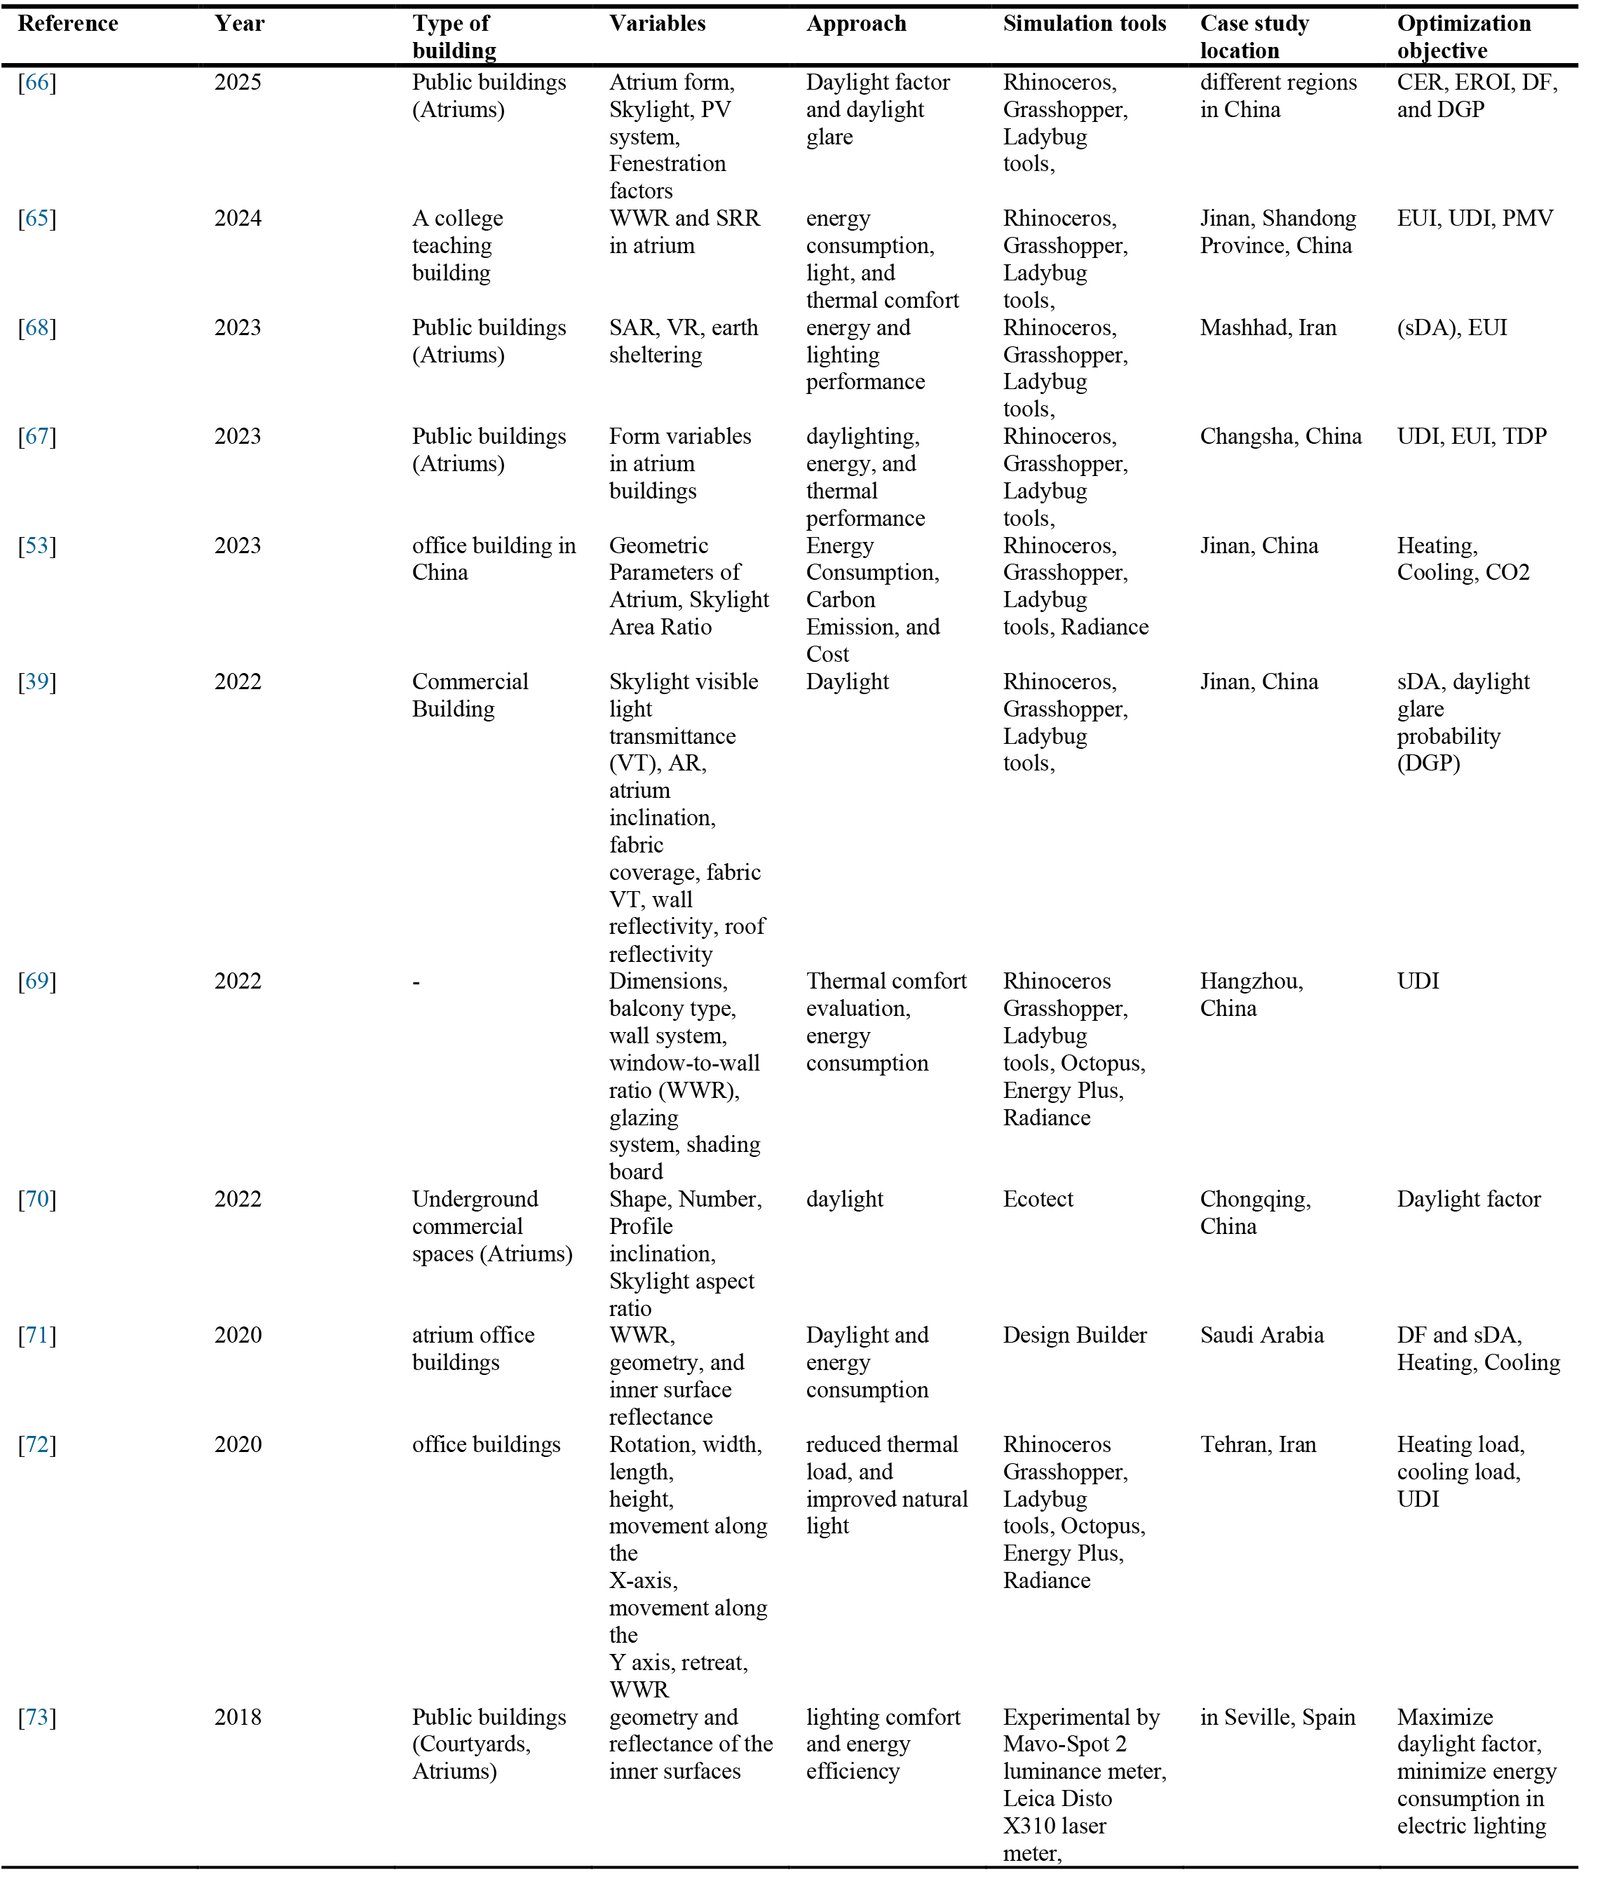
Table 1. Literature review.
In the reviewed literature, the software tools Rhinoceros and Grasshopper, as well as Ladybug Tools, have been the most widely used among researchers for parametric design and environmental simulations. These tools have been extensively applied in evaluating energy performance, visual comfort, and thermal comfort in buildings. They have been used to simulate energy consumption, daylighting, and thermal comfort in various indoor and outdoor spaces. These tools enable researchers to conduct accurate analyses of geometric factors and material properties, facilitating optimizations that improve energy performance and occupant comfort. A considerable amount of research has focused on optimizing daylighting systems in buildings, particularly in hot, dry regions. However, few studies focus on optimizing multiple daylighting parameters at once. These include Predicted Mean Vote (PMV), Annual Sunlight Exposure (ASE), Spatial Daylight Autonomy (sDA), and Daylight Glare Probability (DGP) in office buildings. Most existing studies focus on individual parameters, leaving a gap in understanding joint optimization, particularly for atrium skylights, which are crucial for daylighting. Research is also limited on balancing these parameters for Yazd’s specific climate.
This study seeks to answer the following research questions:
- How can multi-objective optimization be used to improve the design of atrium skylights and daylighting performance in office buildings simultaneously?
- What are the most effective ways to balance Predicted Mean Vote (PMV), Annual Sunlight Exposure (ASE), Spatial Daylight Autonomy (sDA), and Daylight Glare Probability (DGP) in Yazd's hot and dry climate?
- How can atrium skylights enhance the performance of office buildings while addressing Yazd's unique climatic challenges?
The main objectives of this study are:
- This study aims to develop a new multi-objective optimization strategy. It seeks to optimize PMV, ASE, sDA, and DGP for office buildings with different atrium skylight geometries.
- This study examines the impact of atrium skylight geometries on thermal comfort, energy consumption, and daylighting in Yazd’s climate.
- This study will guide architects and engineers to design atrium skylights. It targets maximizing daylight, reducing energy use, minimizing solar radiation, and enhancing thermal comfort and spatial daylight autonomy in office buildings.
By addressing these questions and objectives, this study aims to fill the research gap in optimizing atrium skylights and daylighting in hot, dry climates. The findings will inform sustainable building design in Yazd and similar regions.
2.1. Daylight and thermal comfort simulation
2.1.1. Annual sunlight exposure (ASE)
As a complement to sDA, ASE measures annual sunlight exposure. During the course of the year, it measures the percentage of an analysis area that exceeds a specified direct sunlight illuminance level (e.g., 1000 lux) for more than a specified number of hours. To obtain meaningful results, it's best to use a full year (365 days). It's essential to recognize that ASE cannot provide a definitive assessment of the glare or discomfort you are experiencing. However, it's not foolproof, and its primary purpose is to help designers limit excessive daylight in a space. A space's brightness is measured by ASE, which plays a vital role in determining whether it is overlit. In contrast to sDA, it does not model blinds or shades. Accordingly, ASE1000,250 indicates the percentage of area that exceeds 1000 lux for more than 250 hours per year. Furthermore, this metric may indicate that a space is prone to excessive solar heat gain [74]. ASE was introduced in 2012 by the Illuminating Engineering Society as part of LM-83-12 and measures the percentage of floor area that exceeds a specified level of direct sunlight illumination for a specified number of hours to determine whether direct sunlight can cause visual discomfort. In smaller areas that receive direct sunlight for more than 250 hours per year, the IES recommends a relative value of 1000 lux. Based on supporting research, the standard indicates that there is no clear threshold for this metric [75], The visual comfort of spaces with at least 10% direct sunlight exposure is considered unsatisfactory, spaces with 7% direct sunlight are deemed neutral, and spaces with 3% direct sunlight are considered acceptable [76]. The following: Eq. (1) was applied:
\({AT}_i\) Refers to the frequency at which the illumination occurs. The value of T_iIs the absolute threshold for that measurement, which represents how many hours are over the ASE threshold at an explicit point (i). N refers to points in a network and indicates a function.
2.1.2. Spatial daylight autonomy (sDA)
To evaluate daylight balance within interiors, various metrics are typically assessed using mathematical formulas, including Daylight Illuminance (DI), Daylight Coefficient (DC), and Daylight Autonomy (DA). The role of architects and engineers in this process is crucial. DA is a measurement of the percentage of time a space relies solely on natural light to meet its lux requirements [77]. There are various ways of calculating DA, including monthly, quarterly, or periodic durations. Calculating DA requires determining hourly illuminance values for an entire year at a given location. Illuminance levels between 100 and 2000 lux are considered optimal. It is considered extremely dark when a space receives less than 100 lux, while it is considered extremely bright when a space receives more than 2000 lux. A UDI of 100-2000 lux is used in this analysis as a daylight standard because it has been proven to be the most accurate measure of daylight [78–79]. The DA helps architects estimate the potential energy savings from artificial lighting by measuring how effectively light penetrates a space. As a result, when spaces are exposed to excessive sunlight, DA fails to establish an upper limit for daylight illuminance, putting visual comfort at risk [79]. In accordance with dynamic climate data, credit is awarded when illuminance is greater than the specified threshold for a specific period [80].
sDA stands for Spatial Daylight Autonomy [81]. During at least 50% of the annual hours that the space is occupied, a minimum of 300 lux must be achieved on the floor area. The vision simulator defines the working area, but the overall space is typically considered when analyzing the data. Imagine a network of N points with a function S.T. (i). Each point has the function S.T. (i). The function, S.T. (i), is involved in calculating sDA because it determines the minimum amount of data to be used. Time spent in illumination Exceeds the specified portion. Eq. (2) represents the calculation of sDA [81].
2.1.3. Daylight glare probability (DGP)
The term "Daylight Glare Probability" (DGP), which expresses the probability of daylight in the scene, was first used by Wienold and Christoffersen [82]. The discomfort glare formula for daylighting incorporates both the glare source and the sky's brightness distribution. As a result, the Daylight Glare Probability (DGP) offers a more comprehensive prediction of glare compared to other indices, such as the Daylight Glare Index (DGI), because it considers a broader range of factors that influence visual discomfort [83]. The formula is presented in Eq. (3).
\(E_v\): The vertical illuminance at the observer’s eye (Lux).
\(L_s\): The luminance of the glare source at time t (cd⁄m).
\(\omega_s\): The solid angle subtended by the glare source at the observer’s eye at time t.
\(P_t\): The Guth position index at time t.
daylight metric for evaluating the quality of natural lighting [84]. This study’s evaluation criteria were based on Wienold’s proposed DGP evaluation method [85]. Four DGP thresholds were utilized to perform a dynamic analysis of DGP throughout the year: imperceptible glare (DGP<0.35), perceptible glare (0.35≤DGP<0.4), disturbing glare (0.4≤DGP<0.45), and intolerable glare (DGP≥0.45) [86].
2.1.4. Predicted mean vote (PMV)
According to Fanger, who developed the influential heat balance model of thermal comfort [87] Thermal comfort occurs when skin temperature and sweating are within specific, limited ranges. Based on theoretical models of how the human body exchanges heat with its surroundings, international standards for defining comfortable indoor thermal environments have been developed [87]. Experiments conducted in climate-controlled labs or chambers have rigorously validated these models, including Fanger's Predicted Mean Vote (PMV) model. These models meet the ISO 7730 standard, which proves their accuracy and reliability. In accordance with the ASHRAE scale, the PMV model [88], a cornerstone of thermal comfort research, provides numerical values that indicate how people perceive their surroundings. As part of this calculation, six key factors are considered: metabolic rate (M), clothing insulation (Icl), air temperature (ta), mean radiant temperature (tr), water vapor pressure (pa), and air velocity (var) [89]. PMV is based on research conducted at Kansas State University and the Technical University of Denmark in the 1960s. Buildings with natural ventilation, as well as air-conditioned ones, can have PMV values. However, variations in air-conditioned buildings are usually less noticeable, as the environment in these buildings is more controlled in terms of the range of conditions that can be measured. Equations [90]. Table 2 illustrates the ASHRAE comfort scale [14], which assesses indoor thermal comfort based on temperature, humidity, air velocity, and physical activity. PMV is represented by Eqs. (4) to (10).
Table 2
![The ASHRAE comfort scale [14].](figures/12-520-10.jpg)
Table 2. The ASHRAE comfort scale [14].
Table 3 illustrates the PMV (Predicted Mean Vote) Factors [93], which outlines the key variables influencing thermal comfort, including air temperature, radiant temperature, air velocity, humidity, clothing insulation, and metabolic rate.
Table 3
![PMV Factors [14].](figures/12-520-11.jpg)
Table 3. PMV Factors [14].
2.2. Multi-objective optimization (MOO)
Multiple-objective optimization provides profitable options among single and multiple environmental performance models by measuring the amount of daylight accessible inside and outside a structure. As a result of the building optimization approach, previously opposite goals, such as studying energy and daylight, can be reconciled, and the practical implications of this approach are broad. The importance of this research in terms of architecture, environmental design, and energy efficiency cannot be overstated. Zhai [91] A team of researchers utilized NSGA-II to optimize window-related design factors, including energy consumption, thermal comfort, and visual comfort. Based on the Pareto Set, which describes a multi-objective optimization problem, the results were visualized using a graphical representation, because of a horizontal surface that reflects sunlight inside the workspace, as described by Cheong et al. [90] Maximized the benefits of thermal comfort and daylighting inside a modern workplace. It is necessary to install a lighting sensor in the structure to control energy savings from daylighting. Simulating the performance of buildings is the basis for the approach. It is necessary to develop a daylighting scheme annually. As part of the energy model, electric lights are monitored, temperatures are maintained, and daylighting demand is adjusted. A comprehensive explanation of the methods is provided by Marzouk et al. [22] And Ylmaz et al. [92]. These review literature studies have demonstrated that increasing the usable daylight in buildings has a significant impact on energy efficiency and visual comfort, highlighting the accuracy and sensitivity of investigations in this area and their practical relevance to building design. To achieve non-dominated solutions (Pareto Optimal), a Non-dominated Sorting Genetic Algorithm (NSGA-II) is proposed. Using this algorithm, multi-objective optimization problems can be efficiently solved. In this case, none of the solutions is better than the others across all objectives, unless the performance of one objective is compromised to improve the performance of another. The following Eq. (11) is for multi-objective optimization [93]:
If any objective is to be increased, it corresponds to reducing its adverse effects. Y represents the concept of X. \(\in\ R^n\). A component \((\rightarrow_x)\in\ X\ \) A feasible solution is referred to as the objective vector.
\((\rightarrow_z){\colon=}\ \rightarrow_f(\rightarrow_x)\in\ R^n\) Pareto optimal solutions \(\rightarrow_x\)Hose that cannot be improved in any objective without degrading the performance of at least one other objective. Solutions that cannot be improved in any of the objectives, unless at least one of the others is reduced, are referred to \(\rightarrow_{x1}\in\ X\). Start as Pareto optimal solutions if: \(\rightarrow_{x2}\in\ X\), according to the following Eq. (12):
To provide architects with optimal choices for addressing unique challenges, an effective search technique is essential for identifying solutions that are balanced along the Pareto front. Table 4 summarizes the findings from several relevant studies.
Table 4
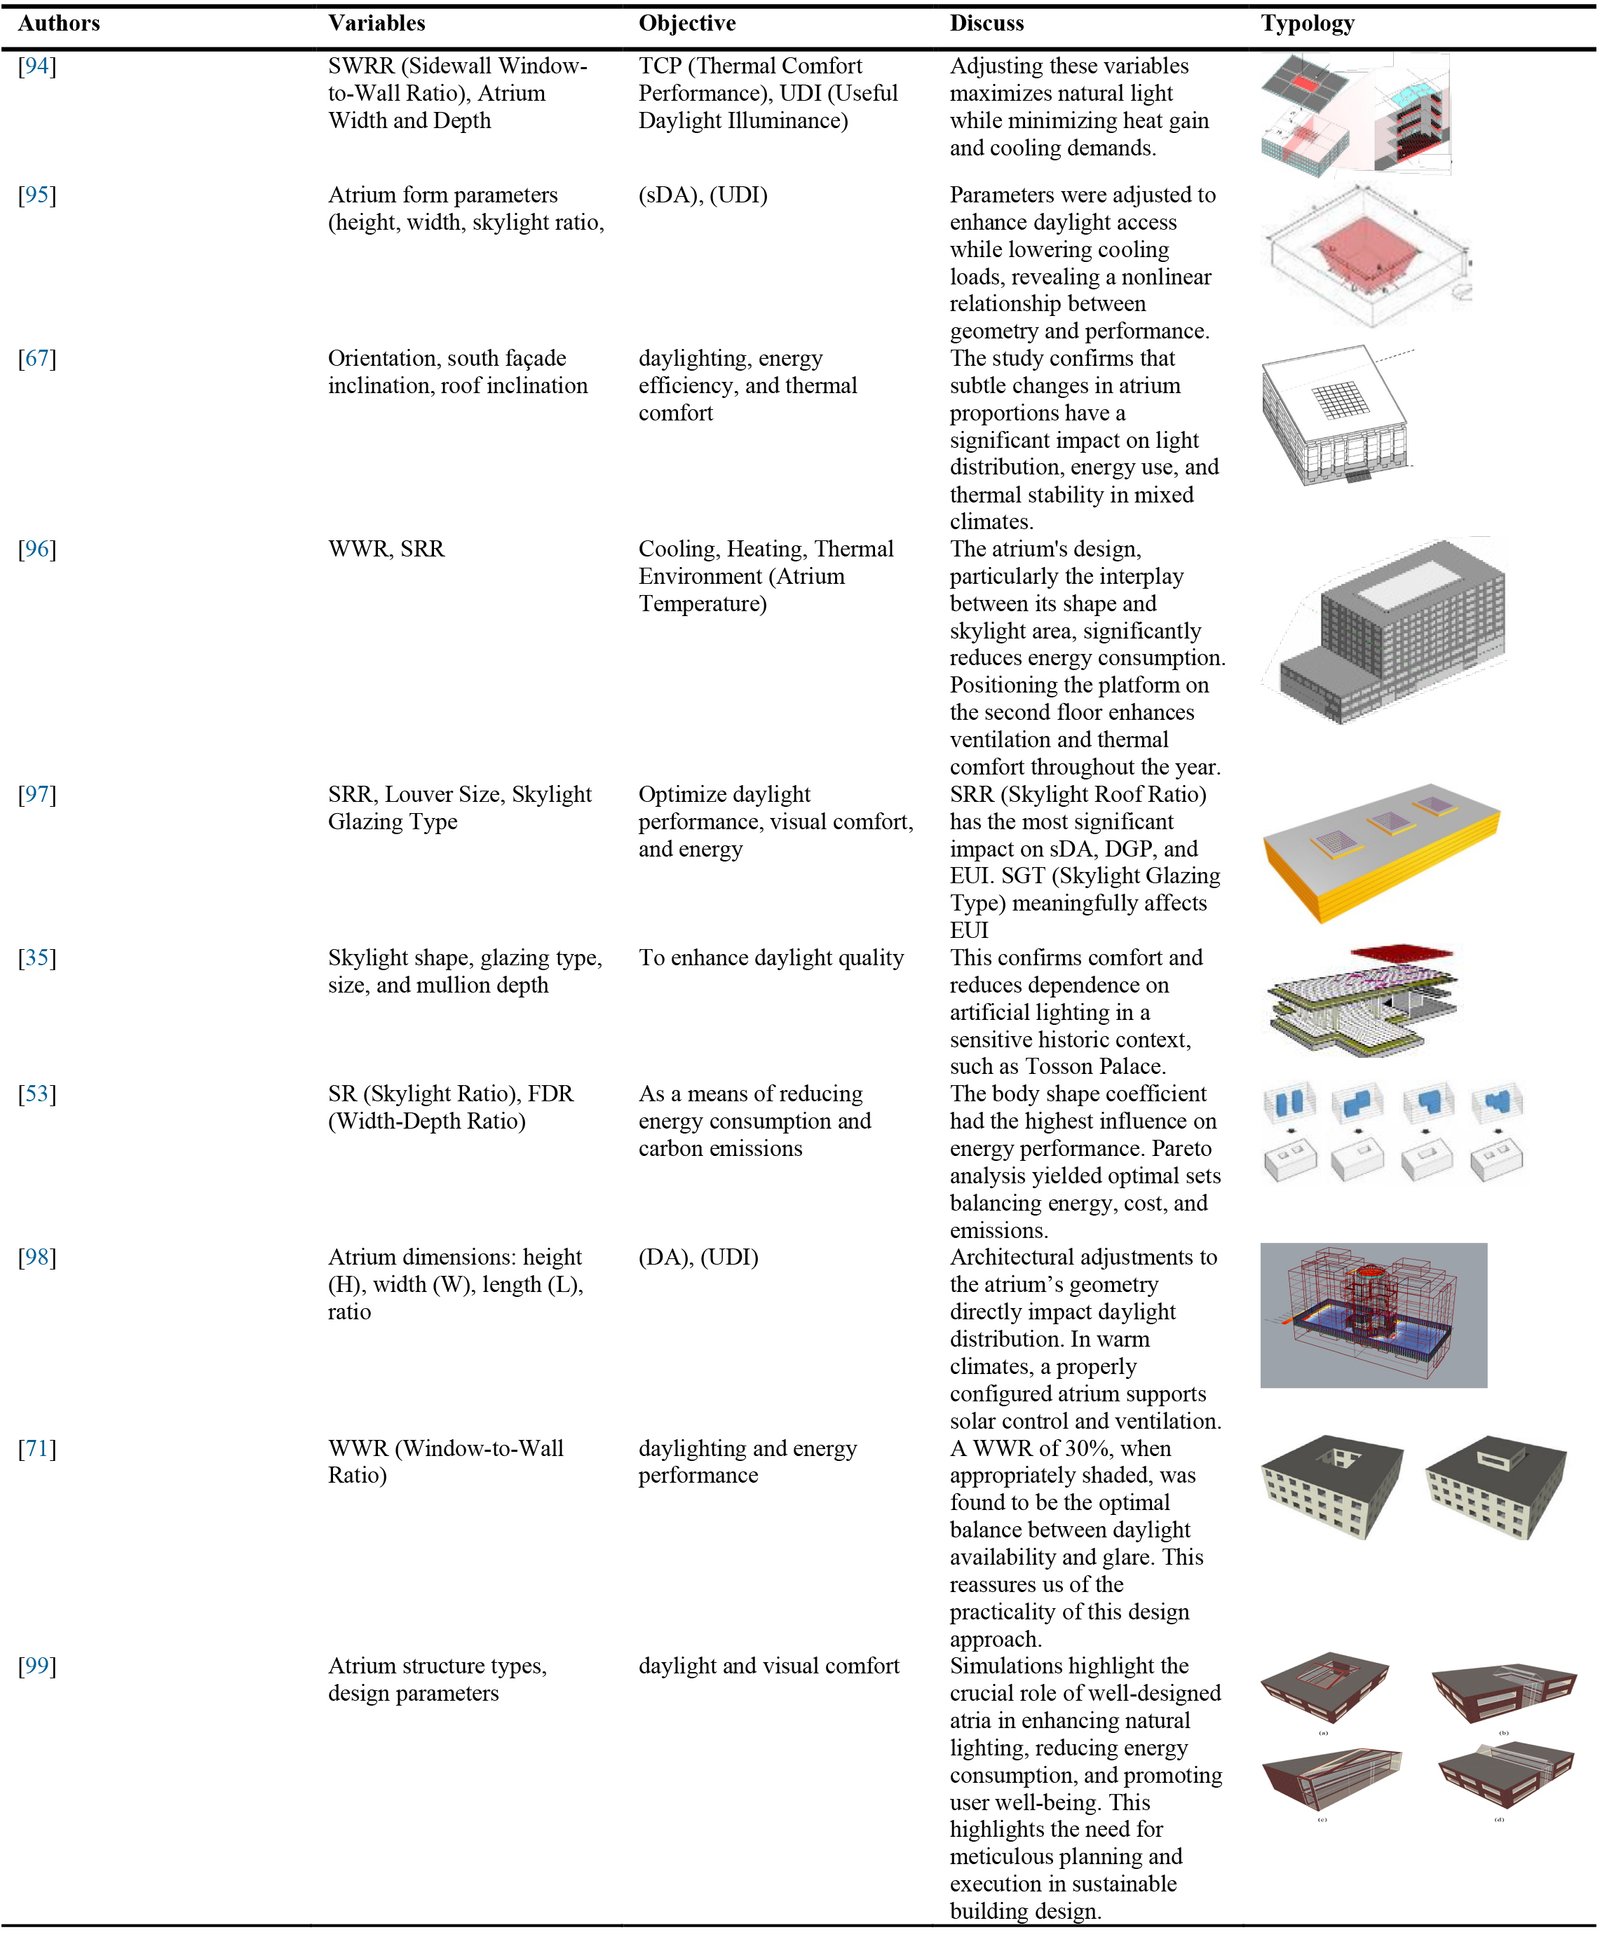
Table 4. Summary of the relevant studies.
In theory, the ideal point would maximize each objective separately. An NSGA-II algorithm is designed to produce well-distributed solutions that closely align with the Pareto optimal front. As a result of optimizing atrium skylight designs, various aspects of energy consumption (heating and cooling), daylight performance (sDA), and Visual comfort (DGP) can be optimized simultaneously. Considering daylight quality, energy demand, and thermal comfort when designing office buildings is crucial, especially in unusual climates like Yazd. Additionally, the NSGA-II algorithm generates a set of Pareto-optimal solutions, allowing architects and engineers to select design solutions tailored to specific project requirements. Wallacei enhances this optimization approach [100], which is an analytical engine for Grasshopper. For better results, it is crucial to evaluate a point set's proximity to the Pareto front, as well as to ensure a diverse selection process. In addition to allowing for lower accuracy, the method also enables the use of non-dominated solutions with Monte Carlo techniques. A research gap led the authors to optimize atrium skylight design in Yazd office buildings, thus enhancing their performance. The use of skylights has been studied in various ways to improve daylight and visual comfort, but most studies treat them as merely light sources. Especially in regions with extreme climatic conditions, such as Yazd, skylight design presents unique challenges. Using this study, a skylight configuration optimization system will be developed for office buildings in Yazd, enhancing daylight reception while minimizing cooling needs. In addressing these issues, the research aims to improve the performance and sustainability of office buildings in hot, arid climates, thereby contributing to a novel approach to sustainability. As shown in Table 5, the NSGA-II algorithm’s parameter configurations include key factors such as elitism, mutation probability, crossover rate, and population size, which play a crucial role in the optimization process.
Table 5
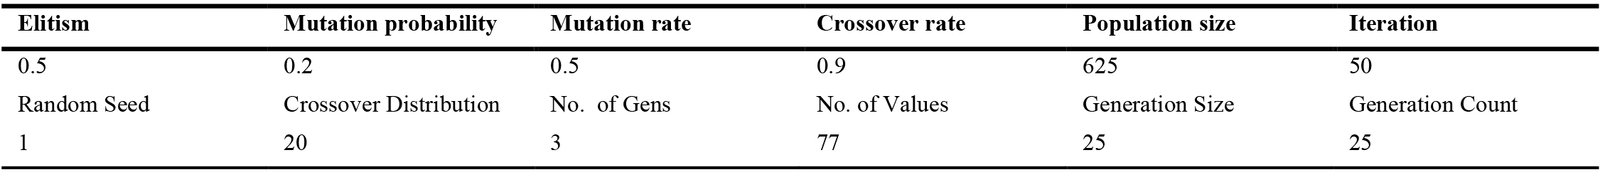
Table 5. The NSGA-II algorithm’s parameter configurations.
The NSGA-II algorithm's parameters are as follows: Elitism is set to 0.5, representing the proportion of the best solutions retained for the next generation. Mutation probability is 0.2, specifying the likelihood of an individual mutating to introduce variation. The mutation rate is 0.5, defining the extent to which a mutated individual changes. Crossover rate is 0.9, indicating the probability of combining two individuals to produce offspring. The population size is 625, reflecting the number of individuals in each generation. Iteration is 50, denoting the total number of evolution steps for optimization. The random seed is set to 1, enabling reproducibility. Crossover distribution is 20, designating how crossover points are distributed. Number of generations is 3, indicating cycles during parent selection and evolution. The number of values is 77, referring to the variables optimized. Generation size is 25, clarifying the number of new individuals evaluated per generation. Generation count is 25, specifying the number of groups of individuals produced and assessed during the algorithm's run.
3. Materials-and-methods
Several atrium geometries were investigated in this study to identify optimal skylight resolutions. The findings of this research contribute to the enhancement of visual comfort, daylight performance, and thermal comfort in office spaces, all of which are crucial design and performance factors. A square configuration was used as a base model, which was then expanded to rectangular forms at ratios of 1.5, 1.75, 2, 2.5, and 3 times its length. To find the best skylight solutions, a rigorous six-stage multi-objective optimization process was undertaken. To comprehensively assess the climatic effects, Honeybee tools were used for thermal comfort simulations and daylight performance simulations, while Ladybug (LBT 1.8.3) was employed for climatic studies. In addition to DGP (Daylight glare probability) in Celsius, Annual Sunlight Exposure (ASE), Spatial Daylight Autonomy (sDA), and PMV (Predicted Mean Vote), these tools provided a comprehensive framework for evaluating how central atrium skylights affect performance, daylight quality, and thermal comfort, in addition to visual comfort. Multi-objective optimization was performed using the Wallacei plugin in accordance with the research process. A thermal comfort objective, daylight quality objective, and visual comfort objective were considered when selecting the solutions. Based on this analysis, six different configurations of atriums were subjected to sensitivity analysis. To evaluate the effectiveness and robustness of the optimization results, a thorough approach was
essential. According to Fig. 1, the Non-Dominated optimization research steps are illustrated.
Figure 1
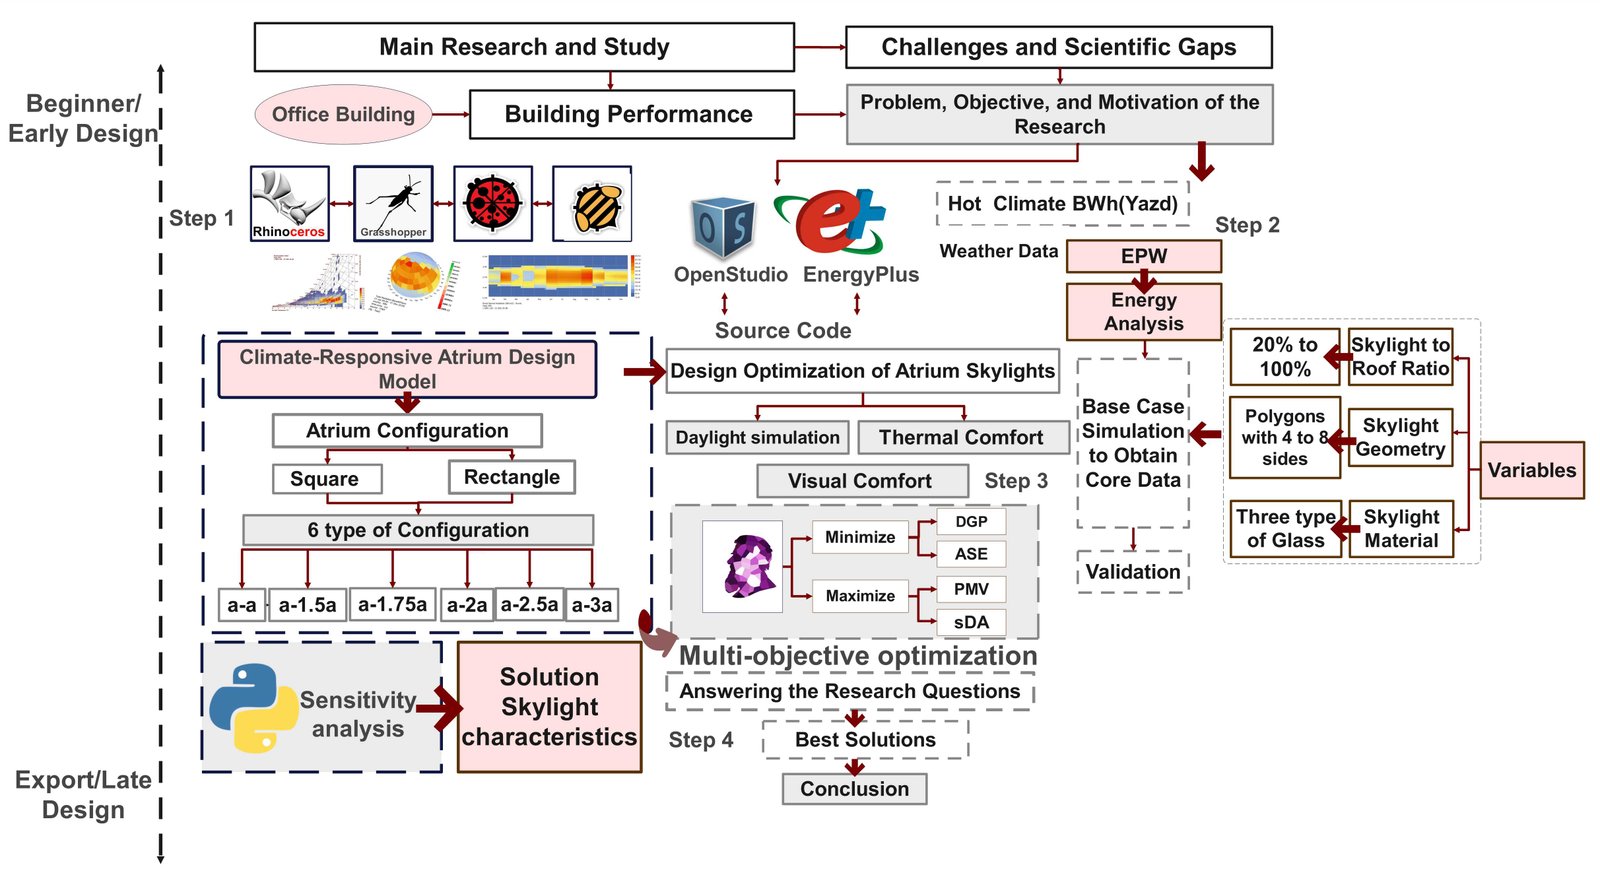
Fig. 1. Research tools.
3.1. Climate analysis of Yazd
A variety of climatic systems influence Yazd throughout the year due to its location in the central part of Iran. Due to its geographic area within the global dry belt, it experiences cold winters and hot, dry summers. As with most desert regions, temperature fluctuations in Yazd are quite significant, even daily. Yazd station, for example, registers an absolute minimum temperature of -3.2°C, and an absolute maximum temperature of 41.28°C. The climate of this region is accurately depicted in Fig. 2, Which Shows the Location of Yazd, in Fig. 3, which presents Yazd's Climate Analysis by using direct normal radiation. The climate in this city is hot and arid, similar to that found in many parts of Iran. It has been reported that 98.2% of the country's area has climates like "Bwh" (35.98%), "BSk" (23.69%), "Csa" (17.03%), "BSh" (15.70%), and "BWk" (5.94%) [101]. This research aims to address daylight quality, thermal comfort, and visual comfort in hot and arid climates, which may also be helpful to others working in similar climates worldwide.
Figure 2
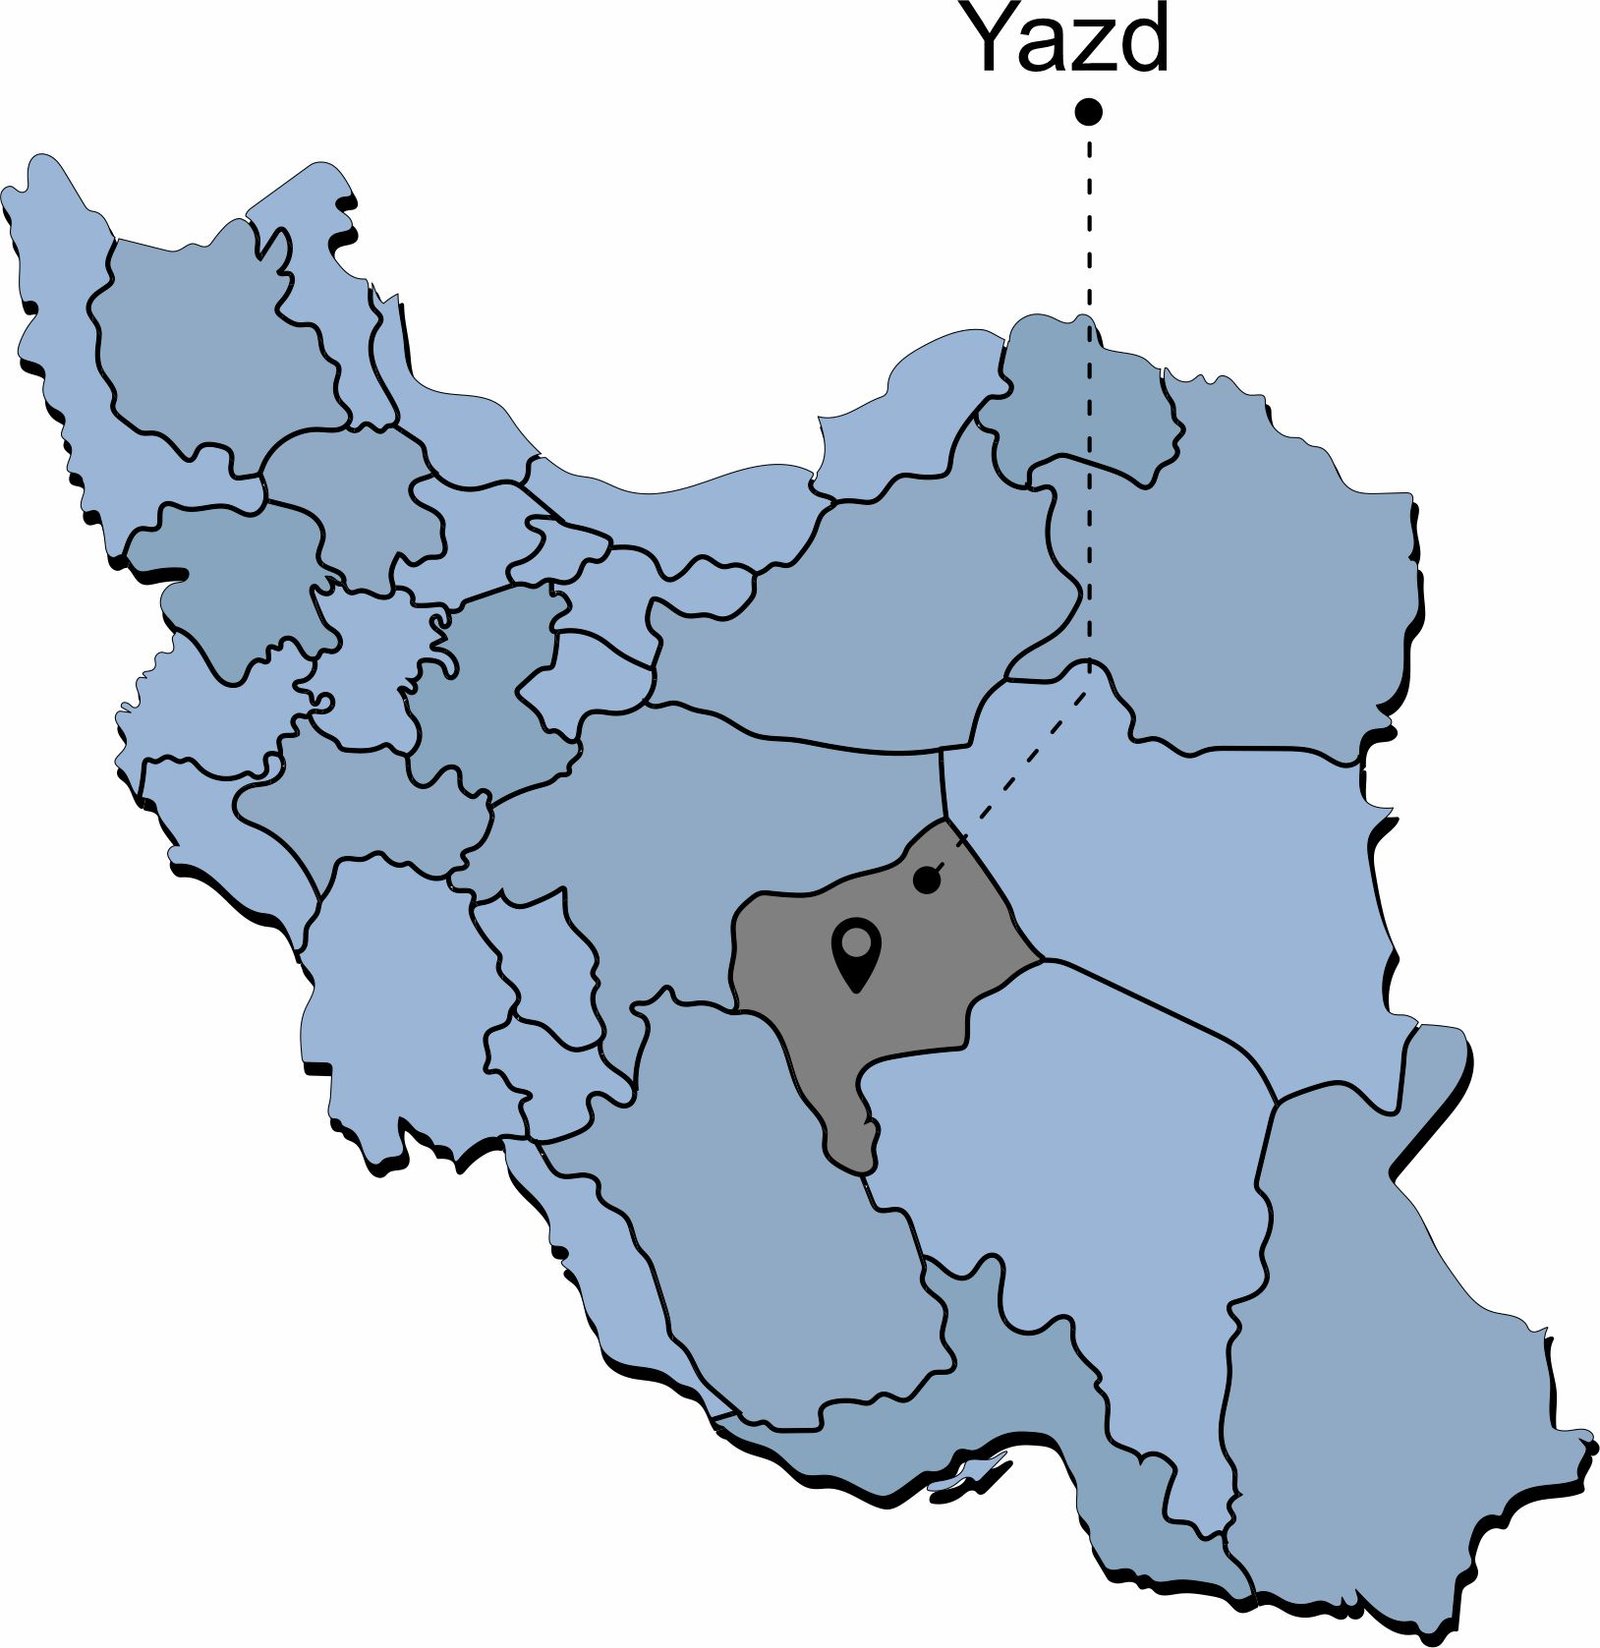
Fig. 2. Location of Yazd.
Figure 3
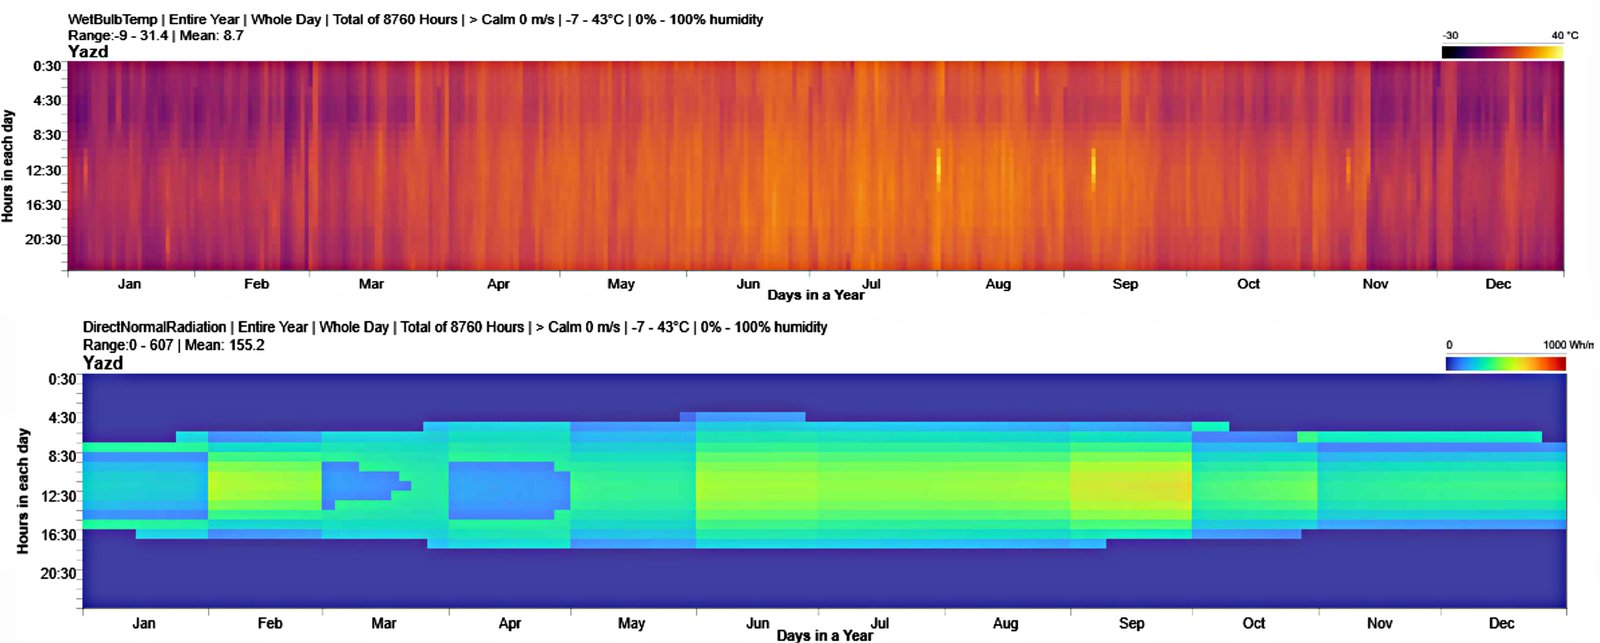
Fig. 3. Meteorological data generated by the Climate Studio plugin, shown from Up to Down: Wet bulb Temperature and Direct Normal Radiation.
Table 6 shows the climate parameters in Yazd. also, Yazd experiences significant variations in thermal comfort throughout the year. In spring, around 598 hours (27.1% of the month) are comfortable. In summer, despite high temperatures, 578 hours (26.2%) offer some comfort. Winter also has 578 hours (26.2%) of comfort due to cooler temperatures.
Table 6
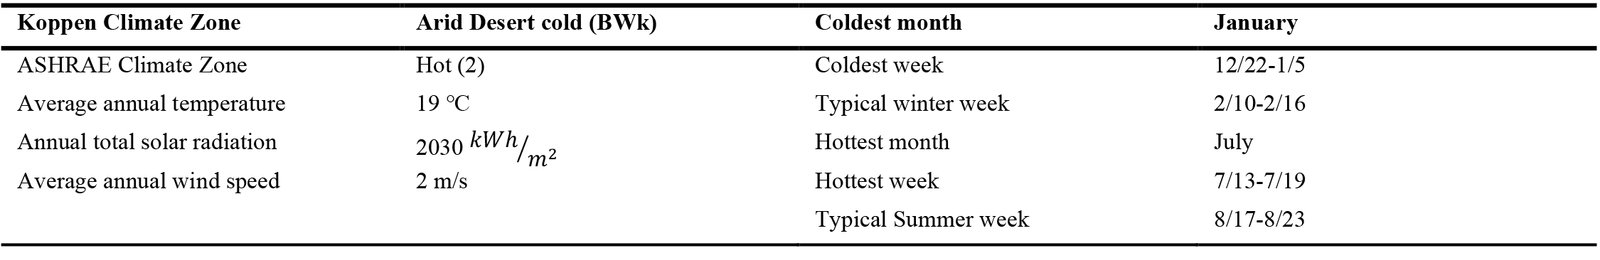
Table 6. The climate parameters in Yazd.
Autumn is the least comfortable, with only 546 hours (25.0%) of the year. Overall, thermal comfort fluctuates across the seasons, with autumn seeing fewer comfortable hours (Fig. 4). According to Table 7, the average, minimum, and maximum temperatures of Yazd are shown.
Figure 4
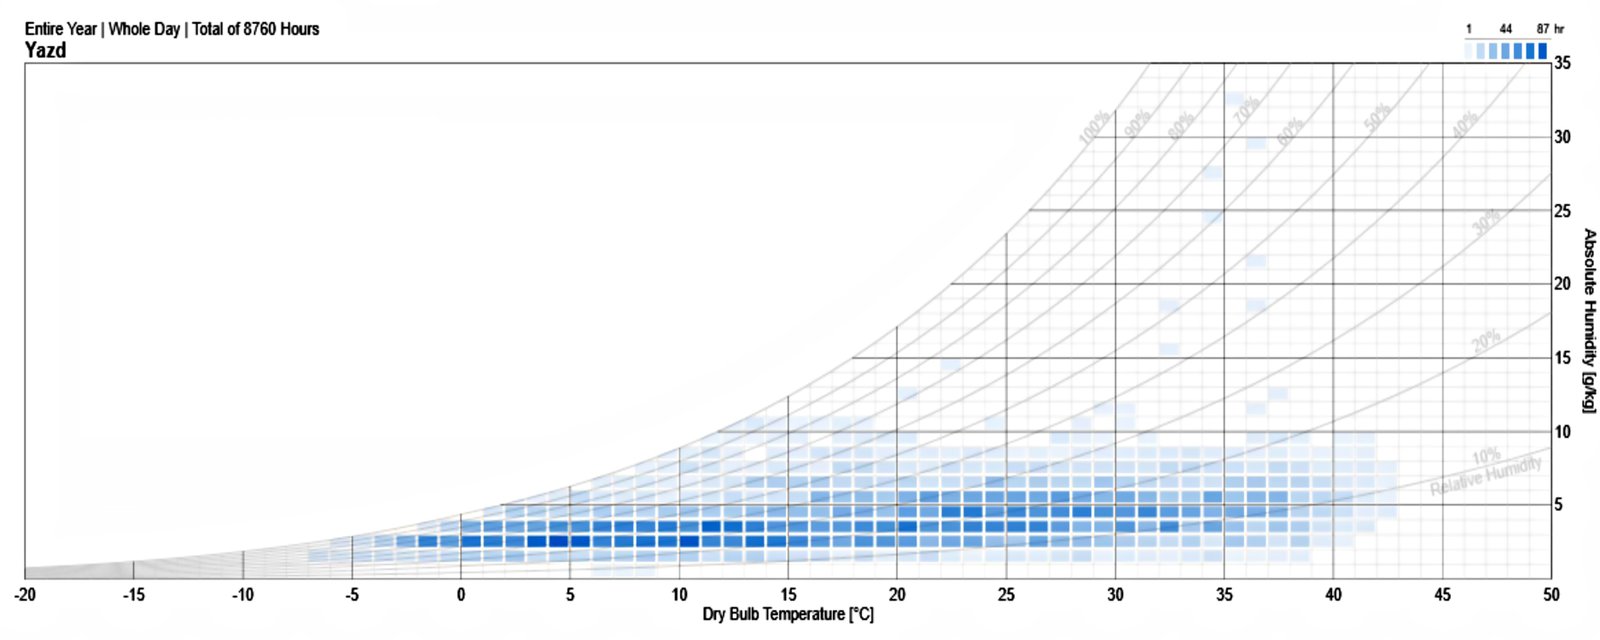
Fig. 4. Psychrometric Chart in Yazd.
Table 7
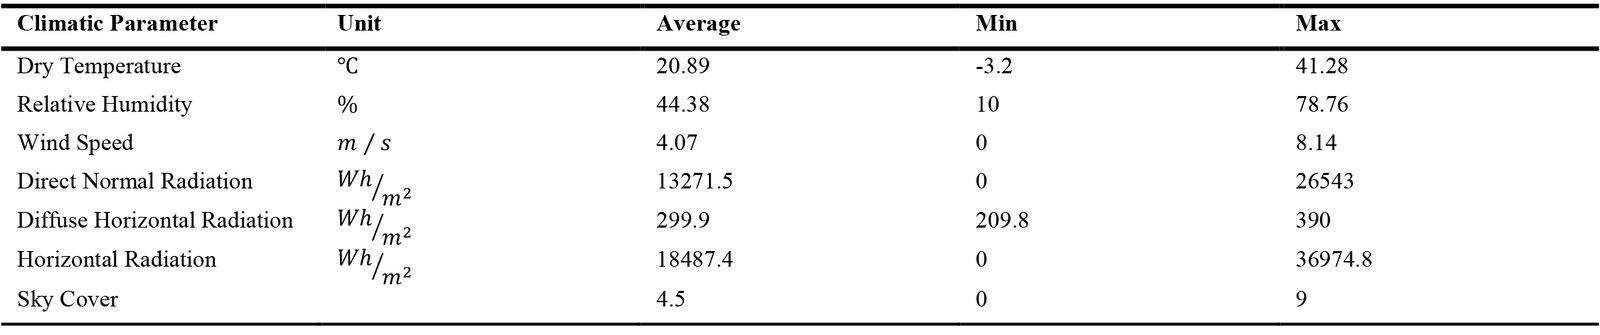
Table 7. The summery of Yazd climate.
3.2. Base model features
According to Table 8, the study was conducted on one floor of an office building, where the default room dimensions were 5 meters long, 5 meters wide, and 3 meters high. The atrium is assumed to be located slightly above the office space at the top of the building. Ceilings on each floor are 25 centimeters thick, and window frames in all rooms are 25 centimeters thick.
Table 8
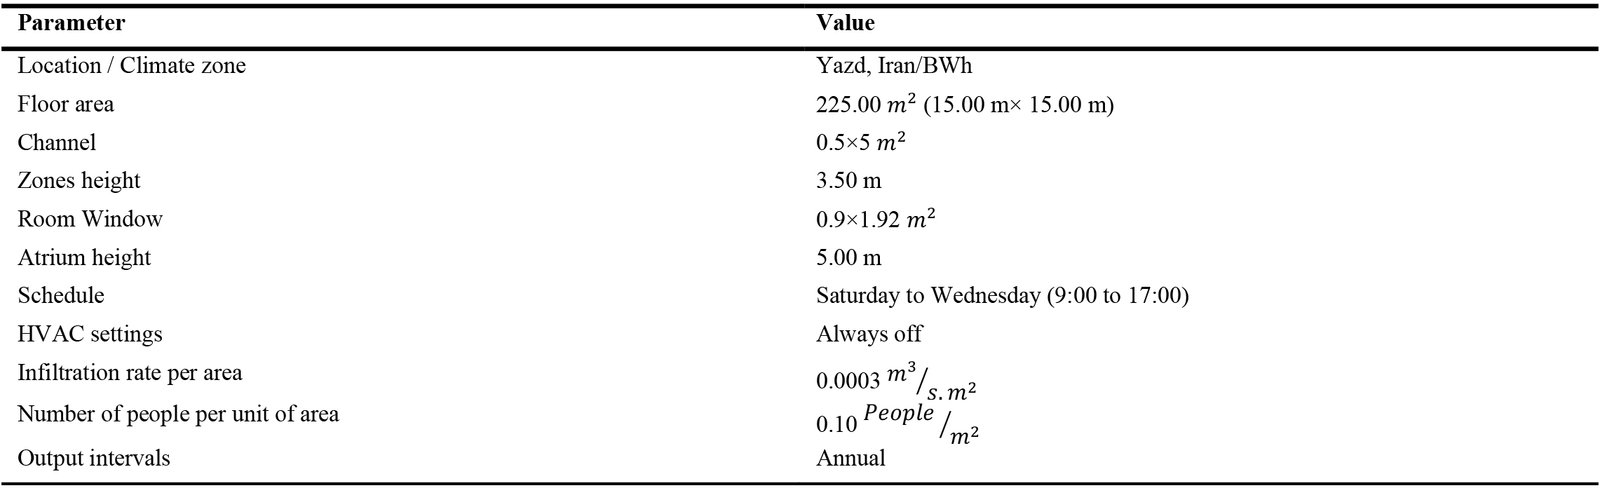
Table 8. Values during the simulation.
According to ASHRAE standards, the proportion of window openings to facade area of the office rooms in the main building facade is 40% [102]. Atrium windows are usually open by default, allowing natural ventilation to exit through the atrium windows with no HVAC systems running. In Table 9, the model's materials are listed.
Table 9
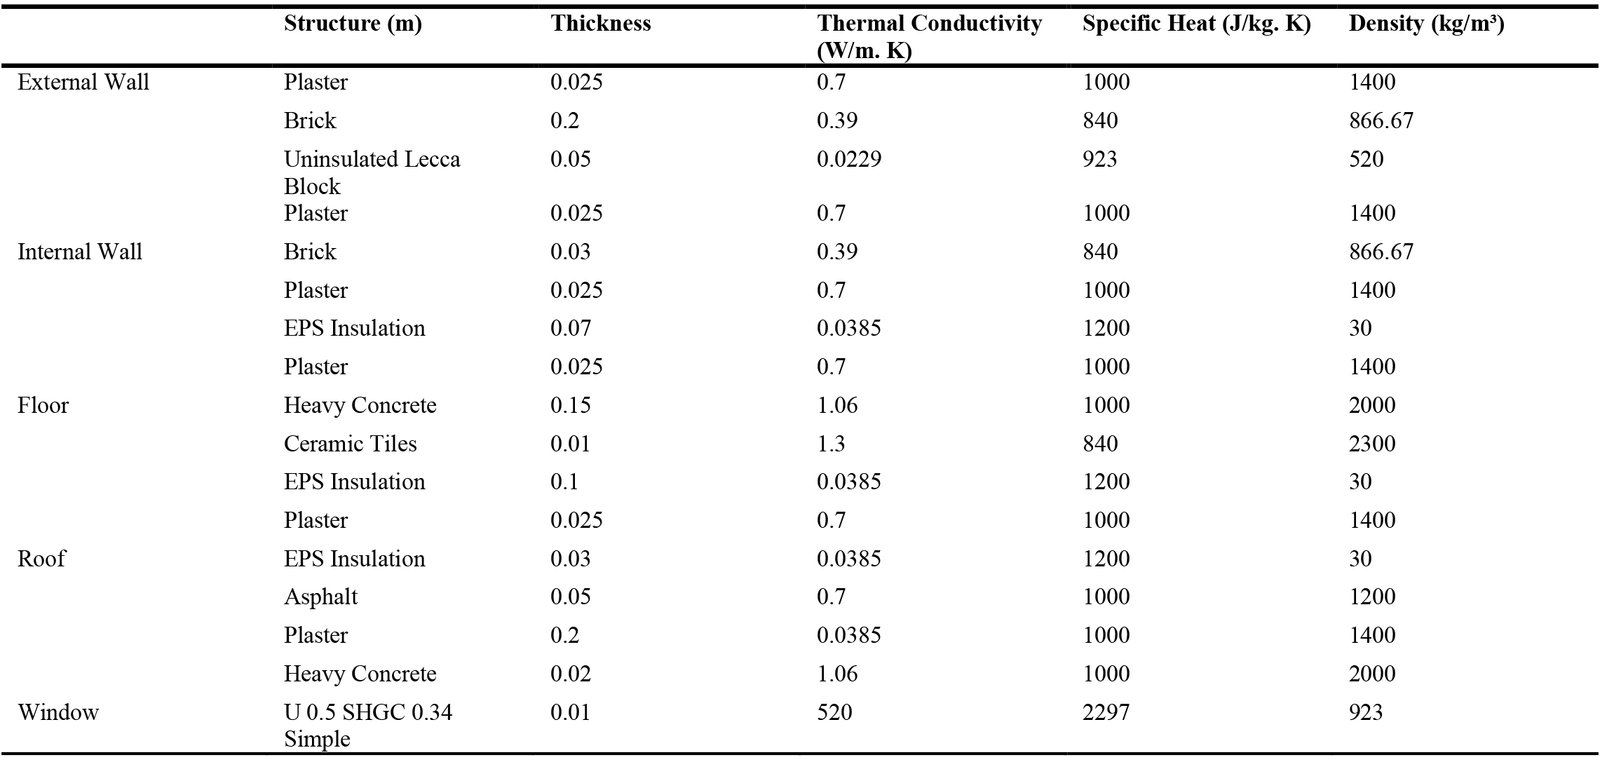
Table 9. The model's materials.
The study employs 5x5 modules, each divided into nine equal sections, with a central atrium. In winter, the model focuses on heat retention and minimizing heat loss. Convective currents transfer warm air downward, reducing the intake of cold air. The configuration of the openings distributes heat evenly throughout the interior, preventing accumulation on upper floors. As a result, reliance on heating systems decreases and overall thermal efficiency increases. In this study, an indirect connection model is used for the central atrium. Fig. 5 depicts the thermal performance of the atrium via indirect channel connections during both warm and cold seasons.
Figure 5
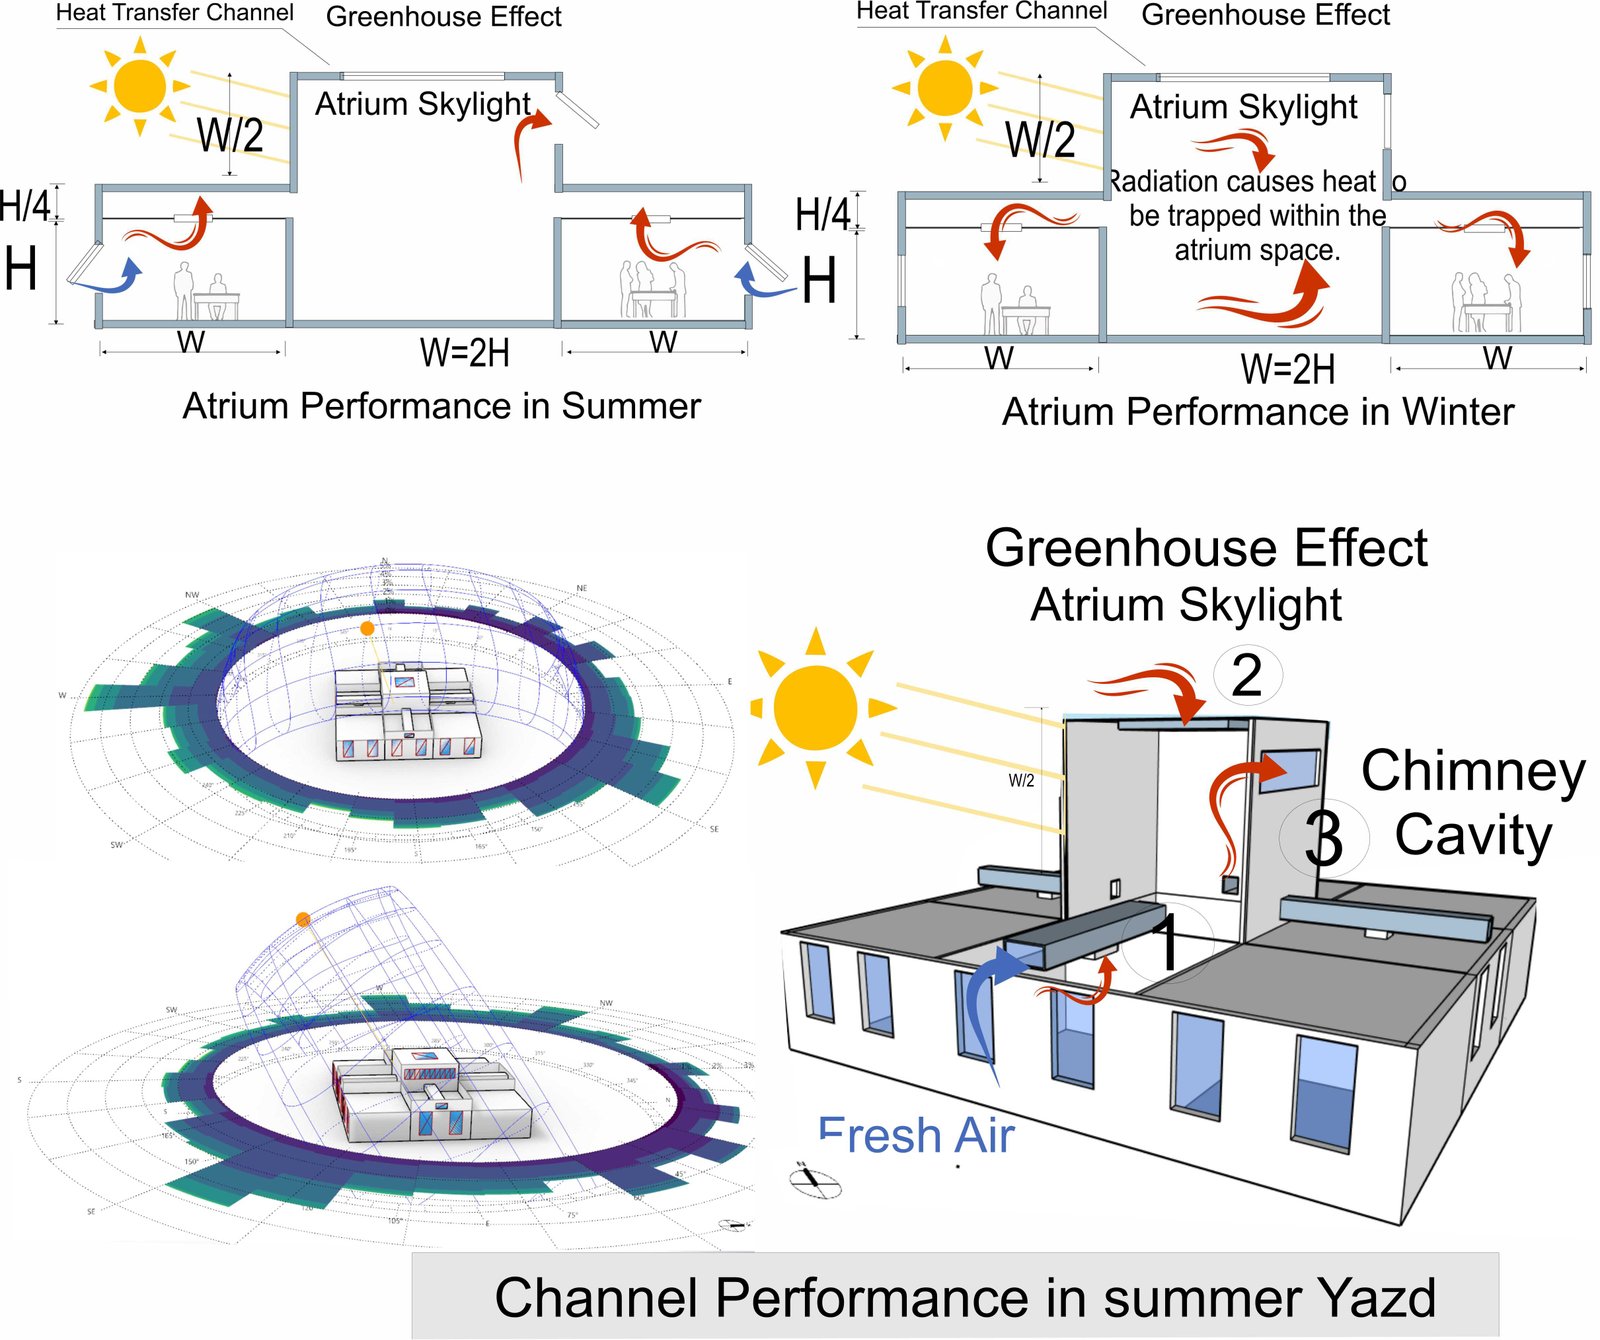
Fig. 5. The Base Model thermal performance.
By designing this way, air and thermal energy can flow freely between the two rooms without interfering with each other directly. In addition to promoting natural ventilation which refers to the movement of fresh air through a building without the use of mechanical devices the channel also regulates temperature. The atrium and office zones have different air pressures and temperatures. By improving both thermal comfort and airflow, the indirect connection enhances the building's energy efficiency. Maintaining an optimal indoor climate can be achieved by reducing reliance on mechanical HVAC (Heating, Ventilation, and Air Conditioning) systems. An indirect connection between the atrium and office zones is provided by a channel, as shown in Fig. 6. In this context, a channel refers to a dedicated air passageway between spaces.
Figure 6
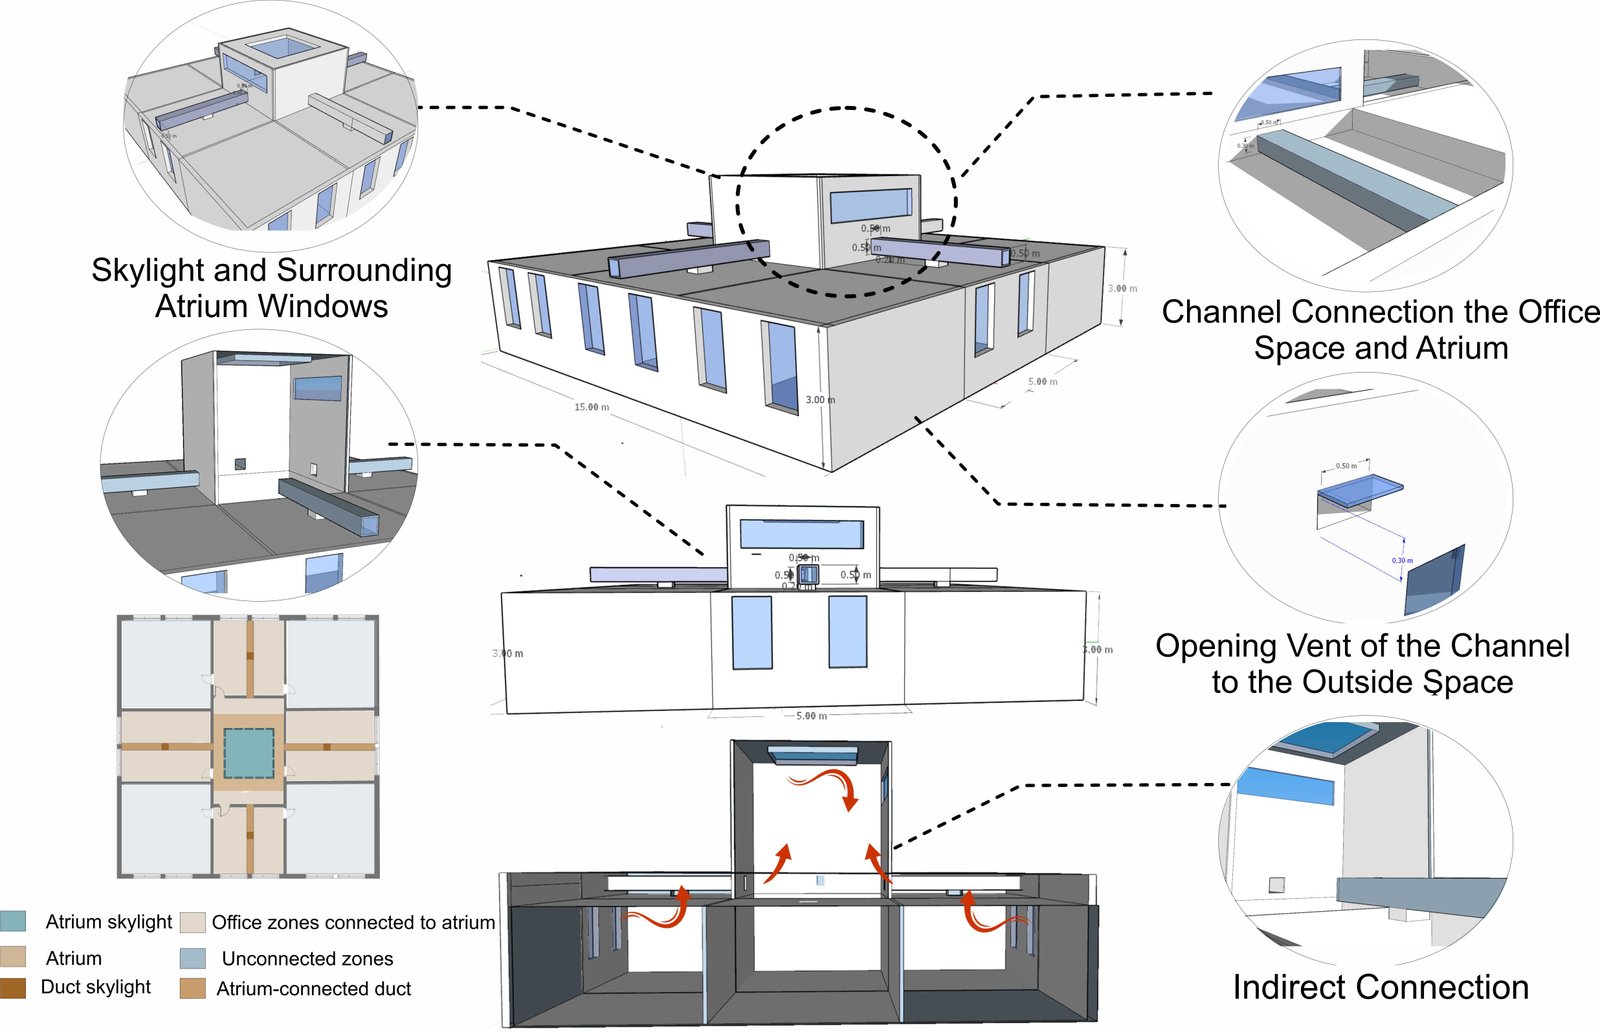
Fig. 6. The base model geometry.
3.3. Atrium geometric configuration
To create five new shapes for the atrium, we started with a base design where the length and width are equal. Because the atrium requires constant sunlight, it should be oriented east to west to receive the sun throughout the day. So, we take the square base and make it longer. The new length-to-width ratios are chosen based on the design. In the first new shape, called "a-1.5a," we make the base model longer by adding two sections on each side. This grid measures 5 meters by 5 meters, with each module being 1 meter. For the "a-1.5a" configuration, one module is added to each side of the base, resulting in a total of two modules added in the east-west direction. For the "a-1.75a" configuration, 1.5 modules are added to each side. In the "a-2a" configuration, two modules are added to each side. For the "a-2.5a" configuration, 2.5 modules are added to each side. Finally, in the "a-3a" configuration, three modules are added to each side, resulting in a length-to-width ratio three times that of the original base configuration.
Figure 7 illustrates that the base model geometry is square. The research model is subdivided into nine equal modules. A channel connects the atrium to its adjacent space through the roof, which enhances the atrium's performance. The baseline model includes a central atrium and four interconnected spaces, designed to optimize visual comfort, daylight availability, and thermal comfort. Adjacent spaces are incorporated to complete the square geometry, enabling a more accurate simulation, as shown in Table 10.
Figure 7
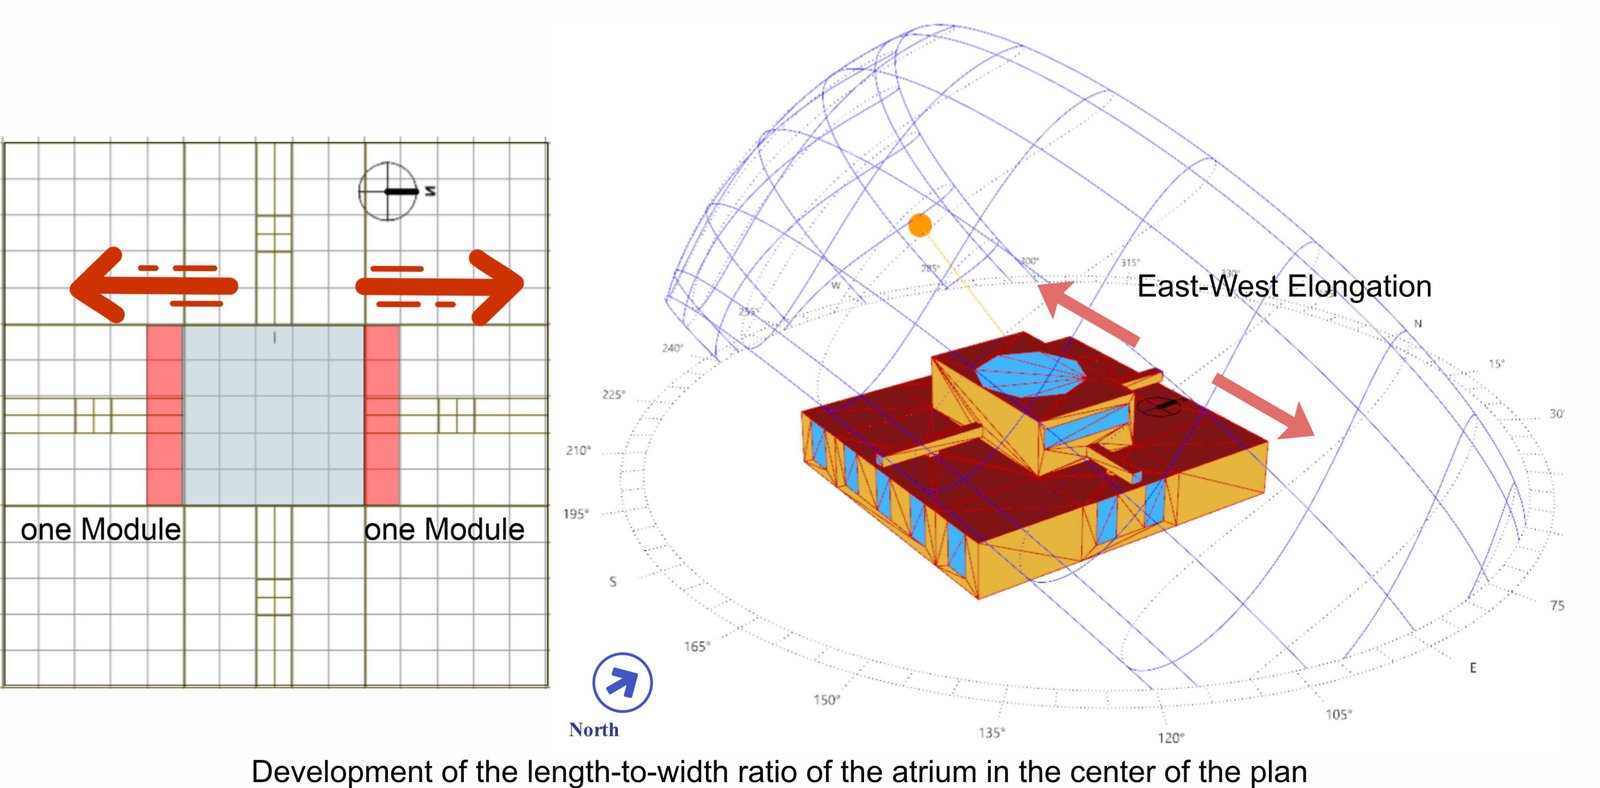
Fig. 7. Atrium Configuration Development.
Table 10
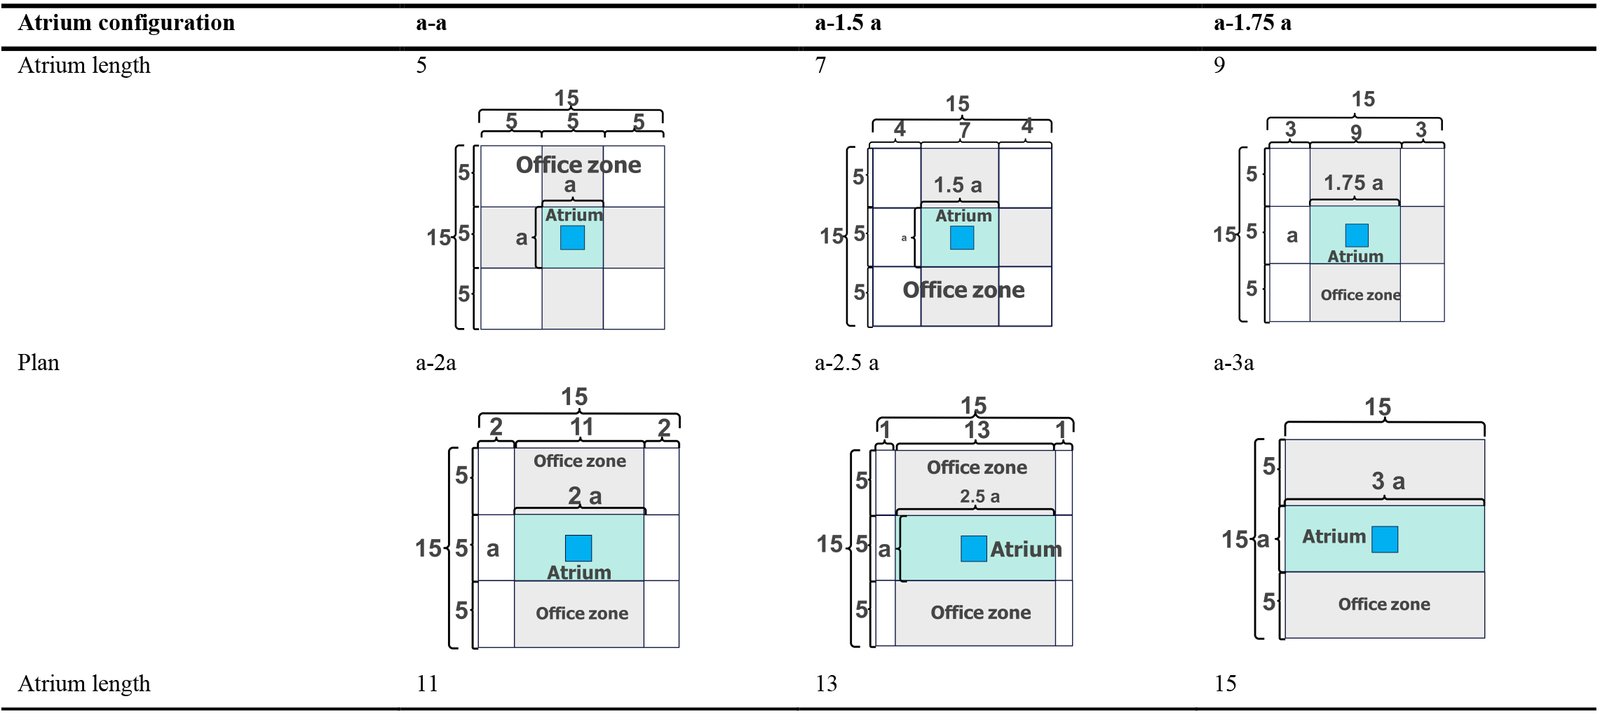
Table 10. Atrium geometric Configuration in this study.
To enhance architectural design and performance analysis, glare levels, measured by Annual Sunlight Exposure (ASE) and Daylight Glare Probability (DGP), should be minimized, while Predicted Mean Vote (PMV) and spatial Daylight Autonomy (sDA) values should be maximized.
3.4. Multi-objective optimization parameters
Optimization is the process of identifying the most effective solution(s) that satisfy specific criteria or constraints. Based on the defined goals and limitations, methodologies such as the MOO approach are crucial for selecting solutions that offer optimal performance or efficiency. An optimization process compares and evaluates various alternatives to ensure that the chosen solution is optimal [103,104]. Using the MOO approach, this study aims to identify design options that increase spatial Daylight Autonomy (SDA) values and minimize glare levels (ASE, DGP), which are crucial to improving architectural design and performance analysis. The effect of solar radiation on a building's heating and cooling was considered to enhance the overall solution across all targeted objectives. Showed in Equation (13).
Multi-objective optimization (MOO) involves balancing multiple conflicting objectives simultaneously, adding another layer of complexity to single-objective optimization. A Pareto front is developed, where each solution represents a trade-off between various objectives [105]. Multi-objective optimization is typically defined as a search for solutions across multiple dimensions guided by goals, constraints, and preferences. Multi-objective optimization provides decision-makers with the ability to navigate trade-offs and come up with optimal solutions that accommodate additional conditions and priorities, placing them in control [106]. Using Equation 14 [107–109], A MOO problem is implemented. As shown in Table 11, the characteristics of the skylight in the atrium configuration are provided for optimization purposes.
Atrium skylights were optimized by analyzing three key parameters. The purpose of this was to improve the energy efficiency and performance of office buildings. The skylight geometry, skylight-to-roof ratio (SRR), and skylight glass material are among these parameters.
Table 11
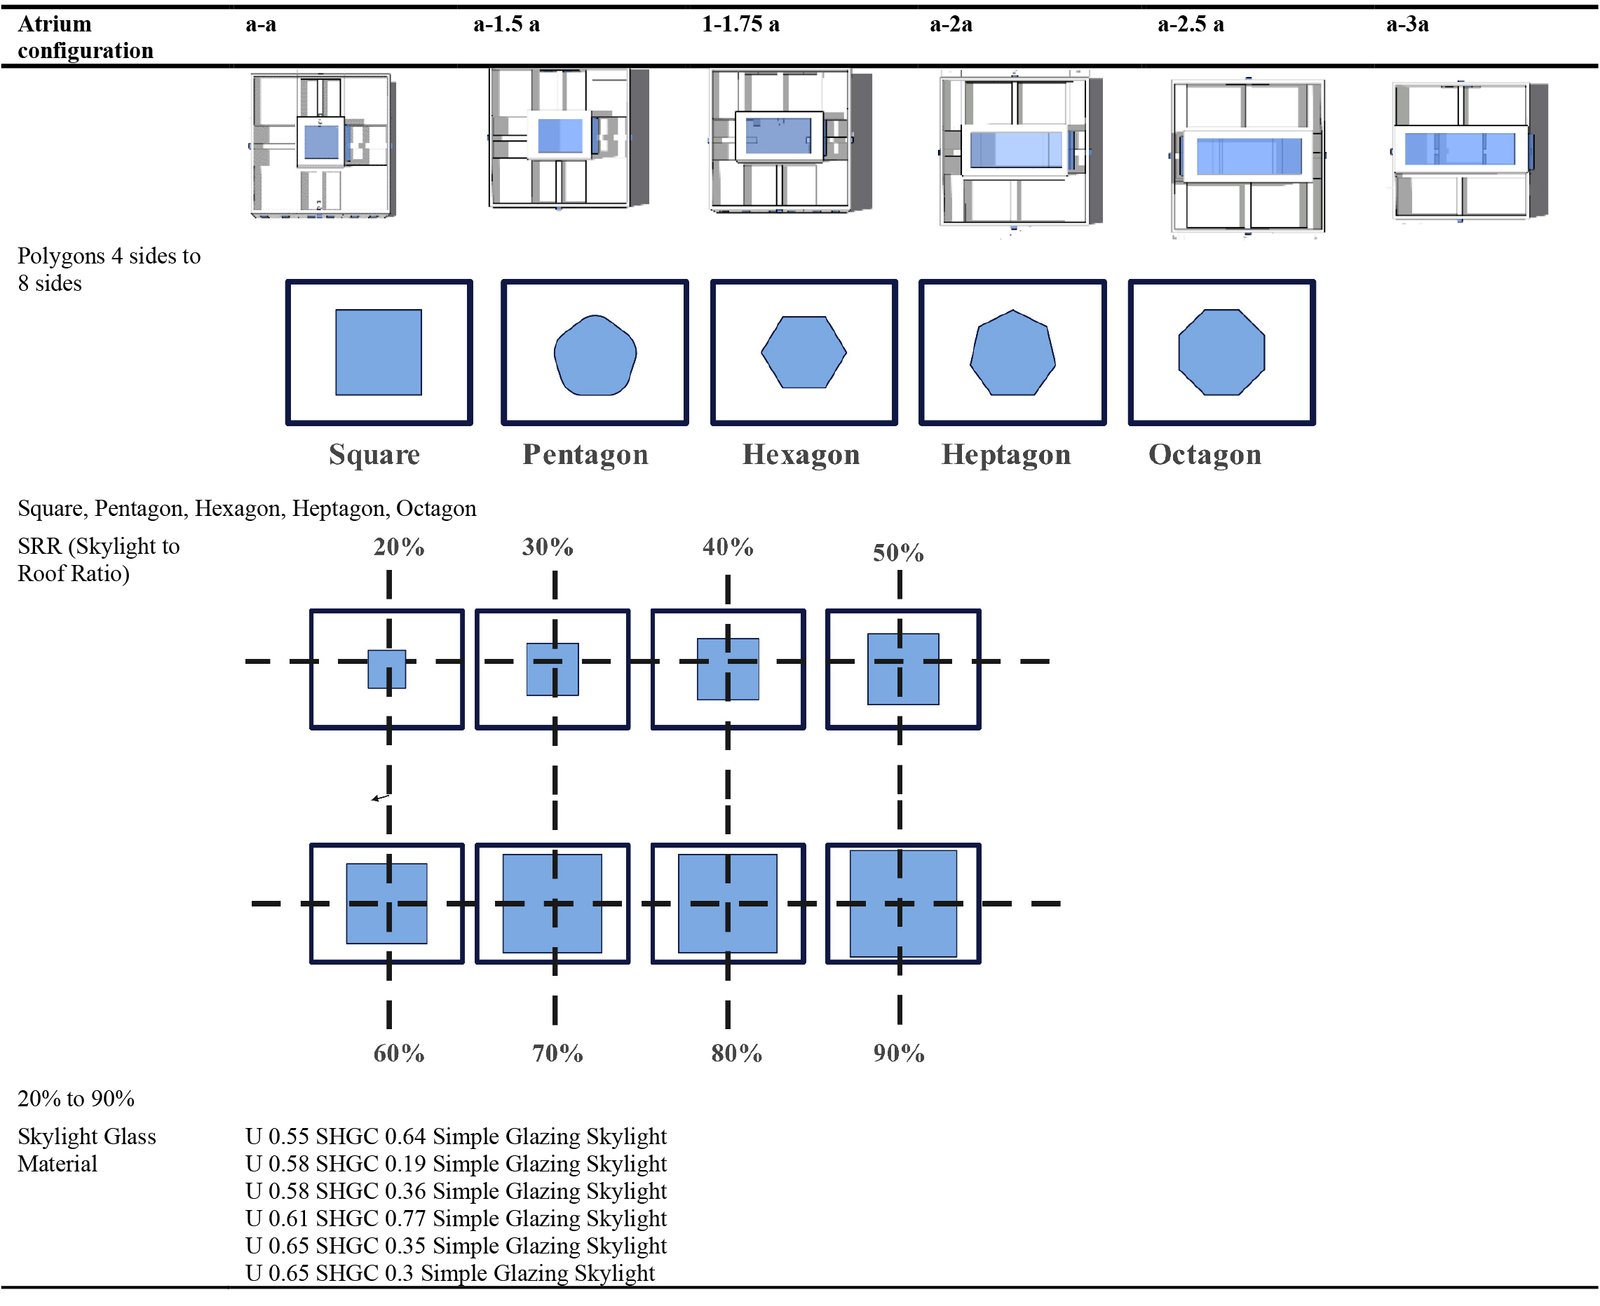
Table 11. Skylight characteristics in Atrium configuration to optimization.
Skylight geometry: The shape or geometry of the skylight plays a critical role in determining how natural light is distributed within the interior spaces and how much energy the building consumes for lighting, heating, and cooling. In this analysis, skylight geometries included polygons with varying numbers of sides: square, pentagon, hexagon, heptagon, and octagon. The number of sides and resulting shape affect how evenly daylight is spread across the space, influencing factors such as daylight levels, potential solar heating, and overall thermal performance. An optimal geometric shape can maximize daylight distribution while minimizing unwanted solar heat gain or loss, thereby enhancing both energy efficiency and occupant comfort.
Skylight-to-Roof Ratio (SRR): The skylight-to-roof ratio (SRR) measures the proportion of a roof's area that is occupied by skylights. Daylighting and solar heat gain through skylights are significantly affected by this ratio. A range of SRR values between 20% and 90% was considered in this study.
- As a result of a low SRR, less daylight enters the building, reducing lighting energy consumption.
- An increased SRR allows more daylight into the building but may lead to overheating indoors. The SRR increases the amount of daylight admitted, which can lead to higher internal temperatures.
Skylight glass material: The properties of skylight glass significantly influence a building's thermal and luminous performance. This study assessed glass types with various Solar Heat Gain Coefficients (SHGC) and U-values.
- U-values measure heat transfer; lower values indicate better insulation. SHGC reflects the amount of solar heat admitted. The glass options studied varied in both aspects.
- Glass types ranged from high insulation/low SHGC to lower insulation/higher SHGC.
- U 0.55 SHGC 0.64 (high thermal property glass)
- (Details on glass specifications omitted for brevity)
These glass variables affect light entry, internal temperature, and thermal comfort, all of which contribute to building energy efficiency. Where, \(x={{(x}_1,x_2,\ldots,x_d)}^T\) represents the vector of decision variables within the search space \(F=R^d\). In addition, (j) indicates the number of inequality constraints, g(x) and the vector of these constraints. As well, "k" refers to the number of equality constraints and h(x) resents their corresponding vectors.
3.5. Software validation
Validation of Honeybee and Ladybug plugins, which are widely used in daylighting simulations, was conducted in this study. A standard lighting analysis tool is operated by these plugins, integrated within the Grasshopper environment [110,111]. Numerous studies have demonstrated the reliability of these tools in different research contexts (Fig. 8).
Figure 8
![Illustrates the assessment of the DF using various tools in the CIE Test Case for a 4-meter by 3-meter unglazed opening [103].](figures/12-520-8.jpg)
Fig. 8. Illustrates the assessment of the DF using various tools in the CIE Test Case for a 4-meter by 3-meter unglazed opening [103].
By comparing Honeybee's results with a recognized benchmark, specifically the CIE 171:2006 Test Cases, this research validated the latest version of Honeybee from Ladybug Tools (1.8.0). Based on this comparison, the simulation results demonstrated high accuracy and alignment with set standards, which have significant implications for daylighting simulations [103]. Additionally, the validation demonstrated the reliability of the parametric workflows used in the study, with minimal errors, indicating the effectiveness of the plugins for daylighting simulations [112,113] This study thoroughly and comprehensively compared the two methods. The simulation results from various programs and workflows were compared to the reference values of the CIE Test Cases. In addition to comparing the results obtained from each lighting program with the CIE Test Cases, these results were also compared with one another. In addition to evaluating the accuracy of the tools through this comparison process, we also analyzed the input and use of boundary parameters through updates of each tool, including Honeybee, which has been updated to version 1.4.0 from version 0.0.65, and Solemma, which has been upgraded to Climate Studio from DIVA [111].
4. Results and findings
A discussion of how the atrium skylight configuration works with respect to materials, skylight-to-roof ratio (SRR), and skylight geometry is presented in this section. This study encompasses six multi-objective optimization stages, ranging from square to rectangular geometries, and considers the selected ratios. Predicted Mean Vote (PMV) and Spatial Daylight Autonomy (sDA) are maximized by minimizing Annual Sunlight Exposure (ASE) and DGP. Utilizing advanced tools such as Ladybug Tools and the Wallacei plugin, along with refined Python programming for visualizing multidimensional data, analyzing data, and comparing results, our research demonstrates a high level of technical expertise. Additionally, in this section, data was analyzed using the Design Explorer A tool. The results of the analysis are summarized in Table 12, which presents a combination of various variables with specific objectives.
Table 12
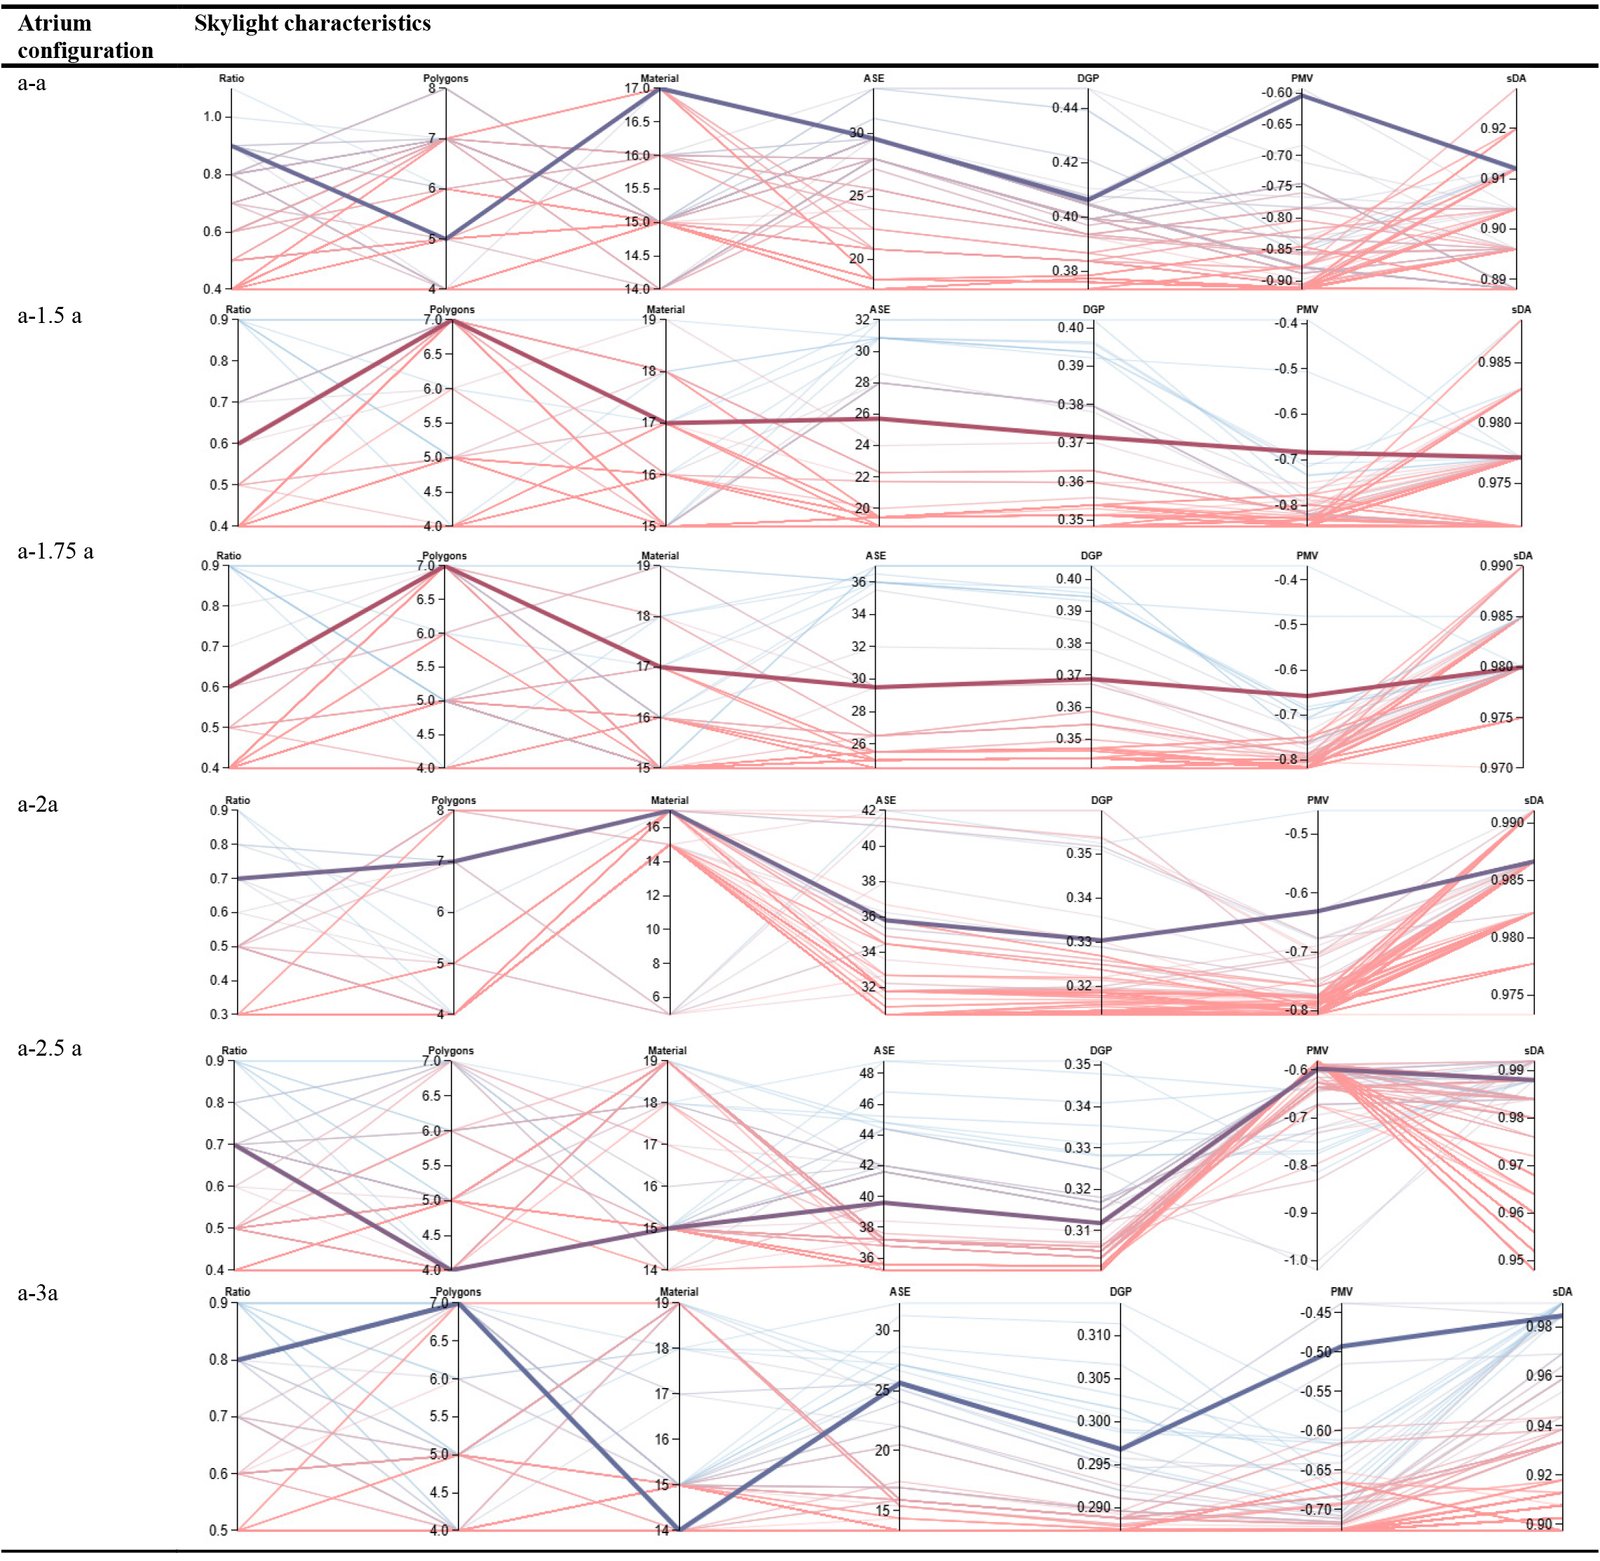
Table 12. A combination of various variables with specific objectives.
PMV Max: Model A-3A with PMV = -0.49 demonstrates the best thermal comfort among all models.
This means occupants experience a consistently comfortable indoor temperature, a key factor for well-being. Model A-3A stands out for consistently providing an optimal thermal environment.
sDA Max: Models A-2.5A (98.8%) and A-3A (98.4%) achieve the highest Spatial Daylight Autonomy (sDA), ensuring excellent natural lighting throughout the space. This supports a uniformly bright environment and significantly reduces the need for artificial lighting. Model A-2.5A has a negligible sDA advantage over A-3A for maximizing daylight.
ASE Min: Model A-1.5A with ASE = 25.71% achieves the lowest Annual Sunlight Exposure (ASE), offering the best protection against excess solar gain and potential overheating. This model is ideal in situations where regulating internal heat and preventing discomfort due to overexposure are key requirements.
DGP Min: Model A-3A with DGP = 29.6% provides the best control of glare, reducing the likelihood of visual discomfort for occupants. This model is ideal for maintaining visual comfort, where minimizing glare is a top priority.
By balancing all four objectives (PMV, sDA, ASE, and DGP), Model A-3A is the optimal choice for both thermal and visual comfort, excelling in PMV and DGP, and performing strongly in sDA. Model A-1.5A is preferable if the primary design goals are to maximize daylight autonomy and minimize solar gain, as it excels in ASE and sDA, though it is slightly less effective in thermal comfort and glare control. Thus, Model A-3A is generally suited for projects seeking a high overall performance, while Model A-1.5A is better when daylight and heat management take precedence. The results and performance metrics of the optimized solutions are summarized in Table 13, which presents the key performance indicators for each atrium configuration.
Table 13
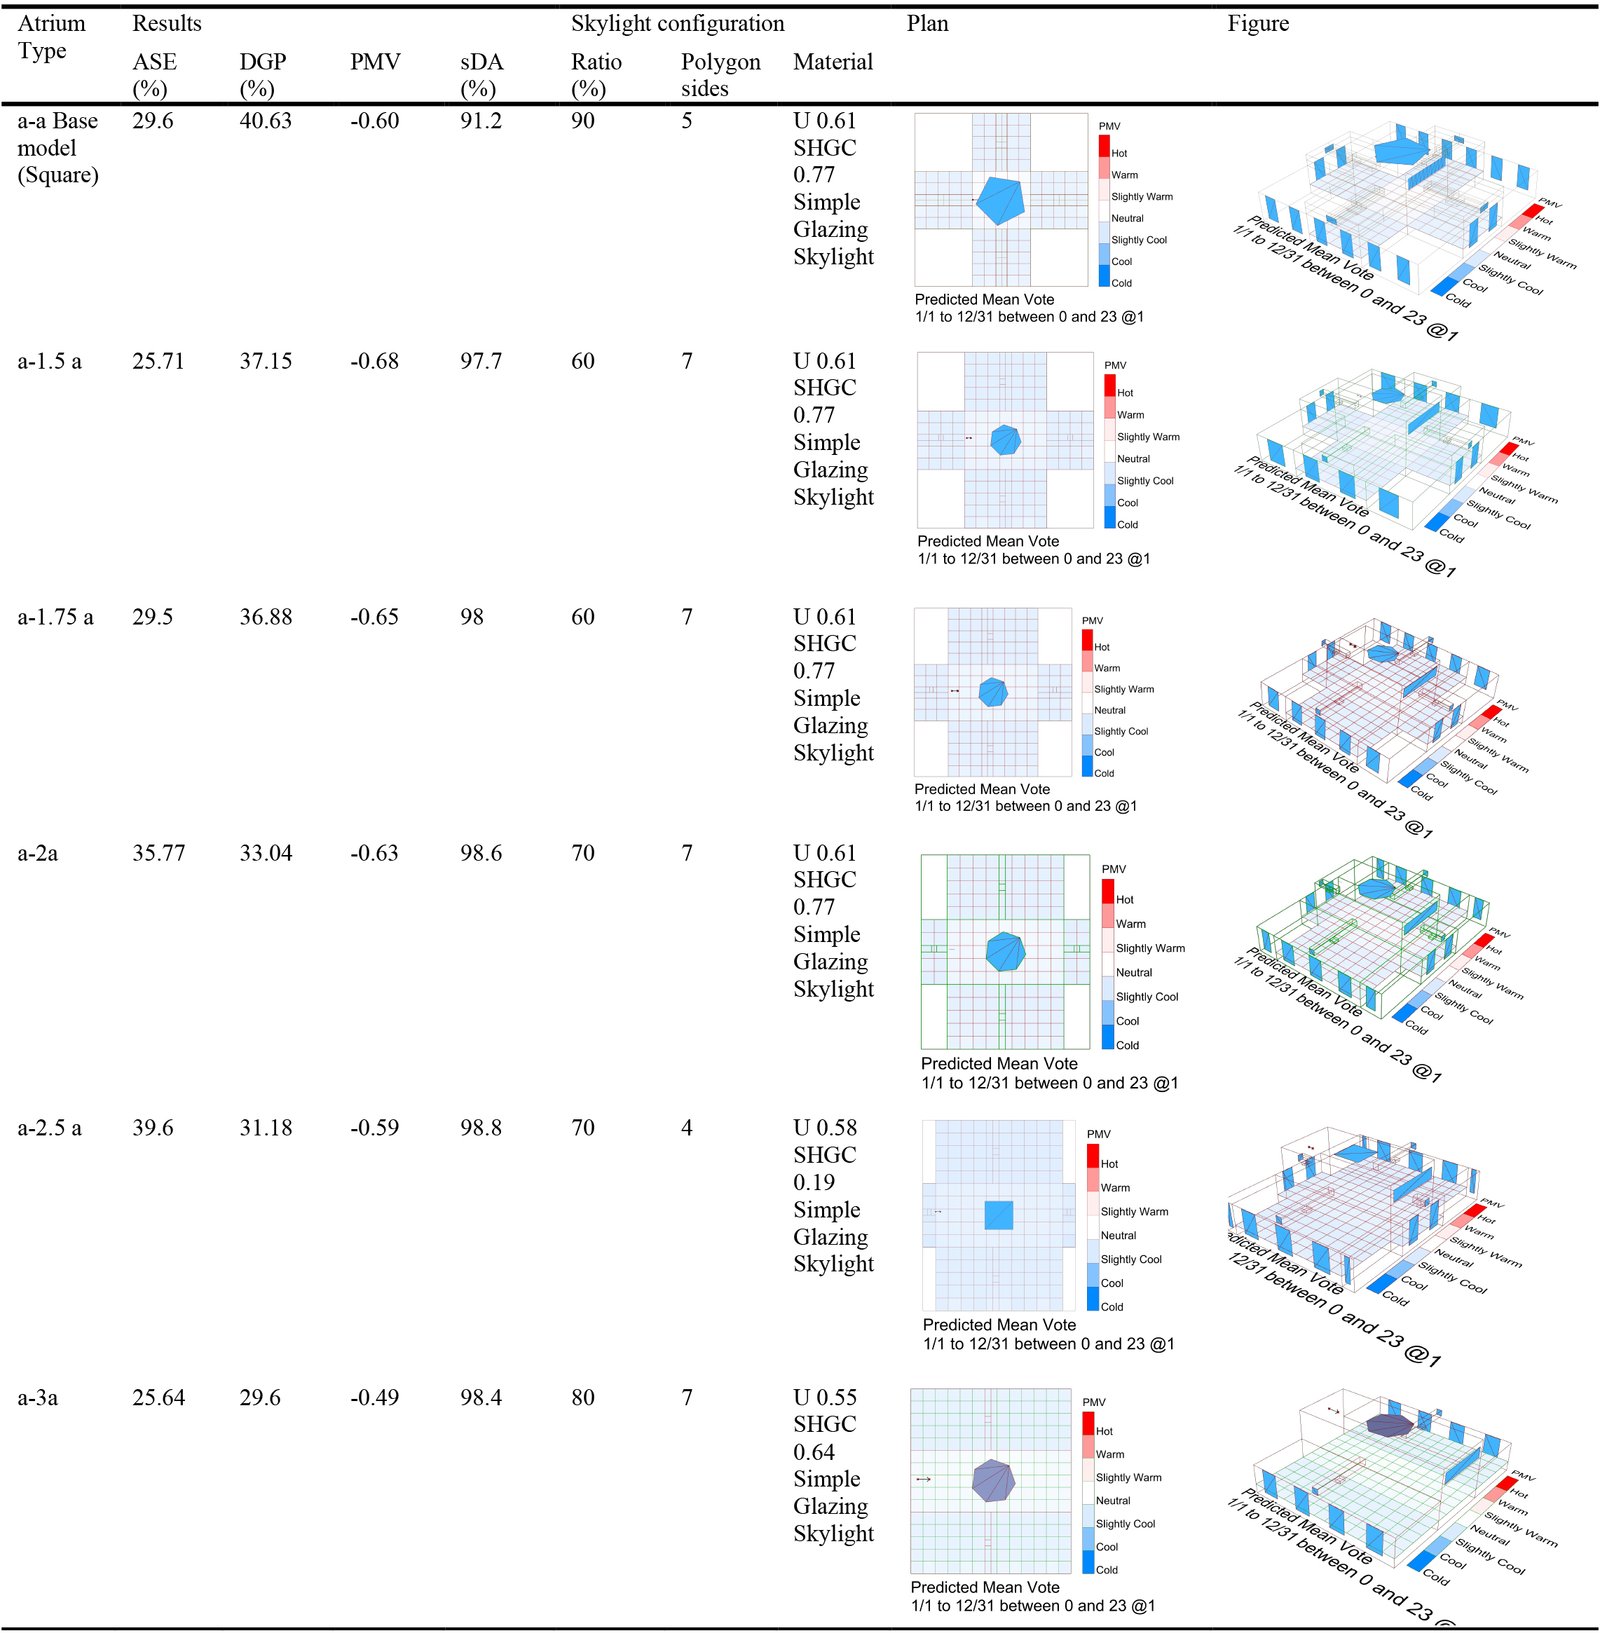
Table 13. Performance metrics of optimized solutions.
The A-3A atrium model, with a length-to-width ratio of 3:1, incorporates several key design features that optimize both thermal comfort and visual comfort, as well as daylight quality. This model’s geometry and materials play a significant role in controlling solar heat gain, daylight distribution, and glare, providing an efficient and comfortable interior environment. The following provides an in-depth analysis of its design characteristics based on critical performance parameters: PMV (Predicted Mean Vote), sDA (Spatial Daylight Autonomy), ASE (Annual Sunlight Exposure), and DGP (Daylight Glare Probability). The Model A-3A ratio of the atrium creates an elongated space that promotes even daylight distribution and limits excessive solar gain—key for energy efficiency and comfort. The seven-sided heptagonal shape minimizes sharp angles, which helps reduce glare and improves overall daylight quality while enhancing occupant comfort by diffusing sunlight. The Model A-3A’s glazing design offers two primary benefits: enhanced thermal efficiency and optimal daylighting. With a U-value of 0.55, the glazing helps reduce heat loss, thereby supporting energy efficiency. The Solar Heat Gain Coefficient (SHGC) of 0.64 allows moderate solar heat entry, balancing effective daylight penetration with controlled solar gain to maintain occupant comfort.
4.1. DGP
Daylight Glare Probability (DGP), a metric quantifying the likelihood of visual discomfort from natural daylight glare, was calculated to assess visual comfort. This analysis aimed to validate the accuracy of previous daylight analysis methods and to determine whether glare has an adverse effect on visual comfort. The worst-case viewing position, located near the atrium skylight, was objectively analyzed. Table 14, which shows the Glare Probability (DGP) for optimized solutions, clearly analyzes the impact of different atrium geometries and design features on daylight glare in indoor spaces.
Table 14
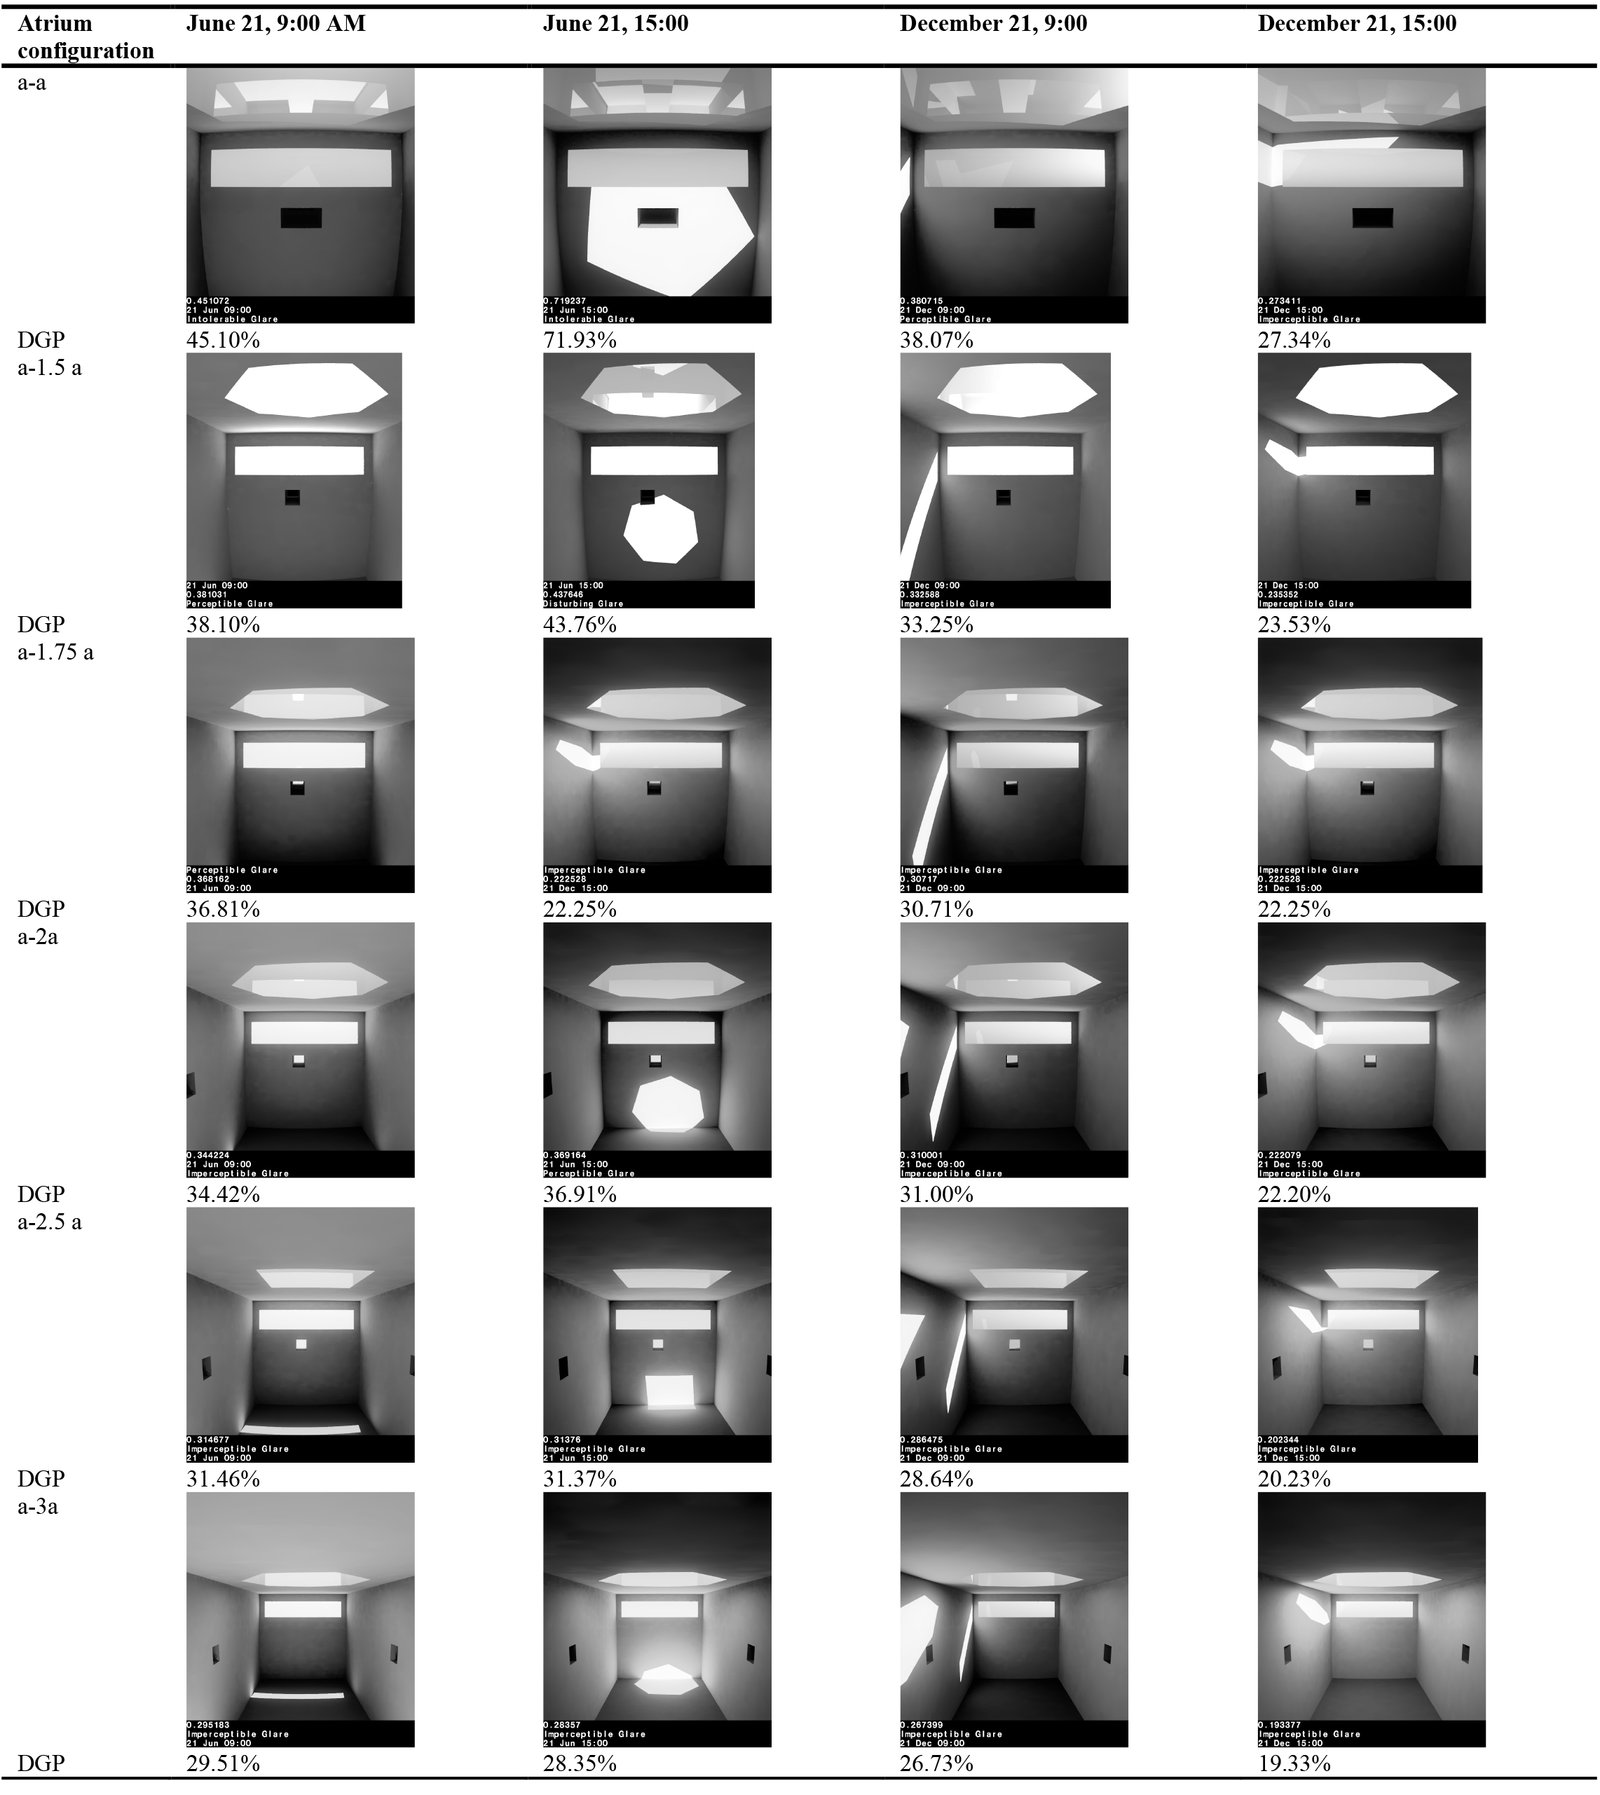
Table 14. Glare probability for optimized solutions.
The analysis was performed at 9:00 AM and 3:00 PM on both December 21 and June 21, representing the coldest and hottest days of the year, respectively, using optimized atrium models. The results are summarized in the following table. On June 21, the hottest day of the year, Model A-A exhibited a DGP of 71.93% at 3:00 PM, which is classified as intolerable glare. This outcome demonstrates that the square atrium geometry (1:1 ratio) permits excessive direct sunlight, resulting in significant glare. In contrast, Models A-3A and A-2.5A, which have higher length-to-width ratios, recorded substantially lower DGP values (28.35% and 31.37%, respectively), both within the unnoticeable glare range. These results indicate superior performance in maintaining visual comfort.
On December 21, the coldest day of the year, glare levels across all models decreased significantly. Model A-A at 3:00 PM showed a DGP of 27.34%, which falls within the unnoticeable glare range. Other models, such as A-1.5A and A-1.75A, showed similarly low DGP values (under 35%) in both morning and afternoon, indicating reduced glare and improved visual comfort. This trend aligns with the lower solar angles during the winter months, which naturally reduce the risk of glare. These results support the conclusion that atriums with higher length-to-width ratios, such as Models A-3A and A-2.5A, are more effective at reducing glare, particularly in the afternoon on the hottest day of the year. In contrast, shorter geometries, such as Model A-A, permit more direct sunlight and result in higher glare probabilities. Increasing the length-to-width ratio in atrium design reduces visual discomfort and contributes to thermal comfort by minimizing excessive solar heat gain. Model A-3, with a 3:1 length-to-width ratio, demonstrated the lowest DGP values in both summer and winter, indicating the most effective reduction of visual discomfort. Although natural light levels increase in summer, this model consistently minimizes glare and maintains visual comfort throughout the year. Model A-2.5A (2.5:1 Length-to-Width Ratio) also demonstrated good performance, maintaining low glare levels; however, its DGP values are slightly higher compared to Model A-3A. This model is suitable for conditions where more natural light is desired; however, it is less effective at controlling glare in the summer compared to the A-3A. Model A-A (1:1 Length-to-Width Ratio), with its square geometry, has the highest DGP values, especially at 3:00 PM on the hottest days of the year. This model allows more direct sunlight into the space, resulting in higher glare levels that can negatively impact visual comfort. Based on these analyses, models with higher length-to-width ratios, such as A-3A and A-2.5A, are optimal for enhancing both visual and thermal comfort. These configurations maximize natural light while minimizing glare, thereby improving comfort in interior spaces.
4.2. ASE
The ASE for the base model with square geometry (a-a) is 29.6%, indicating that a significant portion of the building’s interior receives direct sunlight year-round. This high solar exposure can cause glare and discomfort for occupants, emphasizing the need to refine atrium designs to address these problems. Atriums that admit intense sunlight often produce notable visual and thermal discomfort due to excessive daylight.
With a length-to-width ratio of 1.5:1 (a-1.5a), ASE drops to 25.71%, reflecting reduced solar exposure. This reduction, particularly in high-exposure areas, improves occupant comfort and lessens glare, highlighting the importance of controlling sunlight. Designing the atrium with a 1.5 ratio limits solar exposure, improving both thermal and visual comfort. For the length-to-width ratio of 1.75:1 (a-1.75a), the ASE rises slightly to 29.5%, indicating that this geometry allows more sunlight to pass despite a similar SRR (Skylight-to-Roof Ratio). The combination of direct solar angles and atrium shape increases sunlight penetration. Consequently, occupants may face greater discomfort due to higher solar exposure. In the case of the length-to-width ratio of 3:1 (a-3a), the ASE decreases slightly to 29.6%, representing a marginal reduction compared to the previous model. This decrease in solar exposure shows that the geometry of this model is capable of reducing sunlight penetration, although a substantial amount of direct sunlight remains. Despite the increase in length, the ASE value suggests that the geometry can partially mitigate the effects of solar gain, although it still allows a significant amount of natural light to pass through. When the length-to-width ratio increases to 2.5:1 (a-2.5a), ASE rises to 39.6%, indicating enhanced solar exposure. This higher exposure results from the deeper atrium’s geometry, which allows more sunlight to enter. Accordingly, occupants may experience heightened glare and discomfort, showing that excessive ratios negatively affect solar and visual comfort. Model A-3A, with a length-to-width ratio of 3:1, is identified as the most effective geometry for reducing solar exposure based on its ASE value of 29.6%. This model's atrium design provides an optimal balance between daylight distribution and minimizing excessive direct sunlight. The geometry specifically allows for control over the solar angles at different heights and times of day, resulting in more even daylight and less glare. Therefore, the 3:1 ratio offers the best solution for enhancing visual and thermal comfort by mitigating direct sunlight exposure while maintaining adequate natural lighting in the building.
4.3. PMV
The ASHRAE 55 standard [14] defines optimal thermal comfort as a PMV (Predicted Mean Vote) value between -0.5 and +0.5, achieved without the use of heating or cooling systems. Within this range, most occupants experience comfort, avoiding discomfort from excessive heat or cold. Within this context [114], the analysis that follows compares PMV values across various atrium configurations. For the base model (a-a), the PMV value is -0.60, indicating a moderate level of thermal discomfort. Although the model provides good daylighting, the thermal comfort is not optimal. This is likely due to the square geometry, which does not provide optimal control over solar heat gain, resulting in temperature imbalances within the space. The model results in slightly cooler indoor conditions, but it doesn’t offer the best thermal comfort compared to other configurations. With a length-to-width ratio of 1:1.5 (a-1.5a), the PMV improves to -0.68 compared to the base model, enhancing thermal comfort. This more negative PMV means the interior is cooler and offers greater comfort for occupants. The design reduces sunlight exposure, leading to improved visual and thermal comfort without compromising either aspect. For the length-to-width ratio of 1:1.75 (a-1.75a), the PMV value is -0.65, which is slightly better than the base model but not as good as the a-1.5a model. This configuration increases solar exposure, allowing more sunlight into the building and enhancing daylighting. However, the higher solar gain can raise indoor temperatures, impacting thermal comfort. Compared to the base model, this design maintains a cooler environment while providing more daylight, but it does not achieve optimal thermal comfort. For the length-to-width ratio of 1:2 (a-2a), the PMV value improves to -0.63, indicating better thermal conditions than those of a-1.75a, but not as favorable as those of the a-1.5a configuration. While increased solar exposure might reduce thermal comfort, this model excels at daylight distribution and provides a balanced solution for both lighting and comfort. Its primary advantage is achieving strong daylighting with reasonable thermal results, though it does not minimize solar gain as effectively as models with smaller length-to-width ratios. For the length-to-width ratio of 1:2.5 (a-2.5a), the PMV value improves to -0.59, indicating moderate comfort. The key advantage here is its strong daylighting performance, making it suitable for areas where natural light is prioritized. However, there is a risk of increased discomfort during warmer periods due to higher solar gain. Finally, the length-to-width ratio of 1:3 (a-3a) offers key advantages: it achieves the best PMV value of -0.49, ensures the coolest indoor environment, and, due to its geometry, effectively balances solar heat gain with daylight distribution. These factors together provide the highest levels of both thermal and visual comfort among all models evaluated. The PMV analysis indicates that the A-3A model (1:3 ratio) provides the most comfortable thermal conditions, striking a balance between solar heat gain and daylighting. While the A-2.5A and A-2A models have stronger daylighting performance, A-3A remains the best overall option for both thermal and visual comfort in atrium design.
4.4. sDA
The higher the sDA value, the more the space benefits from natural daylight, reducing the reliance on artificial lighting and contributing to an energy-efficient and comfortable indoor environment. The following analysis presents the sDA values for various atrium configurations and interprets their implications for daylighting performance. For the base model (a-a), with a square geometry, the sDA is 91.2%. This indicates that most of the space receives sufficient natural light; however, the square geometry can limit solar exposure control, potentially leading to thermal discomfort. In comparison, the 1:1.5 ratio (a-1.5a) increases sDA to 97.7%, showing improved daylight uniformity and better thermal comfort due to reduced solar exposure. The 1:1.75 model (a-1.75a) yields an sDA of 98%, allowing for even more daylight, albeit with a higher ASE of 29.5%, resulting in greater solar heat gain. These comparisons show that elongating the atrium increases sDA and improves light distribution, but can lead to increased solar exposure that may affect comfort.For the 1:2 length-to-width ratio (a-2a), the sDA increases to 98.6%, further enhancing daylight compared to previous models. However, with an ASE of 35.77%, the increased solar exposure surpasses that of the 1:1.75 configuration, suggesting a greater risk of thermal discomfort. While daylighting is highly effective, solar heat management becomes more challenging in models with longer dimensions. The 1:2.5 length-to-width ratio (a-2.5a) shows the highest sDA at 98.8%, making it the top performer for daylight. However, its ASE of 39.6% is also the highest, indicating much greater solar exposure than the other configurations; this could compromise thermal comfort if not managed. By contrast, the 1:3 model (a-3a) achieves nearly as high an sDA at 98.4%, but has the lowest ASE (25.64%), which means it minimizes solar exposure better while still offering excellent daylight. Comparing these two, a-2.5a maximizes daylight but requires stronger thermal strategies, while a-3a better balances daylight and comfort. The sDA values indicate how each atrium configuration compares in terms of daylighting effectiveness, with changes in geometry directly affecting both daylight quality and solar exposure. Base Model (a-a): 91.2% – Good daylighting but with higher solar exposure, leading to potential thermal discomfort.
- a-1.5a: 97.7% – Excellent daylighting with reduced solar exposure, providing a good balance between daylighting and thermal comfort.
- a-1.75a: 98% – Optimal daylighting performance but with higher solar exposure.
- a-2a: 98.6% – Excellent daylight distribution, but potential thermal discomfort due to increased solar gain.
- a-2.5a: 98.8% – Maximum daylight exposure, but high solar exposure could lead to thermal discomfort.
- a-3a: 98.4% – Balanced daylighting and solar exposure, providing both visual comfort and thermal comfort.
In conclusion, Model A-3a offers the optimal balance of daylighting and thermal comfort, making it the best choice for a comfortable and energy-efficient indoor environment.
5. Sensitivity analysis
In reality, sensitivity analysis is not just a hypothetical concept; it identifies how a model responds to changes in its inputs. Basically, it estimates the propagation of variation from the inputs to the outputs. According to Saltelli [115], sensitivity analysis determines the relative importance of each input in contributing to the variability of the production. This makes sensitivity analysis an essential tool in statistics and data analysis. An important aspect of Morris' method is that it is specifically designed to estimate the impact of different parameters on the model's output. By simulating and analyzing various parameters in the input space simultaneously, this strategy is referred to as a "one-factor-at-a-time" approach. To observe the impact of changes in each parameter on the output, paths are randomly set in the input space. The difference between the two models is referred to as an elementary effect, and the sensitivity of the model is derived from the elementary effect. As a result of this method, It is possible to understand how each parameter contributes to the output and its variability [116]. To evaluate the sensitivity of key input parameters, including DGP, PMV, ASE, and sDA, the robust Morris method was used. In this approach, each input parameter is systematically run in isolation, which allows significant factors, such as skylight-to-roof ratios, polygon side lengths, and material effects, to be identified. The sensitivity effects of six different atrium geometries were analyzed in comparison to other models. The Morris method provides two fundamental metrics for sensitivity evaluation: (the mean of elementary effects), which quantifies the overall impact of each parameter on the model's performance, and σ (the standard deviation), which captures the variability and uncertainty in these results. Additional atrium models and their parameters, including Ratio, Polygons, and Material, were evaluated to understand their impact on the building's performance metrics.
The sensitivity parameters, namely mu (a measure of the average change in performance per unit change in the atrium parameter) and mu_star (a similar measure considering data variability), were estimated and approximated for each of these factors. This study examines the effect of various atrium geometries on thermal and visual comfort. Six different atrium models, each with varying length-to-width ratios from 1:1 to 3:1, were analyzed. To optimize environmental conditions in building interior spaces, these models were assessed for μ* (visual comfort), σ (sensitivity to light changes), and μ* error values. The following provides a scientific interpretation and analysis of these parameters for each model. Model A-A (1:1) has μ* values of [0.05, 0.04, 0.04], indicating suitable natural light distribution. σ values [0.08, 0.08, 0.06] suggest moderate sensitivity to light changes. The lowest μ* error shows minimal sensitivity to geometric changes and consistent performance across conditions. This model maintains a balance between visual and thermal comfort. Model A-1.5A (Length-to-Width Ratio 1.5:1) demonstrates μ* values of [0.03, 0.02, 0.03], indicating reduced light input compared to Model A-A, which can enhance visual comfort. Transitioning from Model A-A, the σ values of [0.06, 0.04, 0.07] demonstrate lower sensitivity to light changes. The minimized μ* error (between 0.01 and 0.02) indicates stable performance against geometric changes. This model maintains both thermal and visual comfort more effectively than models with more complex geometries. Moving to Model A-1.75A (Length-to-Width Ratio 1.75:1), this design presents μ* values of [0.02, 0.02, 0.03], indicating increased light input compared to Model A-1.5A, which can improve visual comfort. The values of [0.06, 0.05, 0.06] reflect higher sensitivity to light changes. The μ* error is higher than in previous models (between 0.01 and 0.01), indicating greater sensitivity to geometric changes. This model is suitable for applications that require increased light input, although it may negatively impact thermal comfort. Continuing to Model A-2A (Length-to-Width Ratio 2:1), this model has μ* values of [0.02, 0.03, 0.02], indicating good natural light distribution. σ values of [0.04, 0.06, 0.04] show less sensitivity to light changes. With the lowest μ* error (between 0.01 and 0.01), this model provides stable performance against geometric changes and is well-suited for situations that demand a precise balance between visual and thermal comfort.
In subsequent comparisons, Model A-2.5A (Length-to-Width Ratio 2.5:1) exhibits μ* values of [0.04, 0.03, 0.03], indicating increased light input that can enhance visual comfort. The σ values of [0.11, 0.08, 0.07] indicate higher sensitivity to light changes and a greater risk of thermal comfort issues. The higher μ* error (between 0.01 and 0.02) demonstrates increased sensitivity to geometric changes, necessitating precise adjustments. This model is suitable for spaces that require high light input, but thermal comfort must be carefully managed. Lastly, in the series, Model A-3A (Length-to-Width Ratio 3:1) has μ* values of [0.03, 0.04, 0.03], reflecting increased light input. The σ values are [0.07, 0.08, 0.08], indicating a higher sensitivity to light changes and an increased likelihood of thermal comfort issues. The μ* error is also higher (between 0.01 and 0.02), showing high sensitivity to geometric changes. While this model can improve visual comfort due to increased light, thermal comfort may be compromised. This analysis reveals that higher length-to-width ratios enhance light entry but also exacerbate thermal comfort challenges. Simpler geometries and lower ratios, such as A-A and A-1.5A, better balance thermal and visual comfort. Therefore, choosing the right geometry and ratio is crucial for optimizing interior environmental conditions. Table 15, which shows the Morris method for design variables, presents the analysis conducted using this method to assess the significance of design variables in atrium optimization.
Table 15
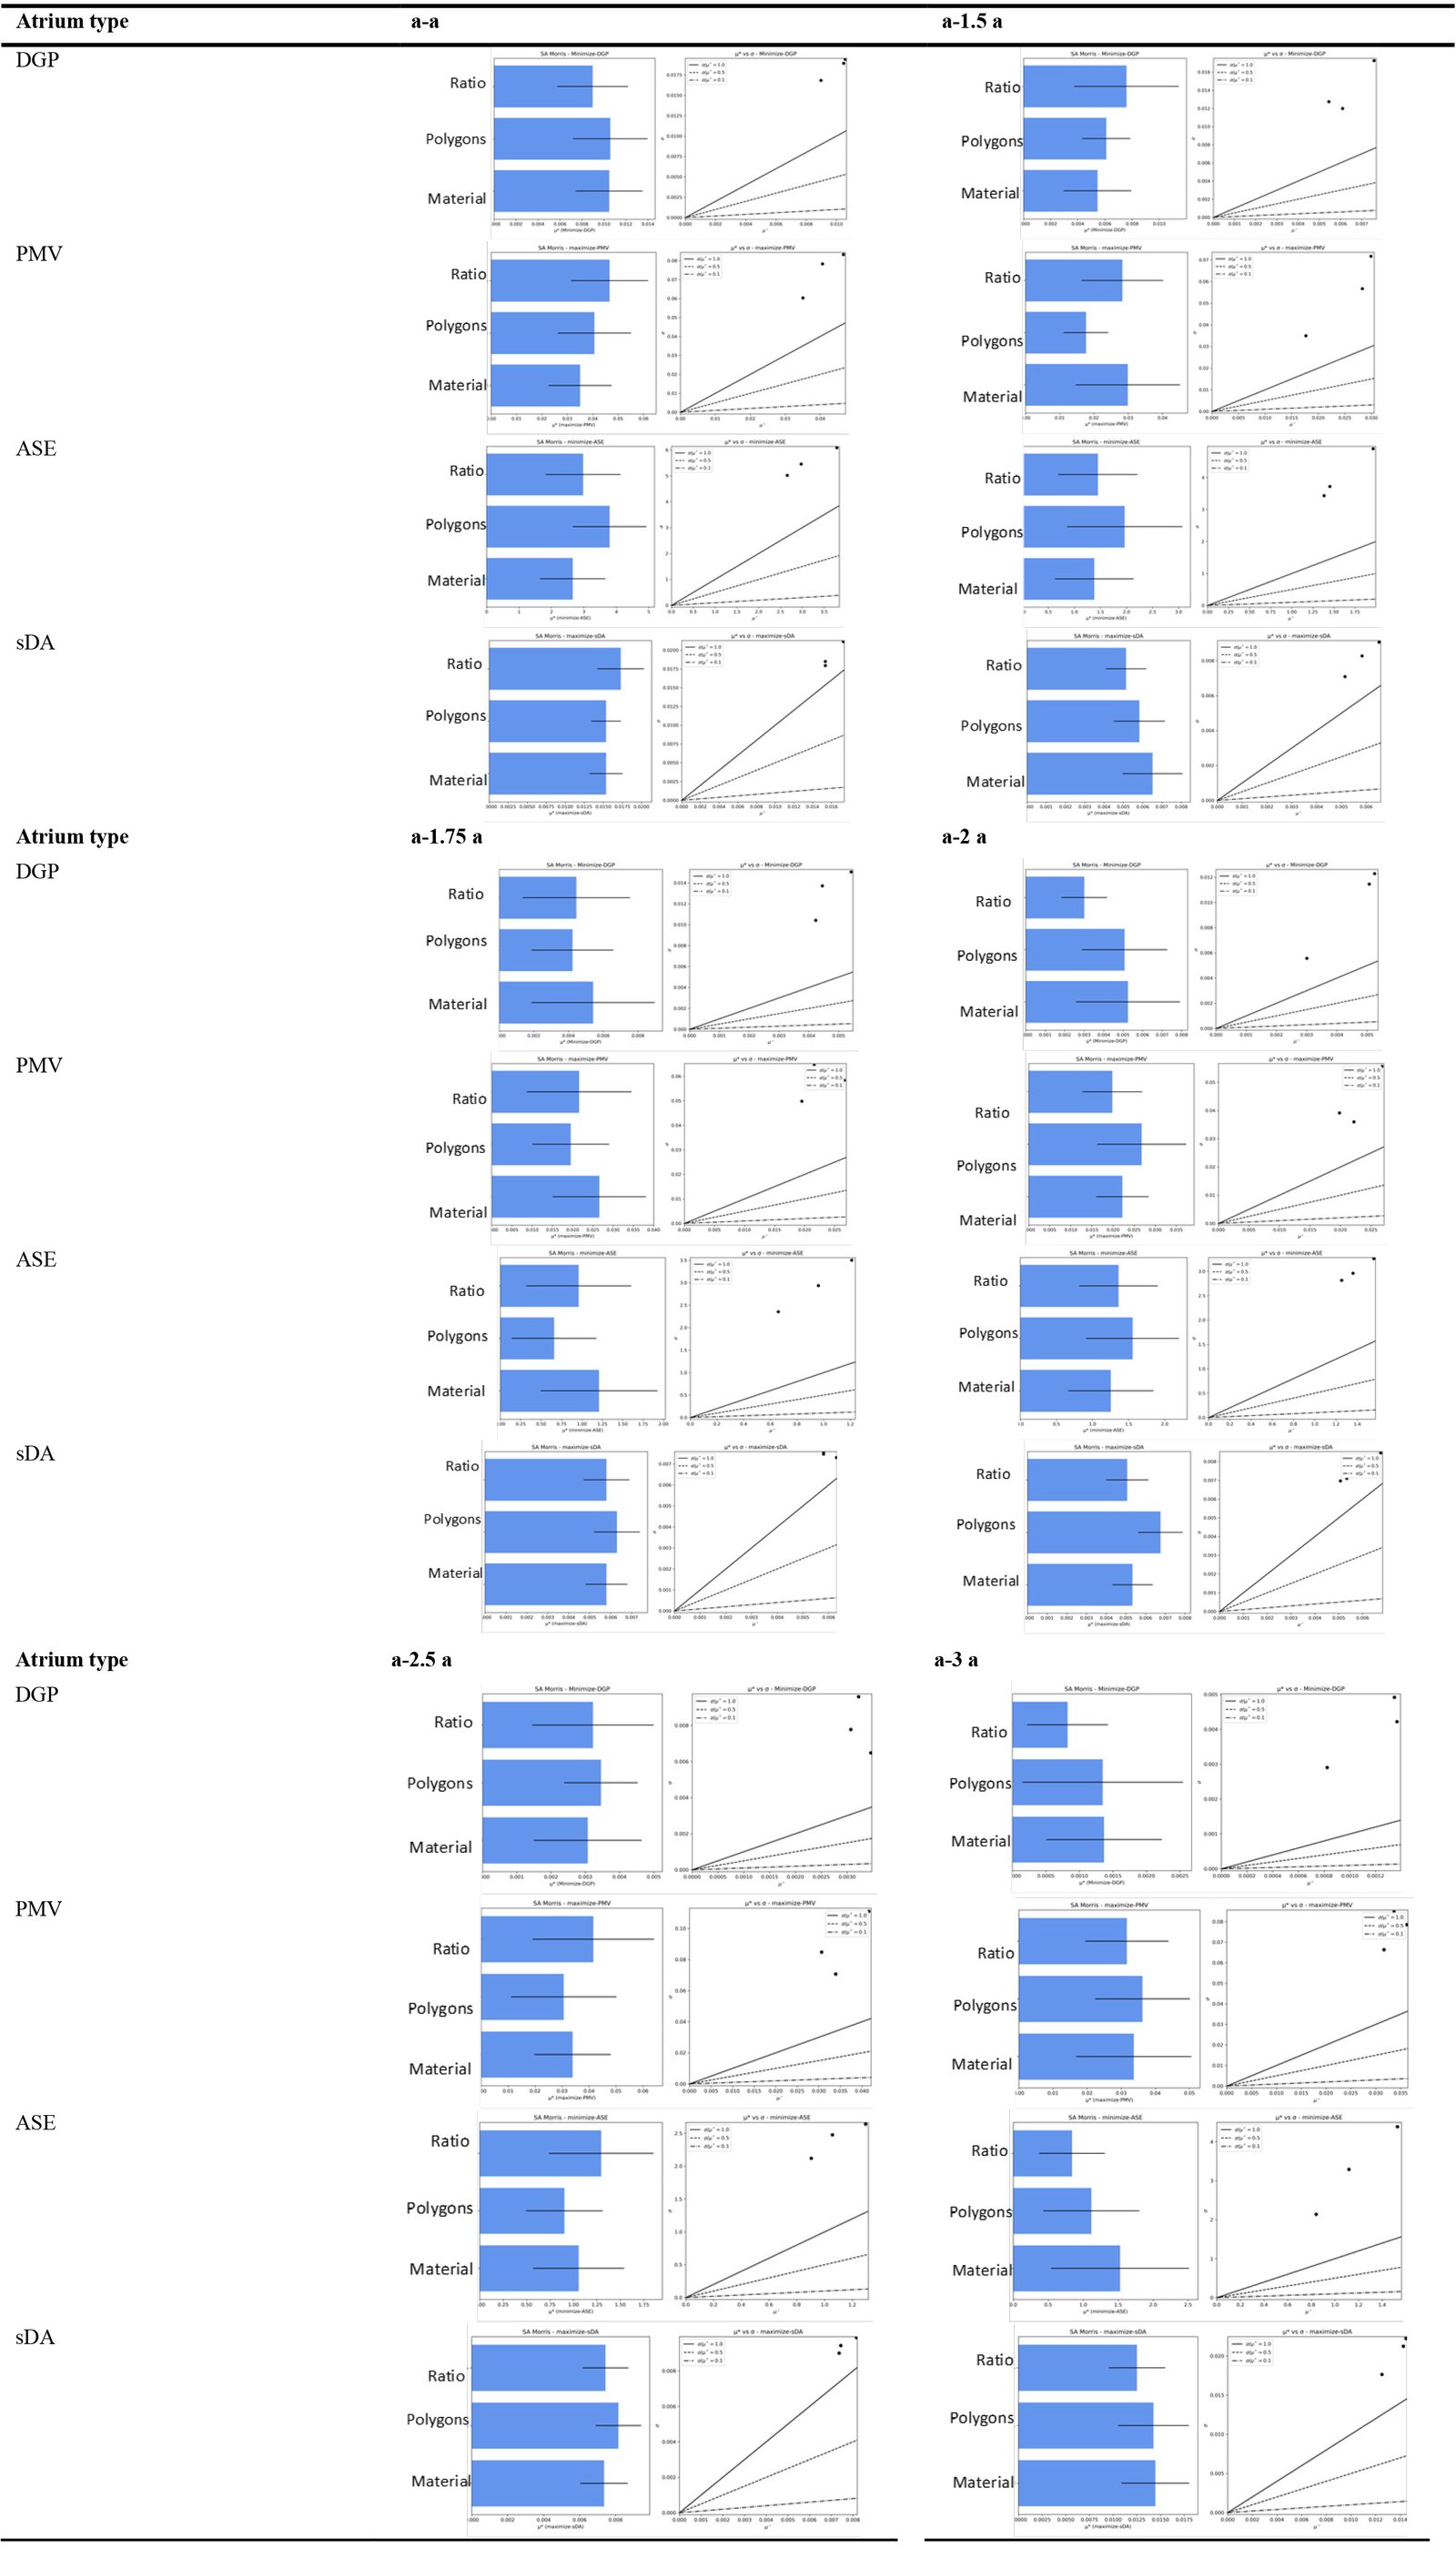
Table 15. Morris method for design variables.
6. Discussion
The proximate analysis highlights the significance of recent research in relation to prior studies, setting the stage for a more comprehensive discussion of how these results relate to and contradict existing research. In the following sections, we focus on the improvements and unique contributions of this study to the field of atrium optimization. Zhengshu Chen et al. [36] studied occupant comfort and energy efficiency. Beyraghshamshir et al. [57], investigated the impact of incorporating atriums as a passive design strategy in buildings in Yazd's hot-arid climate. In an elementary school, two passive systems were compared: central courtyards and atriums. Atriums significantly improve natural daylighting and reduce heating energy consumption, but they also tend to increase cooling demands due to excessive solar heat gain, especially in the summer. According to the research, optimizing atrium designs, along with natural ventilation and shading, could mitigate the increased cooling load, improving the overall energy efficiency of buildings in Yazd. Rastegari et al. [98] investigated the effect of atrium geometry on daylight performance for Tehran's hot-arid climate. Researchers evaluated the optimal configuration for daylighting in office buildings by varying the height, width, and length of atriums. As previous studies have confirmed, the best daylighting conditions occur when the Well Index (WI) approaches one. Furthermore, matching the atrium's layout to the building's footprint significantly improved daylight metrics. Kaveh's optimal building dimensions were 31.5 meters long, 10 meters wide, and 20 meters high, yielding a WI of 1.3. A study conducted by Shaeri et al. [117] investigated the thermal comfort of low-rise buildings with various atrium roof shapes in Bushehr's coastal areas, which have a hot desert climate and dry summers. In BWh climates, solar radiation and sea breezes influence optimal atrium roof designs for enhancing cooling. Natural ventilation is improved by the aerodynamic design of the atrium roof. Low-rise coastal buildings can benefit from these strategies, along with the proposed atrium shapes. As a result of the correlation between PMV/PPD and other environmental parameters, designers and researchers can better predict indoor thermal comfort in low-rise buildings with atriums. Thus, sustainable buildings with natural ventilation and improved thermal comfort can be built and CO2 emissions can be reduced. Asfour [71], examined atrium buildings in Saudi Arabia's hot and dry climate in his study "A Comparison Between the Daylighting and Energy Performance of Courtyard and Atrium Buildings". Five different WWR values were examined, ranging from 10% to 50%. According to the Saudi Building Code, this is the maximum height for commercial buildings. A reference case with no courtyard or atrium, a courtyard building, and an atrium building were considered for each WWR value. WWR increases natural daylight and reduces artificial lighting energy consumption, according to the study. As solar heat gains and the exposed external wall area increase, this also leads to higher cooling energy consumption. With shading devices and a WWR of 30%, the most optimal and balanced configuration between courtyard and atrium buildings was achieved. According to Lili Dong et al. [70], The atrium is a typical natural daylighting system in underground commercial spaces. By using orthogonal analysis, they simulated the effects of four factors (shape, number, profile inclination, and skylight aspect ratio) on lighting. According to their findings, two-story atriums with 1–3 square-shaped atria and an inclination of 5°–10° are the most efficient, reducing electricity consumption by almost 50%. A variation in these factors resulted in 1.2 to 1.3 times more energy savings. Sustainable lighting for underground spaces can be developed with the help of this analysis. A study by Chen, Zhengshu et al. [118] examined four different models of atria in college buildings located in cold regions. To set daylight comfort and energy consumption, they used the Grasshopper simulation platform (Ladybug Tools). The Octopus plugin was utilized for multi-objective optimization, resulting in a Pareto-optimized solution set following a field study of less significant variables. Atrium types were optimized to achieve energy efficiencies of 10.3%, 17.6%, 37.2%, and 30.5%, while daylight comfort was improved by 4.4%, 10.4%, 44.7%, and 34%. In the early stages of the design process, designers can use this research as a complete reference to optimize atrium parameters. According to Wei Xiao et al.[67], many design variables have a significant impact on implementation, including orientation, south facade inclination, roof inclination, the aspect ratio of the atrium's south and north sections (SARs and SARn), its east-to-west section aspect ratio (SARe/SARw), and its top-to-floor area ratio (TFAR).
This study provides a comprehensive analysis of Yazd's BWh climate, considering skylight geometry, skylight-to-roof ratio (SRR), and skylight glass material to optimize atrium designs. Building on previous research in hot and dry climates, this study presents an innovative approach by examining the impact of three key parameters geometry, SRR, and glass material on building performance in Yazd. Natural ventilation and daylighting remain critical for reducing energy consumption and improving occupant comfort in hot, arid regions. Optimizing atrium and courtyard designs in Yazd is essential due to the high temperatures and intense solar radiation characteristic of its BWh climate. This study examines the impact of atrium geometry, SRR, and various skylight glass types with differing U-values and SHGCs on thermal and luminous performance and occupant comfort. Unlike previous studies, this work focuses on a detailed assessment of SRR and skylight geometry for enhancing Yazd's performance. The findings provide valuable insights for enhancing daylighting and thermal comfort, emphasizing the significance of skylight geometry and glass type in hot, arid climates.
7. Conclusion
A multi-objective analysis has been conducted in this study to enhance visual and thermal comfort in office buildings within the BWh climate zone in Yazd, Iran. As a result of this study, six different atrium configurations are evaluated, highlighting how various geometries, skylight-to-roof ratios (SRRs), and material properties impact daylighting and thermal comfort in atria. By optimizing these variables, the research provides practical insights for enhancing daylight quality and energy performance in offices, particularly in hot desert climates.
The results of the study suggest that the A-3A model, with its 3:1 ratio of length to width, is the most effective option for utilizing daylight while maintaining a comfortable temperature for its occupants. As a result of this configuration, solar heat gain is effectively mitigated, and a large amount of daylight is spread throughout the building. This is shown by its sDA of 98.4% and exemplary PMV of -0.49. As a result of its minimal glare, the A-3A model delivers the best indoor quality and reduced solar heat by maintaining optimal climatic and visual conditions. Compared to A-2.5A and A-2A, configurations such as A-2.5A and A-2A offer better daylighting performance; however, their higher ASE values indicate increased sun exposure for the occupants of the structure, which can lead to thermal discomfort. There is a clear trade-off here: designs that maximize natural light can inadvertently result in increased solar heat gain, which in turn may lead to a reduction in overall occupant comfort within the building. As a result, it is essential to consider both daylight access and thermal management when designing an atrium to ensure they are balanced.
Furthermore, the study highlights the critical role that skylight geometry and SRR play in the performance of the atrium as well. Both of these elements are pivotal for maintaining a balance between daylight distribution and solar heat gain, which in turn impact the comfort of occupants and the building's efficiency. While the study focuses on fixed skylight systems and the use of simplified simulation tools, such as Honeybee and Ladybug, the analysis still presents some limitations due to the study's focus on fixed skylight systems. It is essential to keep in mind that these tools are based on assumptions that may not accurately represent dynamic, real-world scenarios, such as fluctuating occupant behavior or changing environmental conditions. It would be beneficial for future studies to investigate dynamic skylight systems that adapt to changing daylight conditions and consider incorporating renewable energy solutions to enhance energy efficiency and comfort further. In conclusion, this study offers practical, evidence-based guidance for optimizing atrium designs in hot desert climates. This model is the best available solution for balancing daylight and thermal comfort, forming the basis for future sustainable building innovations in terms of daylighting and thermal comfort.
Funding
This research received no external funding.
Author Contributions
Parisa Javid: Conception, analysis, interpretation of data, writing original draft, writing – review and editing, supervision; Niloufar Nikghadam: Conception, data modeling, simulation, acquisition, analysis, interpretation of data, writing – original draft; Alireza Karimpour: Conception, data modeling, simulation, acquisition, analysis, interpretation of data, writing – original draft; Jaleh Sabernejad: Interpretation of data, writing – original draft.
Declaration of competing interest
The authors declare no conflict of interest.
References
- S. Hoseinzadeh, B. Nastasi, D. Groppi, & D. Astiaso Garcia, Exploring the penetration of renewable energy at increasing the boundaries of the urban energy system - The PRISMI plus toolkit application to Monachil, Spain. Sustainable Energy Technologies and Assessments, 54 (2022) 102908. https://doi.org/10.1016/j.seta.2022.102908
- M. Rastegari, S. Pournaseri, & H. Sanaieian, Analysis of daylight metrics based on the daylight autonomy (DLA) and lux illuminance in a real office building atrium in Tehran. Energy, 263 (2023) 125707. https://doi.org/10.1016/j.energy.2022.125707
- M. Shakouri, H. Ghadamian, S. Hoseinzadeh, & A. Sohani, Multi-objective 4E analysis for a building integrated photovoltaic thermal double skin Façade system. Solar Energy, 233 (2022) 408-420. https://doi.org/10.1016/j.solener.2022.01.036
- S. Proietti, U. Desideri, P. Sdringola, & F. Zepparelli, Carbon footprint of a reflective foil and comparison with other solutions for thermal insulation in building envelope. Applied Energy, 112 (2013) 843-855. https://doi.org/10.1016/j.apenergy.2013.01.086
- M. Khoroshiltseva, D. Slanzi, & I. Poli, A Pareto-based multi-objective optimization algorithm to design energy-efficient shading devices. Applied Energy, 184 (2016) 1400-1410. https://doi.org/10.1016/j.apenergy.2016.05.015
- K. Lai, W. Wang, & H. Giles, Solar shading performance of window with constant and dynamic shading function in different climate zones. Solar Energy, 147 (2017) 113-125. https://doi.org/10.1016/j.solener.2016.10.015
- F. Kheiri, A review on optimization methods applied in energy-efficient building geometry and envelope design. Renewable and Sustainable Energy Reviews, 92 (2018) 897-920. https://doi.org/10.1016/j.rser.2018.04.080
- S. M. Al-Masrani, K. M. Al-Obaidi, N. A. Zalin, & M. I. Aida Isma, Design optimisation of solar shading systems for tropical office buildings: Challenges and future trends. Solar Energy, 170 (2018) 849-872. https://doi.org/10.1016/j.solener.2018.04.047
- M. Rabani, H. Bayera Madessa, & N. Nord, Achieving zero-energy building performance with thermal and visual comfort enhancement through optimization of fenestration, envelope, shading device, and energy supply system. Sustainable Energy Technologies and Assessments, 44 (2021) 101020. https://doi.org/10.1016/j.seta.2021.101020
- S. Carlucci, G. Cattarin, F. Causone, & L. Pagliano, Multi-objective optimization of a nearly zero-energy building based on thermal and visual discomfort minimization using a non-dominated sorting genetic algorithm (NSGA-II). Energy and Buildings, 104 (2015) 378-394. https://doi.org/10.1016/j.enbuild.2015.06.064
- A. Kirimtat, O. Krejcar, B. Ekici, & M. Fatih Tasgetiren, Multi-objective energy and daylight optimization of amorphous shading devices in buildings. Solar Energy, 185 (2019) 100-111. https://doi.org/10.1016/j.solener.2019.04.048
- Z. S. Zomorodian & M. Tahsildoost, Assessment of window performance in classrooms by long term spatial comfort metrics. Energy and Buildings, 134 (2017) 80-93. https://doi.org/10.1016/j.enbuild.2016.10.018
- Z. S. Zomorodian & M. Tahsildoost, Assessing the effectiveness of dynamic metrics in predicting daylight availability and visual comfort in classrooms. Renewable Energy, 134 (2019) 669-680. https://doi.org/10.1016/j.renene.2018.11.072
- Thermal Environmental Conditions for Human Occupancy. (2013).
- A. Sharma, A. Kumar, & K. S. Kulkarni, Thermal comfort studies for the naturally ventilated built environments in Indian subcontinent: A review. Journal of Building Engineering, 44 (2021) 103242. https://doi.org/10.1016/j.jobe.2021.103242
- N. Sudarsanam & D. Kannamma, Assessing the Indoor Thermal Comfort and Adaptive Behaviours of Older People in the Residences of Warm and Humid Climate, India. Journal of Daylighting, Vol. 12, Issue 1, pp.190-214, 12 (2025) 190-214. https://doi.org/10.15627/jd.2025.11
- J. Zhao & Y. Du, Multi-objective optimization design for windows and shading configuration considering energy consumption and thermal comfort: A case study for office building in different climatic regions of China. Solar Energy, 206 (2020) 997-1017. https://doi.org/10.1016/j.solener.2020.05.090
- T. Méndez Echenagucia, A. Capozzoli, Y. Cascone, & M. Sassone, The early design stage of a building envelope: Multi-objective search through heating, cooling and lighting energy performance analysis. Applied Energy, 154 (2015) 577-591. https://doi.org/10.1016/j.apenergy.2015.04.090
- H. Sghiouri, A. Mezrhab, M. Karkri, & H. Naji, Shading devices optimization to enhance thermal comfort and energy performance of a residential building in Morocco. Journal of Building Engineering, 18 (2018) 292-302. https://doi.org/10.1016/j.jobe.2018.03.018
- R. A. Mangkuto, T. P. Simamora, D. P. Pratiwi, & M. D. Koerniawan, Computational modelling and simulation to mitigate the risk of daylight exposure in tropical museum buildings. Energy and Built Environment, 5 (2024) 171-184. https://doi.org/10.1016/j.enbenv.2022.09.001
- K. Li, H. Fukuda, L. Zhang, & R. Zhou, Parametric design and multi-objective optimization of daylight performance in gallery skylight systems: A case study on the high museum expansion. Energy and Buildings, 311 (2024) 114136. https://doi.org/10.1016/j.enbuild.2024.114136
- M. Marzouk, M. ElSharkawy, & A. Eissa, Optimizing thermal and visual efficiency using parametric configuration of skylights in heritage buildings. Journal of Building Engineering, 31 (2020) 101385. https://doi.org/10.1016/j.jobe.2020.101385
- Z. Fan, Z. Xiao, & J. Liu, Energy performance assessment of semi-transparent photovoltaic integrated large-scale railway stations among various climates of China. Energy Conversion and Management, 269 (2022) 115984. https://doi.org/10.1016/j.enconman.2022.115984
- B. Ge, Z. Fan, & J. Liu, Thermal and carbon emission multi-objective optimization of photovoltaic skylights integrated large railway station in the cold zone of China. Energy, 327 (2025) 136340. https://doi.org/10.1016/j.energy.2025.136340
- A. Zhang, R. Bokel, A. van den Dobbelsteen, Y. Sun, Q. Huang, & Q. Zhang, Optimization of thermal and daylight performance of school buildings based on a multi-objective genetic algorithm in the cold climate of China. Energy and Buildings, 139 (2017) 371-384. https://doi.org/10.1016/j.enbuild.2017.01.048
- K. Lakhdari, L. Sriti, & B. Painter, Parametric optimization of daylight, thermal and energy performance of middle school classrooms, case of hot and dry regions. Building and Environment, 204 (2021) 108173. https://doi.org/10.1016/j.buildenv.2021.108173
- H. Wu & T. Zhang, Multi-objective optimization of energy, visual, and thermal performance for building envelopes in China's hot summer and cold winter climate zone. Journal of Building Engineering, 59 (2022) 105034. https://doi.org/10.1016/j.jobe.2022.105034
- J. Zhao & Y. Du, Multi-objective optimization design for windows and shading configuration considering energy consumption and thermal comfort: A case study for office building in different climatic regions of China. Solar Energy, 206 (2020) 997-1017. https://doi.org/10.1016/j.solener.2020.05.090
- A. Tabadkani, M. Valinejad Shoubi, F. Soflaei, & S. Banihashemi, Integrated parametric design of adaptive facades for user's visual comfort. Automation in Construction, 106 (2019) 102857. https://doi.org/10.1016/j.autcon.2019.102857
- F. Rezaei, H. Sangin, M. Heiranipour, & S. Attia, A Multi-objective Optimization of Window and Light Shelf Design in Office Buildings to Improve Occupants' Thermal and Visual Comfort. Journal of Daylighting, Vol. 11, Issue 1, pp.55-68, 11 (2024) 55-68. https://doi.org/10.15627/jd.2024.4
- K. S. Lee, K. J. Han, J. W. Lee, H. Yang, J. Peng, & D. Karamanis, The Impact of Shading Type and Azimuth Orientation on the Daylighting in a Classroom-Focusing on Effectiveness of Façade Shading, Comparing the Results of DA and UDI. (2017).
- D. Wijaya, S. Utami, & R. Mangkuto, Multi-Objective Optimisation of Skylight Design Parameters for a Low-rise Building in the Tropics. International Journal of Technology, 15 (2024) 1012-1025. https://doi.org/10.14716/ijtech.v15i4.5484
- Z. Shirzadnia, A. Goharian, & M. Mahdavinejad, Designerly approach to skylight configuration based on daylight performance; toward a novel optimization process. Energy and Buildings, 286 (2023) 112970. https://doi.org/10.1016/j.enbuild.2023.112970
- J. Li, X. Chen, Q. Ban, & J. Yao, Skylight Sizing based on balancing Daylighting Performance and Visual Comfort in Atrium Buildings. (n.d.).
- M. Marzouk, M. ElSharkawy, & A. Mahmoud, Optimizing daylight utilization of flat skylights in heritage buildings. Journal of Advanced Research, 37 (2022) 133-145. https://doi.org/10.1016/j.jare.2021.06.005
- L. Wang, Q. Huang, Q. Zhang, H. Xu, & R. K. K. Yuen, Role of atrium geometry in building energy consumption: The case of a fully air-conditioned enclosed atrium in cold climates, China. Energy and Buildings, 151 (2017) 228-241. https://doi.org/10.1016/j.enbuild.2017.06.064
- F. Xu, C. Li, & H. Tang, Influence analysis of space configuration on cooling load of a large semi-closed atrium in hot and humid region. Building and Environment, 225 (2022) 109670. https://doi.org/10.1016/j.buildenv.2022.109670
- P. Wu, J. Zhou, & N. Li, Influences of atrium geometry on the lighting and thermal environments in summer: CFD simulation based on-site measurements for validation. Building and Environment, 197 (2021) 107853. https://doi.org/10.1016/j.buildenv.2021.107853
- Y. Xue & W. Liu, A Study on Parametric Design Method for Optimization of Daylight in Commercial Building's Atrium in Cold Regions. Sustainability, 14 (2022). https://doi.org/10.3390/su14137667
- Y. Li, W. Fang, H. Qiu, W. Dong, J. Wang, & H. Bao, Diurnal Intervention Effects of Electric Lighting on Alertness, Cognition, and Mood in Healthy Individuals: A Systematic Review and Meta-Analysis. LEUKOS, 20 (2024) 291-309. https://doi.org/10.1080/15502724.2023.2279946
- W. El-Abd, B. Kamel, M. Afify, & M. Dorra, Assessment of skylight design configurations on daylighting performance in shopping malls: A case study. Solar Energy, 170 (2018) 358-368. https://doi.org/10.1016/j.solener.2018.05.052
- S. Motamedi & P. Liedl, Integrative algorithm to optimize skylights considering fully impacts of daylight on energy. Energy and Buildings, 138 (2017) 655-665. https://doi.org/10.1016/j.enbuild.2016.12.045
- T. Mavridou & L. T. Doulos, Evaluation of Different Roof Types Concerning Daylight in Industrial Buildings during the Initial Design Phase: Methodology and Case Study. Buildings, 9 (2019). https://doi.org/10.3390/buildings9070170
- R. A. Mangkuto, T. P. Simamora, D. P. Pratiwi, & M. D. Koerniawan, Computational modelling and simulation to mitigate the risk of daylight exposure in tropical museum buildings. Energy and Built Environment, 5 (2024) 171-184. https://doi.org/10.1016/j.enbenv.2022.09.001
- H. Yang, X. Liu, Y. Gu, & C. Shen, A novel photovoltaic-photothermal coupling skylight based on spectral complementation conception: System design and performance investigation. Renewable Energy, 243 (2025) 122641. https://doi.org/10.1016/j.renene.2025.122641
- M. Mohsenin & J. Hu, Assessing daylight performance in atrium buildings by using Climate Based Daylight Modeling. Solar Energy, 119 (2015) 553-560. https://doi.org/10.1016/j.solener.2015.05.011
- Y. Huang & J. L. Niu, Energy and visual performance of the silica aerogel glazing system in commercial buildings of Hong Kong. Construction and Building Materials, 94 (2015) 57-72. https://doi.org/10.1016/j.conbuildmat.2015.06.053
- B. Raji, M. J. Tenpierik, & A. den Dobbelsteen, Early-Stage Design Considerations for the Energy-Efficiency of High-Rise Office Buildings. Sustainability, 9 (2017). https://doi.org/10.3390/su9040623
- R. Aram & H. Z. Alibaba, Thermal Comfort and Energy Performance of Atrium in Mediterranean Climate. Sustainability, 11 (2019). https://doi.org/10.3390/su11041213
- N. Nasrollahi, S. Abdolahzadeh, & S. Litkohi, Appropriate geometrical ratio modeling of atrium for energy efficiency in office buildings. Journal of Building Performance (JBP), 6 (2015) 2106-2180.
- H. Li, G. Geng, & Y. Xue, Atrium energy efficiency design based on dimensionless index parameters for office building in severe cold region of China. Building Simulation, 13 (2020) 515-525. https://doi.org/10.1007/s12273-020-0610-9
- A. Aldawoud, The influence of the atrium geometry on the building energy performance. Energy and Buildings, 57 (2013) 1-5. https://doi.org/10.1016/j.enbuild.2012.10.038
- Z. Guan, X. Xu, Y. Xue, & C. Wang, Multi-Objective Optimization Design of Geometric Parameters of Atrium in nZEB Based on Energy Consumption, Carbon Emission and Cost. Sustainability, 15 (2023). https://doi.org/10.3390/su15010147
- A. Laouadi, M. R. Atif, & A. Galasiu, Towards developing skylight design tools for thermal and energy performance of atriums in cold climates. Building and Environment, 37 (2002) 1289-1316. https://doi.org/10.1016/S0360-1323(02)00008-2
- B. Dai, Y. Tong, Q. Hu, & Z. Chen, Characteristics of thermal stratification and its effects on HVAC energy consumption for an atrium building in south China. Energy, 249 (2022) 123425. https://doi.org/10.1016/j.energy.2022.123425
- Y. Pan, Y. Li, Z. Huang, & G. Wu, Study on simulation methods of atrium building cooling load in hot and humid regions. Energy and Buildings, 42 (2010) 1654-1660. https://doi.org/10.1016/j.enbuild.2010.04.008
- M. Beyraghshamshir & E. Sarkardehei, A comparison of the cooling and heating performance of two passive systems of central courtyards and atriums at an elementary school in Yazd City. Solar Energy, 252 (2023) 156-162. https://doi.org/10.1016/j.solener.2023.01.034
- J. T. Jin & J. W. Jeong, Optimization of a free-form building shape to minimize external thermal load using genetic algorithm. Energy and Buildings, 85 (2014) 473-482. https://doi.org/10.1016/j.enbuild.2014.09.080
- A. A. Y. Freewan, Energy-Efficient Solutions Depending on Building Forms Design with Tilted South and North Facades. Buildings, 12 (2022). https://doi.org/10.3390/buildings12060753
- F. Arumi, Day lighting as a factor in optimizing the energy performance of buildings. Energy and Buildings, 1 (1977) 175-182. https://doi.org/10.1016/0378-7788(77)90030-5
- E. Cochran, Z. Pei, F. Marion, A. Kolosky, V. Loftness, & A. Aziz, Integrated Dynamic Skylight Solutions to Reduce Energy Consumption and Improve Indoor Lighting Quality in US Buildings. (n.d.).
- C. E. Ochoa, M. B. C. Aries, E. J. van Loenen, & J. L. M. Hensen, Considerations on design optimization criteria for windows providing low energy consumption and high visual comfort. Applied Energy, 95 (2012) 238-245. https://doi.org/10.1016/j.apenergy.2012.02.042
- P. Bakmohammadi & E. Noorzai, Optimization of the design of the primary school classrooms in terms of energy and daylight performance considering occupants' thermal and visual comfort. Energy Reports, 6 (2020) 1590-1607. https://doi.org/10.1016/j.egyr.2020.06.008
- J.-H. Lee, J. W. Moon, & S. Kim, Analysis of Occupants' Visual Perception to Refine Indoor Lighting Environment for Office Tasks. Energies, 7 (2014) 4116-4139. https://doi.org/10.3390/en7074116
- Z. Chen, Y. Cui, H. Zheng, & Q. Ning, Optimization and prediction of energy consumption, light and thermal comfort in teaching building atriums using NSGA-II and machine learning. Journal of Building Engineering, 86 (2024) 108687. https://doi.org/10.1016/j.jobe.2024.108687
- Z. Chen, Y. Cui, Z. Ren, Q. Ning, & X. Ding, Data-driven approach of atrium skylights-integrated photovoltaic systems design based on multimodal deep learning: Considering different regions in China. Energy, 335 (2025) 138099. https://doi.org/10.1016/j.energy.2025.138099
- W. Xiao, W. Zhong, H. Wu, & T. Zhang, Multiobjective optimization of daylighting, energy, and thermal performance for form variables in atrium buildings in China's hot summer and cold winter climate. Energy and Buildings, 297 (2023) 113476. https://doi.org/10.1016/j.enbuild.2023.113476
- S. Khayami, A. Ekhlassi, & M. Rahbar, Effect of earth-sheltering and atrium form and proportion integration on energy and lighting performance optimization in a hot arid climate of Mashhad, Iran. Energy Efficiency, 16 (2023) 6-. https://doi.org/10.1007/s12053-022-10074-5
- F. Chi & Y. Xu, Building performance optimization for university dormitory through integration of digital gene map into multi-objective genetic algorithm. Applied Energy, 307 (2022) 118211. https://doi.org/10.1016/j.apenergy.2021.118211
- L. Dong, Y. He, Q. Qi, & W. Wang, Optimization of daylight in atrium in underground commercial spaces: A case study in Chongqing, China. Energy and Buildings, 256 (2022) 111739. https://doi.org/10.1016/j.enbuild.2021.111739
- O. S. Asfour, A comparison between the daylighting and energy performance of courtyard and atrium buildings considering the hot climate of Saudi Arabia. Journal of Building Engineering, 30 (2020) 101299. https://doi.org/10.1016/j.jobe.2020.101299
- Z. Jalali, E. Noorzai, & S. Heidari, Design and optimization of form and facade of an office building using the genetic algorithm. Science and Technology for the Built Environment, 26 (2020) 128-140. https://doi.org/10.1080/23744731.2019.1624095
- I. Acosta, C. Varela, J. F. Molina, J. Navarro, & J. J. Sendra, Energy efficiency and lighting design in courtyards and atriums: A predictive method for daylight factors. Applied Energy, 211 (2018) 1216-1228. https://doi.org/10.1016/j.apenergy.2017.11.104
- K. Kalaimathy, R. Shanthi Priya, P. Rajagopal, C. Pradeepa, & R. Senthil, Daylight performance analysis of a residential building in a tropical climate. Energy Nexus, 11 (2023) 100226. https://doi.org/10.1016/j.nexus.2023.100226
- S. Francisco Permalink & D. de Vasconcellos, Title Evaluation of Annual Sunlight Exposure (ASE) as a Proxy to Glare: A Field Study in a NZEB and LEED Certified Office in Publication Date.
- L. Heschong, M. Saxena, seth wayland, & timothy perry, DAYLIGHT METRICS REPORT for the CEC PIER Daylighting Plus Research Program. (2012).
- C. F. Reinhart & O. Walkenhorst, Validation of dynamic RADIANCE-based daylight simulations for a test office with external blinds. Energy and Buildings, 33 (2001) 683-697. https://doi.org/10.1016/S0378-7788(01)00058-5
- K. Van Den Wymelenberg, M. Inanici, & P. Johnson, The Effect of Luminance Distribution Patterns on Occupant Preference in a Daylit Office Environment. LEUKOS, 7 (2010) 103-122. https://doi.org/10.1582/LEUKOS.2010.07.02003
- J. Lee, M. Boubekri, & F. Liang, Impact of Building Design Parameters on Daylighting Metrics Using an Analysis, Prediction, and Optimization Approach Based on Statistical Learning Technique. Sustainability, 11 (2019). https://doi.org/10.3390/su11051474
- M.-C. Dubois, Shading devices and daylight quality: an evaluation based on simple performance indicators. Lighting Research & Technology - LIGHTING RES TECHNOL, 35 (2003) 61-76. https://doi.org/10.1191/1477153503li062oa
- IES LM-83-12 Approved Method: IES Spatial Daylight Autonomy (sDA) and Annual Sunlight Exposure (ASE). (2012).
- J. Wienold & J. Christoffersen, Evaluation methods and development of a new glare prediction model for daylight environments with the use of CCD cameras. Energy and Buildings, 38 (2006) 743-757. https://doi.org/10.1016/j.enbuild.2006.03.017
- M. Hakimazari, M. Baghoolizadeh, S. M. Sajadi, P. Kheiri, M. Y. Moghaddam, M. Rostamzadeh-Renani, R. Rostamzadeh-Renani, & M. B. Hamooleh, Multi-objective optimization of daylight illuminance indicators and energy usage intensity for office space in Tehran by genetic algorithm. Energy Reports, 11 (2024) 3283-3306. https://doi.org/10.1016/j.egyr.2024.03.011
- K. A. Kurnia, D. N. Azizah, R. A. Mangkuto, & R. T. Atmodipoero, Visual Comfort Assessment Using High Dynamic Range Images under Daylight Condition in the Main Library Building of Institut Teknologi Bandung. Procedia Engineering, 170 (2017) 234-239. https://doi.org/10.1016/j.proeng.2017.03.056
- J. Wienold, Dynamic daylight glare evaluation. (2009).
- M. Alsukkar, M. Hu, A. Eltaweel, & Y. Su, Daylighting performance improvements using of split louver with parametrically incremental slat angle control. Energy and Buildings, 274 (2022) 112444. https://doi.org/10.1016/j.enbuild.2022.112444
- D. McIntyre, A guide to thermal comfort. Applied Ergonomics, 4 (1973) 66-72. https://doi.org/10.1016/0003-6870(73)90079-3
- K. E. Charles, Fanger's Thermal Comfort and Draught Models. (2003).
- P. Ole Fanger & J. Toftum, Extension of the PMV model to non-air-conditioned buildings in warm climates. Energy and Buildings, 34 (2002) 533-536. https://doi.org/10.1016/S0378-7788(02)00003-8
- ISO 7730:2005 - Ergonomics of the thermal environment - Analytical determination and interpretation of thermal comfort using calculation of the PMV and PPD indices and local thermal comfort criteria. (n.d.). https://www.iso.org/standard/39155.html (accessed November 15, 2025).
- Y. Zhai, Y. Wang, Y. Huang, & X. Meng, A multi-objective optimization methodology for window design considering energy consumption, thermal environment and visual performance. Renewable Energy, 134 (2019) 1190-1199. https://doi.org/10.1016/j.renene.2018.09.024
- Y. Yılmaz & B. Yılmaz, A weighted multi-objective optimisation approach to improve based facade aperture sizes in terms of energy, thermal comfort and daylight usage. Journal of Building Physics, 44 (2020) 174425912093004. https://doi.org/10.1177/1744259120930047
- B. V. Fakhr, M. Mahdavinejad, M. Rahbar, & B. Dabaj, Design Optimization of the Skylight for Daylighting and Energy Performance Using NSGA-II. Journal of Daylighting, Vol. 10, Issue 1, pp.72-86, 10 (2023) 72-86. https://doi.org/10.15627/jd.2023.6
- S. Xu, Y. Chen, J. Liu, J. Kang, J. F. Gao, Y. Qin, W. Tan, & G. Li, Comprehensive improvement of energy efficiency and indoor environmental quality for university library atrium-A multi-objective fast optimization framework. Frontiers of Architectural Research, 14 (2025) 449-470. https://doi.org/10.1016/j.foar.2024.08.010
- W. Bai, W. Guo, Y. He, Y. Wu, S. Liang, & S. Zhang, Research on the Optimization Design of the Atrium Space Form in University Libraries Based on the Coupling of Daylighting and Energy Consumption. Buildings, 14 (2024). https://doi.org/10.3390/buildings14092715
- J. Pang, Z. Fan, M. Yang, J. Liu, R. Zhang, W. Wang, & L. Sun, Effects of complex spatial atrium geometric parameters on the energy performance of hotels in a cold climate zone in China. Journal of Building Engineering, 72 (2023) 106698. https://doi.org/10.1016/j.jobe.2023.106698
- Y. Xue & W. Liu, A Study on the Optimization of Atrium Daylight and Energy Performance through Skylight and Shading Design in Commercial Buildings in Cold Zones. Buildings, 13 (2023). https://doi.org/10.3390/buildings13010228
- M. Rastegari, S. Pournaseri, & H. Sanaieian, Daylight optimization through architectural aspects in an office building atrium in Tehran. Journal of Building Engineering, 33 (2021) 101718. https://doi.org/10.1016/j.jobe.2020.101718
- H. Omrany, A. Ghaffarianhoseini, U. Berardi, A. Ghaffarianhoseini, & D. H. W. Li, Is atrium an ideal form for daylight in buildings? Architectural Science Review, 63 (2020) 47-62. https://doi.org/10.1080/00038628.2019.1683508
- "Wallacei X" Announcement - An evolutionary and analytic engine for grasshopper - Grasshopper / Wallacei - McNeel Forum. (n.d.). https://discourse.mcneel.com/t/wallacei-x-announcement-an-evolutionary-and-analytic-engine-for-grasshopper/77031 (accessed November 15, 2025).
- M. Talaei & H. Sangin, Multi-objective optimization of energy and daylight performance for school envelopes in desert, semi-arid, and mediterranean climates of Iran. Building and Environment, 255 (2024) 111424. https://doi.org/10.1016/j.buildenv.2024.111424
- R. De Vecchi, M. J. Sorgato, M. Pacheco, C. Cândido, & R. Lamberts, ASHRAE 55 adaptive model application in hot and humid climates: the Brazilian case. Architectural Science Review, 58 (2015) 93-101. https://doi.org/10.1080/00038628.2014.981145
- M. T. Aguilar-Carrasco, J. Díaz-Borrego, I. Acosta, M. Á. Campano, & S. Domínguez-Amarillo, Validation of lighting parametric workflow tools of Ladybug and Solemma using CIE test cases. Journal of Building Engineering, 64 (2023) 105608. https://doi.org/10.1016/j.jobe.2022.105608
- B. J. Al-Khatatbeh & S. N. Ma'Bdeh, Improving visual comfort and energy efficiency in existing classrooms using passive daylighting techniques. Energy Procedia, 136 (2017) 102-108. https://doi.org/10.1016/j.egypro.2017.10.294
- W. Zhang, Y. Zhang, X. Gu, C. Wu, & L. Han, Optimization Algorithms and Applications. Application of Soft Computing, Machine Learning, Deep Learning and Optimizations in Geoengineering and Geoscience, (2022) 47-71. https://doi.org/10.1007/978-981-16-6835-7_5
- P. Y. Papalambros, From Design Optimization to Design Science: An Evolution in Design Thinking. Design Research: The Sociotechnical Aspects of Quality, Creativity, and Innovation, (2024) 23-41. https://doi.org/10.1007/978-3-031-50488-4_2
- E. Naderi, B. Sajadi, M. A. Behabadi, & E. Naderi, Multi-objective simulation-based optimization of controlled blind specifications to reduce energy consumption, and thermal and visual discomfort: Case studies in Iran. Building and Environment, 169 (2020) 106570. https://doi.org/10.1016/j.buildenv.2019.106570
- R. D. Bingham, M. Agelin-Chaab, & M. A. Rosen, Whole building optimization of a residential home with PV and battery storage in The Bahamas. Renewable Energy, 132 (2019) 1088-1103. https://doi.org/10.1016/j.renene.2018.08.034
- N. Delgarm, B. Sajadi, & S. Delgarm, Multi-objective optimization of building energy performance and indoor thermal comfort: A new method using artificial bee colony (ABC). Energy and Buildings, 131 (2016) 42-53. https://doi.org/10.1016/j.enbuild.2016.09.003
- M. A. Campano, I. Acosta, A. L. León, & C. Calama, Validation Study for Daylight Dynamic Metrics by Using Test Cells in Mediterranean Area. International Journal of Engineering and Technology, 10 (2018) 487-491. https://doi.org/10.7763/IJET.2018.V10.1107
- J. I. Méndez, C. Muñoz, M. Alfaro-Ponce, E. Giorgi, & T. Peffer, Passive Thermal Enhancement of Composite Metallic Roofs Through Rooftop PV Integration: A Calibrated Case Study in Mexico, Processes, 13 (2025).
- Ashrae, Method of Test for Evaluating Building Performance Simulation Software. (2022).
- J. Mardaljevic, Daylight Simulation: Validation, Sky Models and Daylight Coefficients, 1999.
- T. Cheung, S. Schiavon, T. Parkinson, P. Li, & G. Brager, Analysis of the accuracy on PMV - PPD model using the ASHRAE Global Thermal Comfort Database II. Building and Environment, 153 (2019) 205-217. https://doi.org/10.1016/j.buildenv.2019.01.055
- A. Saltelli & P. Annoni, Sensitivity Analysis. (2010).
- A. Franczyk, Using the Morris sensitivity analysis method to assess the importance of input variables on time-reversal imaging of seismic sources. Acta Geophysica, 67 (2019) 1525-1533. https://doi.org/10.1007/s11600-019-00356-5
- J. Shaeri, M. Mahdavinejad, R. Vakilinejad, H. Bazazzadeh, & M. Monfared, Effects of sea-breeze natural ventilation on thermal comfort in low-rise buildings with diverse atrium roof shapes in BWh regions. Case Studies in Thermal Engineering, 41 (2023) 102638. https://doi.org/10.1016/j.csite.2022.102638
- Z. Chen, Y. Cui, H. Zheng, R. Wei, & S. Zhao, A Case Study on Multi-Objective Optimization Design of College Teaching Building Atrium in Cold Regions Based on Passive Concept. Buildings, 13 (2023). https://doi.org/10.3390/buildings13092391
2383-8701/© 2025 The Author(s). Published by solarlits.com. This is an open access article distributed under the terms and conditions of the Creative Commons Attribution 4.0 License.

3426
Total views
Citations
SHARE ON


