Article | 5 January 2026
Volume 13 Issue 1 pp. 1-19 • doi: 10.15627/jd.2026.1
Effects of Urban Obstructions on Spatial Daylight Autonomy (sDA) and Daylight Glare Probability (DGP) in Tropical Mid-rise Housings
Meenatchi Sundaram A,* Jyoti Luthra
Author affiliations
Department of Architecture, National Institute of Technology, Trichy-620015, India
*Corresponding author.
meenatchi@nitt.edu (M. Sundaram A)
Jyoti.luthra.79@gmail.com (J. Luthra)
History: Received 7 September 2025 | Revised 28 October 2025 | Accepted 13 November 2025 | Published online 5 January 2026
2383-8701/© 2026 The Author(s). Published by solarlits.com. This is an open access article distributed under the terms and conditions of the Creative Commons Attribution 4.0 License.
Citation: Meenatchi Sundaram A, Jyoti Luthra, Effects of Urban Obstructions on Spatial Daylight Autonomy (sDA) and Daylight Glare Probability (DGP) in Tropical Mid-rise Housings, Journal of Daylighting, 13:1 (2026) 1-19. doi: 10.15627/jd.2026.1
Figures and tables
Abstract
The limited research on obstruction-driven daylight reduction continues to hinder efforts to optimize natural daylight in compact mid-rise residential buildings. This study systematically examines how features of nearby obstructions, such as height, surface reflectance, and distance, along with street width, affect indoor daylighting in tropical residences. It employs an integrated approach combining climate-based simulations with occupant perception surveys for validation. Using IES-VE with RadianceIES, climate-based daylight modeling was conducted at the Sri Aksalaya mid-rise apartment complex in Tirupur, India. A total of 1,152 simulation scenarios were performed, varying the room layout orientation (north-east and south-west), road width (4–10 m), obstruction height (G to G+3), and façade reflectance (30–65%). Daylight performance was assessed using two metrics: Spatial Daylight Autonomy (sDA300/50%) and Daylight Glare Probability (DGP). The results were validated through structured surveys of 57 residents across all floors. Findings indicate that external obstructions are the primary factors impacting daylight performance; those located closest to the building (4 m from the building) reduce sDA by up to 67% compared to open conditions. The proximity of obstructions results in insufficient daylight (sDA < 50%) on the lower floors, whereas the upper floors experience excessive glare (DGP > 0.40). The middle floors are most affected by façade reflectivity, with the probability of glare increasing by 250% as reflectance rises from 30% to 65%. Statistical analysis revealed a strong correlation between simulation metrics and occupant satisfaction (R²= 0.84, p < 0.001). Window performance was orientation-dependent; from the selected room layouts, 1, 3, and 4 performed best for north-east, while layouts 2, 3, and 6 were ideal for south-west. Overall, urban morphology greatly influences daylight access and visual comfort in tropical homes. The study highlights the importance of context-specific fenestration design, façade reflectance, and floor-level strategies to optimise daylight and minimise glare in multi-floor residences in tropical settings.
Keywords
build obstruction, visual glare, street width, façade reflectance, orientation effects
Nomenclature
| sDA | Spatial Daylight Autonomy |
| DF | Daylight Factor |
| UDI | Useful Daylight Illuminance |
| DGP | Daylight Glare Probability |
| UGR | Unified Glare Rating |
| WWR | Window-to-Wall Ratio |
| SHGC | Solar Heat Gain Coefficient |
| CPWD | Central Public Works Department |
| DTCP | Directorate of Town and Country Planning |
| ASHRAE | American Society of Heating, Refrigerating and Air-Conditioning Engineers |
| EPW | Energy Plus Weather |
| CIE | International Commission on Illumination (Commission Internationale de l l'Éclairage) |
| G | Ground Floor |
| NE | North East |
| SE | South East |
| SW | South West |
| NW | North West |
1. Introduction
The presence of urban obstructions significantly impacts the quality of indoor daylight, which, in turn, affects a building's energy performance. Understanding obstruction geometry helps architects decrease dependence on artificial lighting and optimize façade and massing configurations to enhance natural illumination. In compact urban forms, this evaluation supports design choices that balance daylight performance with spatial density and visual comfort needs [1-3]. Since cities account for about 70% of global energy use, improving daylight access in high-density areas is a practical way to cut lighting-related energy consumption and greenhouse gas emissions [1,4-6].
Advances in computational daylight modelling have broadened the scope of daylight analysis. The focus has shifted from examining individual façade components to evaluating complex urban environments that influence daylight, such as obstruction geometry and façade interactions [2,3]. This development addresses the key limitations of traditional sky view factor methods, which often overlook the influence of surrounding morphological variables. In contrast, the new framework integrates multiscale urban geometric parameters, such as height-to-width ratios (H/W), setback distances (S), façade reflectance (ρf), and obstruction shading [7-9].
Urban morphological parameters, such as nearby buildings, canyon geometry, and urban facade reflectance, significantly influence solar access and indoor lighting distribution [10,11]. Research examines whether geometric factors, such as setback distances and building heights, have a greater impact on visual comfort than material properties, such as facade reflectance and glazing types [12]. The lack of unified guidance for location-specific daylighting continues to hinder the development of reliable standards tailored to local conditions, often resulting in inadequate daylight and increased reliance on artificial lighting [13,14]. Adapting architectural fenestration strategies to the urban context is essential for improving daylight access, visual comfort, and energy efficiency [15].
2. Literature review: urban morphology and daylighting performance
Current residential daylighting simulation studies increasingly evaluate occupant visual comfort by considering urban context and façade design variables [7,16,17-21]. Their results indicate that both the urban environment and individual building parameters collectively influence daylight performance. Key urban factors, such as building height, spacing (H/W ratio), density, street orientation, and obstruction geometry, determine daylight access, distribution, and quality [22-24]. At the building level, façade attributes such as window-to-wall ratio (WWR), glazing type, reflectivity, and shading configuration directly impact daylight metrics (DF, sDA, UDI), glare potential (DGP, UGR), and lighting energy use [20,25,26]. Both simulation and field studies consistently demonstrate that urban canyon geometries, especially the height-to-width ratio, solar-oriented street alignment, and setbacks, limit sky visibility and reduce daylight penetration on the lower floors of denser settlements [20,27,28]. Some research has shown that adjusting setback distance and WWR can effectively improve daylight performance. Additionally, increasing the sky-view factor and lateral daylight entry, along with the use of appropriate external shading strategies, helps reduce glare discomfort and lower reliance on artificial lighting [15,29].
2.1. The urban obstructions
Research indicates that façade character and vegetation cover can impact indoor daylight levels by up to 40%, primarily due to variations in canopy density and surface albedo [1,26,30,31]. Obstructions from neighboring buildings in dense urban areas block 20–35% of the sky view and, consequently, reduce indoor daylight availability. This underscores the impact of urban obstructions on the quality of daylight access to indoor spaces [32]. Shading helps reduce glare and limit summer heat gain in urban areas. However, excessive shading from nearby buildings or dense vegetation can block daylight, leading to suboptimal indoor lighting. Comparative studies across various climate regions have shown that lighting energy demand increases with increasing canyon aspect ratio [1,16,33,34]. Consequently, compact urban areas need a balanced approach that considers both daylight utilization and energy management.
2.2. Obstruction effects and performance metrics
The nature of urban obstruction, such as morphological character and facade properties, affects indoor daylight by altering sky view, inter-reflections, and the balance between diffuse and direct sky components. All these, in turn, directly influence key daylight assessment metrics, including sDA, DF, UDI, and vertical illuminance at the occupant’s eye level [10,25,35-38]. Daylight modelling studies based on local weather data further show that several urban parameters impact daylight performance. Solar orientation, street-canyon aspect ratio, surface reflectance, and shading within urban canyons influence daylight sufficiency, glare potential (e.g., DGP), and incident solar exposure [1,20,22,39]. To address urban daylight issues, recent research combines parametric geometry modelling (e.g., Grasshopper) with Radiance/Daysim simulations and multi-objective optimisation methods such as genetic algorithms and ML-based surrogate models. This integration allows exploration of solutions that increase useful daylight while reducing glare [40-45]. Simulation tools such as Daysim, Radiance, Ladybug Tools, and Design Builder enable fair comparisons across different orientations, massing configurations, glazing types, and shading systems. They provide comparable results using standard daylight metrics, such as sDA, UDI, and DGP, by maintaining consistent boundary conditions [2,15,38,41,42,46]. The window-to-wall ratio (WWR) remains a key constrained variable. Larger window areas improve daylight penetration but can also increase glare and solar heat gains. Optimal daylight designs strive to balance opening geometry with glazing transmittance and SHGC. They use fixed or responsive shading to keep target illuminance levels [47,48]. Empirical modelling by Kim and Kim [49] highlights the interaction effects among key façade variables, demonstrating that window dimensions, visible transmittance, orientation, and obstruction angles collectively determine annual daylight availability rather than acting as isolated factors [4].
Current daylighting assessments typically use metrics such as spatial Daylight Autonomy (sDA), useful daylight illuminance (UDI), and daylight factor (DF). These are often enhanced with solar radiation analysis and detailed illuminance measurements to capture both temporal and spatial performance [36,37,50,51]. Recent studies have advanced this analytical framework by integrating visual comfort indicators such as DGP, UGR, and luminance-contrast thresholds. These are incorporated with spectral analyses that account for both photopic efficacy and melanopic stimulus. Together, these approaches link daylight performance to both visual and non-visual human responses [13, 52,53]. The effects of nearby buildings are captured using context-based metrics such as the PSW index and vertical daylight-luminance measures. These evaluate the impact of façade orientation, sky condition, and obstruction geometry on indoor daylight performance in high-density residential contexts [54,55]. Post-occupancy studies indicate that context-sensitive metrics more accurately reflect reported daylight satisfaction than traditional luminance-only measures. They are more effective in translating simulated daylight performance into perceived comfort and user experiences.
2.3. Energy implications and sustainability
Enhancing daylight access in residential buildings reduces lighting energy consumption and promotes sustainability. Research indicates that effective daylighting reduces reliance on artificial lighting, resulting in a 30% decrease in energy consumption, and enhances occupant comfort [2,5,6,33,54,56]. However, urban environments often limit the effectiveness of daylight. Tall buildings, narrow streets, and dense urban canyons can restrict sky visibility and daylight entry, resulting in higher indoor lighting needs [2,5,6,33]. Consequently, dense urban areas tend to raise lighting energy costs and operational expenses, while also creating social and environmental challenges. In low-income neighborhoods, limited daylight access can raise lighting costs and deepen energy poverty, impairing comfort and fairness [11,16,57]. Urban design strategies that optimize building spacing, orientation, and façade treatment can improve energy efficiency and promote sustainable, equitable living environments [59].
2.4. Research gaps and theoretical framework
Research on tropical daylighting often overlooks the impact of urban environments and nearby structures on the quality of indoor daylight. Most studies focus on temperate regions, often emphasizing just one factor, with limited surface material diversity and simplified models. These constraints hinder a detailed understanding of how site conditions and material complexities affect indoor daylight access in dense urban areas. Moreover, the absence of occupant perception data diminishes the models' accuracy and restricts their applicability for evidence-based daylight planning.
Enhancing indoor daylight quality in buildings involves more than just designing fenestrations. An effective daylight analysis should consider site-specific massing, the urban environment, and user experience to optimize daylight autonomy [60]. This study combines climate-based daylighting analysis with urban morphology principles into a comprehensive framework that uses standardized metrics to assess daylight performance [19,29,35,47,61]. Performance indicators such as sDA and DGP are utilized, taking into account obstruction geometry, building orientation, and surface reflectance [36,62]. Including occupant perception data strengthens the analytical framework. Also offers validation to the study through real user experiences in tropical residential settings. Using this framework, the research explores three primary questions:
- How do variations in obstruction geometry, such as distance, height, and reflectance, influence window performance across multiple floors [28]?
- In what ways do urban geometric factors and surface reflection affect visual comfort [54]?
- Do standardized daylighting metrics accurately indicate occupant satisfaction in obstructed tropical environments [63]?
These questions guide the research methodology by connecting urban and building parameters to achieve daylight performance goals. Therefore, the study focuses on enhancing daylighting while minimizing glare in compact tropical residence environments.
3. Method
A mixed-methods approach was employed to investigate the impact of urban obstructions on indoor daylight performance in compact, mid-rise tropical residential areas. This study combines daylight simulations, occupant perception surveys, and statistical analyses to evaluate the connection between urban context and daylight satisfaction. Daylight availability was measured using standardised metrics such as sDA and DGP. Occupant feedback provided qualitative validation of sDA and DGP simulation. Thus, bridging the gap between simulation and perceptual responses. Neighbouring obstruction geometries, defined by distance, height, and surface reflectance, were systematically varied, and their effects were assessed across different floor levels to understand vertical variations in sDA and DGP. It integrates macro-level urban morphology parameters with micro-level daylight optimization for context-sensitive daylight design in tropical residential environments.
Daylight simulations were carried out using a climate-based modeling tool, specifically IES-VE (with Radiance) and DIVA-for-Rhino. The simulation was performed at a 0.75 m height analysis plane (standard work-plane height) inside typical rooms on all floors. Material properties were assigned according to standard specifications: an interior wall and ceiling reflectance of 70%, a floor reflectance of 20%, and an exterior façade (concrete) reflectance of 50% [12]. Glazing was modelled as clear glass (visible light transmittance 82%, reflectance 9%) in accordance with CPWD/ASHRAE standards. The DGP was calculated from luminance fisheye renders in Radiance (DIVA/IES-VE). The viewpoint was fixed at an eye level of 1.20 m, approximately 0.60 m behind the centerline of the work plane, facing the window with a 180° field of view. Radiance settings ensured convergence in urban scenes with reflections (-ab 5, -ad 4096, -as 1024, -aa 0.10, -ar 256).
Annual daylight modelling was employed to ensure comparability with previous studies in tropical environments. A total of 1,152 simulation cases were conducted and validated using occupant survey responses (n = 57). Figure 1, illustrates the seasonal/hourly daylight levels on the third (top) floor, representing the worst obstruction scenario. Simulations used the local EPW weather file for annual daylight analysis, with variable parameters listed in Table 1. Daylight analysis was performed under a CIE sky model at four times (08:00 am, 10:00 am, 12:00 noon, and 4:00 pm) to observe diurnal variations. The research design addresses three methodological objectives:
- Systematically evaluate the effect of urban obstructions on daylighting performance through parametric simulations.
- Evaluating visual comfort using validated glare prediction models; and
- Utilise occupant perception data to verify computational results and evaluate real-world applicability.
Figure 1
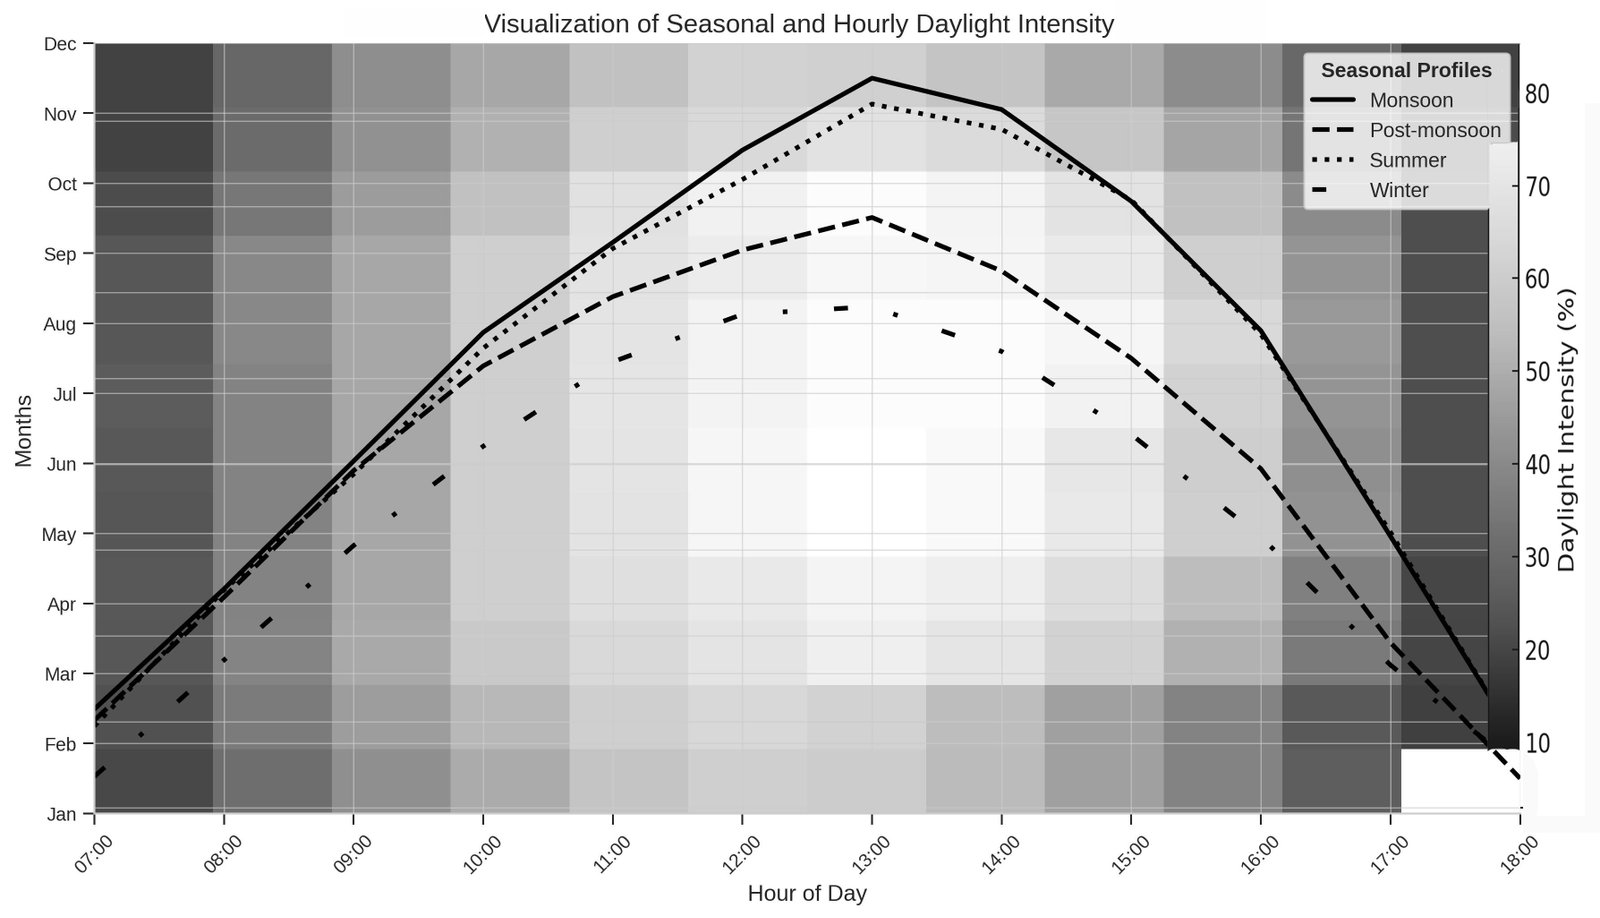
Fig. 1. Seasonal/hourly daylight illustrated at a representative fourth floor.
Table 1
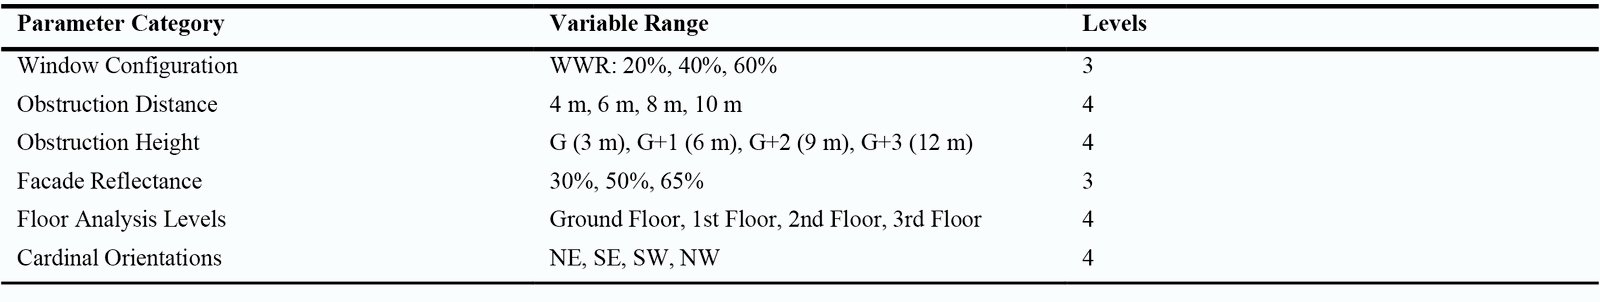
Table 1. Parametric variable configuration.
3.1. Study context and climate characterization
The Sri Aksalaya apartment complex in Tirupur, Tamil Nadu, India (11.11°N, 77.34°E), has been selected for this research. It is a typical mid-rise tropical residence featuring a Stilted + 4-Floor RCC frame structure, brick infill walls, and standard windows. On three sides, it is surrounded by roads, and on the fourth side, a similar type of building adjoins it. Tirupur experiences significant seasonal variations, with hot months from February to May and monsoon months from July to October, classified as a tropical savanna climate (Köppen-Geiger: Aw). Climate data for the study were obtained from validated EPW files, which enabled detailed annual analysis.
3.2. Seasonal and hourly variations in daylight intensity
Figure 1, illustrates an integrated daylight-autonomy profile for the study area, displayed at the representative fourth-floor level to show both daily and seasonal variations. The background heatmap reveals daylight intensity, which rises sharply after 08:00 am, peaks between 12:00 noon and 2:00 pm, then decreases significantly after 4:00 pm across all months. Daylight performance varies by season. The summer season exhibits the highest average daylight autonomy of 74.8% ± 8.6%, characterised by intense midday illumination exceeding 85%. The monsoon period has comparable performance at 72.4% ± 7.9%. Post-monsoon months reach moderate levels of 68.2% ± 6.3%, while winter months are the lowest at 54.7% ± 5.4%, with midday levels remaining below 60%. The results indicate a 30% seasonal difference in daylight autonomy between periods of maximum and minimum daylight availability.
Seasonal analysis reveals excessive daylight and glare during the summer, as well as increased glare during the monsoon. Conversely, due to limited daylight, winter mornings and evenings often need artificial lighting. Urban obstructions in tropical cities intensify both excessive glare and daylight deficiency, worsening seasonal imbalances. Although several studies have examined daylighting, the combined daily and seasonal effects of obstructions on visual comfort remain poorly understood. This study employs a case-based approach to assess the impact of urban obstructions on daylight autonomy and glare in the design of tropical mid-rise housing.
3.3. Computational simulation framework
Daylighting simulations were conducted using calibrated IES-VE software with integrated Radiance IES engines, while additional analyses were performed in DIVA for Rhino. The Radiance Monte Carlo ray-tracing algorithm simulated the behaviour of light and inter-reflections in an urban environment. The study divided functional spaces into 1 m × 1 m grids using DIVA (Rhino) and IES-VE to analyse daylight autonomy and illuminance in detail. Measurements were taken under CIE overcast sky conditions at four different times daily 08:00–10:00, 10:00–12:00, 12:00–14:00, and 14:00–16:00 for various window orientations. Obstruction distance and height were systematically adjusted to identify the optimal window orientation for maximizing daylight distribution and visual comfort. The study also examined how obstruction height and surface reflectance influence daylight and glare risk, while excluding the effect of the compound wall, as the stilt floor reduces its impact on daylight.
Key simulation parameters included: (a) an analysis plane height of 0.75 m, representing typical work-plane elevation; (b) material reflectance values with internal surfaces like the roof and ceiling at 70%, the floor at 20%, and external surfaces such as the roof at 10%, the building facade at 50%, the opposing façade at 35%, and the ground at 40% [64]; (c) glazing properties featuring a visible transmittance of 82% and reflectance of 9%; (d) sky conditions modelled using a CIE overcast sky for baseline calculations, with advanced metrics utilizing annual dynamic climate data; and (e) an analysis grid resolution of 1 m × 1 m to ensure comprehensive spatial coverage. Daylight performance was evaluated with the EPW weather file over a whole year, totalling 8,760 hours of simulation. Occupancy was assumed from 08:00 am to 6:00 pm local time, representing typical daytime in residences.
During these occupied hours, DA and sDA300/50% were measured. This method captures daily and seasonal variations in daylight during occupied periods.
3.4. Parametric variable configuration
The parametric analysis systematically varied key design and contextual variables. Each variable was adjusted within realistic ranges that reflect typical conditions of tropical urban development. The systematic variation of these parameters is summarised in Table 1.
Simulations were conducted using six typical room layouts from local residences, with fenestration meeting the standards set by the Central Public Works Department (CPWD) in India. The layouts analyzed in this study are shown in Fig. 2. These configurations are based on standard window placement practices observed in the study area. The room size remains constant at 4 m × 6 m, but the layouts differ in window size and placement. These configurations were then modeled and simulated using standardized sky conditions to assess daylight access and occupant visual comfort across the floor level. The simulation considered an obstruction height of up to 15 m, which corresponds to the maximum building height allowed under local standards set by the Directorate of Town and Country Planning (DTCP, India), permitting structures with G+3 floors or stilt plus four floors. As a result, external obstruction scenarios include height variations from ground floor level (G) up to 12 m or three additional floors (G+3), along with distance variations that reflect typical urban setback constraints.
Figure 2
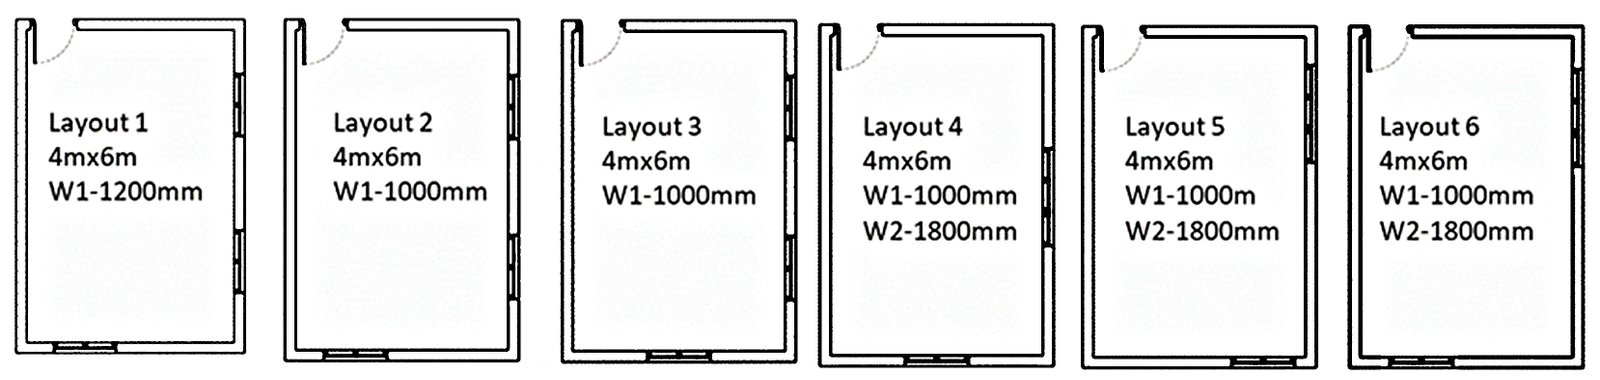
Fig. 2. Window placement reflecting local practice.
To examine orientation effects, the building was rotated to NE, SE, SW, and NW relative to the obstructions. Since the site receives high solar exposure on the NE and SW façades, the discussion focuses on daylight performance for these orientations.
Comparative analyses were conducted to examine the relationships among glare, obstruction variables (e.g., surface reflectance, height, and distance from the building), and visual comfort, as measured by a questionnaire survey. The relevant building contexts are shown in Fig. 3, including: (a) the site plan, (b) the typical floor plan, and (c) a building section illustrating obstruction heights (G to G+3) and the road width.
Figure 3
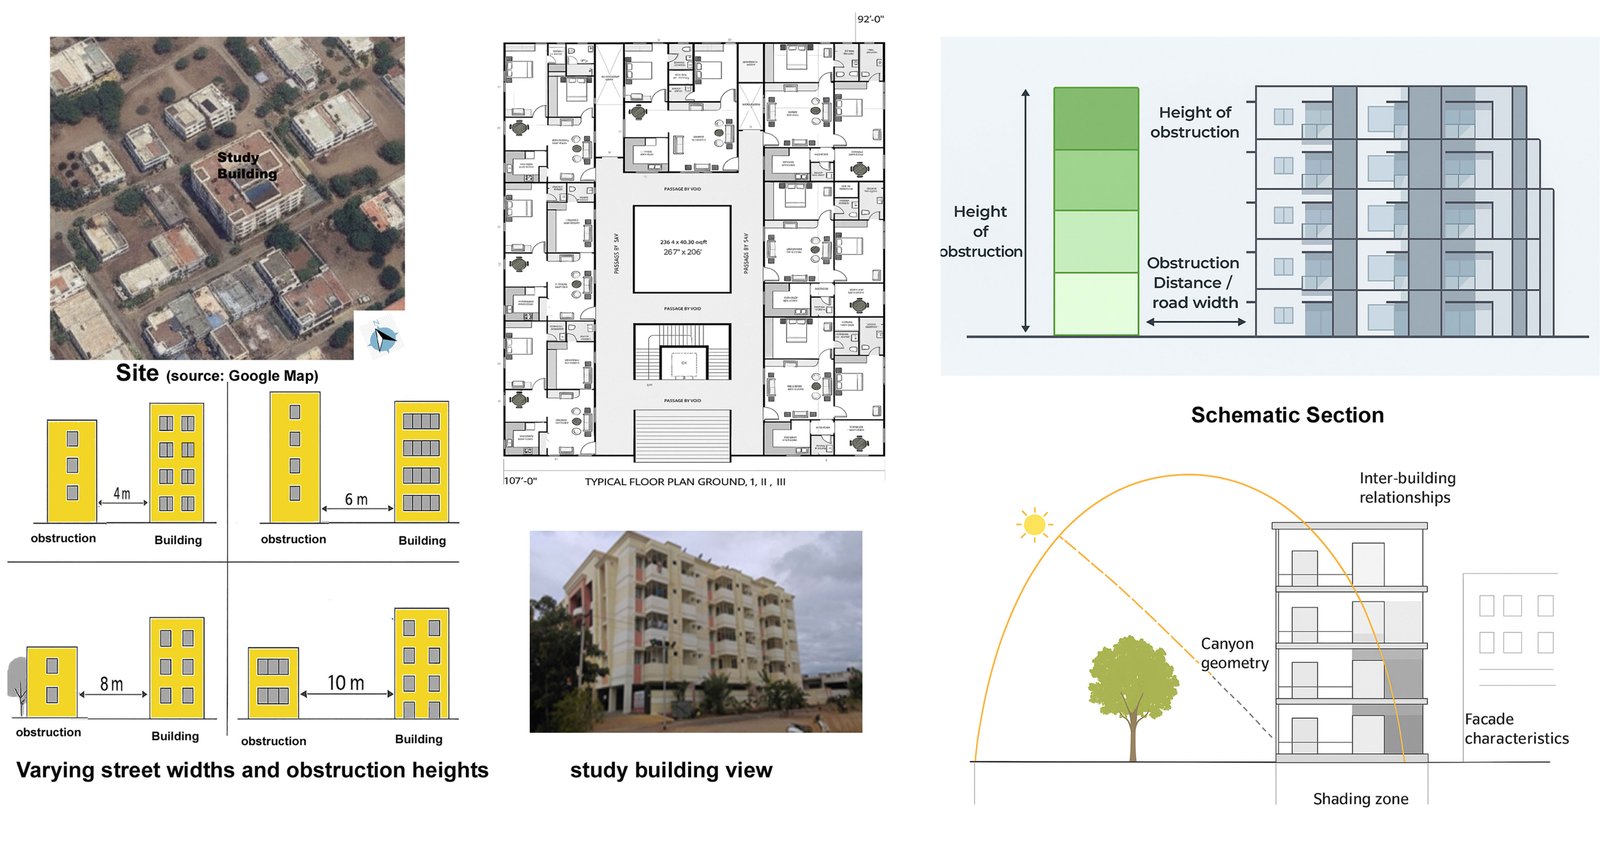
Fig. 3. Study Context - the study area and its surroundings.
3.5. Performance evaluation metrics
The study used sDA and DGP, widely recognised metrics for assessing daylight quality. Spatial Daylight Autonomy (sDA300/50%) measures the percentage of the area that receives at least 300 lux for half of the occupied hours over the year [65]. DGP was used to evaluate perceptual glare levels, with thresholds of DGP > 0.35 indicating intolerable glare and DGP > 0.40 indicating unbearable glare [66]. All values for this metric were obtained from hourly simulations using EPW weather datasets that consider tropical climate variability and seasonal changes [67].
3.6. Simulation model calibration
To validate the simulation, spot measurements were collected on-site in representative rooms under clear skies. Horizontal work plane illuminance at 0.75 m was measured with a calibrated lux meter during morning, midday, and afternoon. IES-VE and Radiance simulations were carried out for these same periods, maintaining consistent sky and solar conditions. The point-by-point agreement was within ±10% at all measurement points. For instance, an on-site reading of 480 lx compared to a simulated 520 lx at noon on the same floor showed an 8% difference. This suggests that the material properties, glazing transmittance, and simulation settings accurately reflect the actual site conditions. All subsequent sDA and DGP analyses were then performed using this calibrated model.
3.7. Occupant perception survey and validation
A survey of occupant perceptions was conducted to validate daylighting and visual comfort simulations. A total of 57 valid responses were collected, comprising 56% males and 44% females. The responses showed vertical spatial distribution across four levels (Ground floor: 15; First floor: 14; Second floor: 14; Third floor: 14) and demographic variation among age groups (16 to 24 years: 15; 24 to 35 years: 15; 35 to 46 years: 14; 46 to 60 years: 13). The survey was carried out in person over one week in March, from 09:00 am to 4:00 pm, mainly under clear skies. This aimed to capture typical daylight conditions and minimize bias caused by dawn, dusk, or overcast weather.
The survey focused on six key areas: daylight sufficiency, lighting changes over time, glare frequency and intensity, satisfaction with views, and adaptive behavioural strategies. A comprehensive statistical analysis was performed using R software (version 4.3.2). The study included multivariate regression, ANOVA, and correlation tests. Statistical significance was considered at p < 0.05, and effect sizes were measured using Cohen’s guidelines. Tukey’s Honest Significant Difference (HSD) test was used for post hoc comparisons in multiple tests. Pearson’s correlation analysis was also conducted to ensure the simulation results matched the survey data, thereby establishing the relationship between model predictions and residents’ experiences.
4. Results
4.1. Daylight autonomy performance with urban obstructions
An analysis of sDA was conducted to examine how various features of urban blocks, such as heights, proximity, and road width, influence daylight availability. The study revealed that orientation has a significant impact on daylight performance. Rooms facing northeast and southwest exhibit different daylight autonomy patterns, which are also influenced by factors like road width, obstacle height, and setback. Six layouts were evaluated for each orientation, considering scenarios with obstruction heights up to G+3 and distances and road widths ranging from 4 to 10 meters.
4.2. Combined effects of road widths and obstruction heights
The analysis shows that roads 4 meters wide significantly limit daylight access in both directions, and narrow setbacks, which decrease daylight performance. In NE orientations, the G+3 obstructions lower ground-floor daylight autonomy (DA) to less than 10%. SW rooms have even lower performance due to afternoon solar angles. Layout 6 has the lowest DA values because of its compact design and corner placement. Increasing the road width to 6 m results in only slight gains in DA. The first and second floors reach 60% to 80% daylight performance under G and G+1 height obstructions. Third floors usually exceed 70%, while ground floors remain low at 10% to 25%. Daylight access improves with street widths of 8 meters. Across various layouts, ground floors attain 35% to 50% DA, and first and second floors reach 50% to 65% DA under G+2 obstructions. The third floor consistently exceeds 70% sDA, indicating that wider streets reduce obstruction effects and improve daylight access. Statistical analysis demonstrates that daylight performance improves significantly as road width increases from 6 m to 8 m. When the road width reaches 10 m, daylight performance stays stable even with G+3 obstructions. The third floor maintains 70% to 80% sDA, while the ground floors reach only 40% to 55%, nearly quadrupling the performance of compact layouts. Variance analysis (σ < 8%) indicates consistent daylight distribution across floors, underscoring the need for wider setbacks to ensure equitable daylight access.
4.3. Specific influence in the North-East oriented room
Figure 4, illustrates how obstruction height (G, G+1, G+2, G+3 floors) and road width (4 m, 6 m, 8 m, 10 m) together influence daylight autonomy (DA) in rooms facing northeast. The comparison across the six layouts reveals clear differences in daylight performance. A narrow 4-meter-wide road with taller obstructions (G+2 or G+3) causes sDA values to drop below acceptable levels. This highlights how dense urban environments limit access to daylight. In contrast, layouts with wider road setbacks of 8 m or more tend to have more stable sDA values. Even when surrounded by taller obstructions, these layouts still achieve adequate daylight. This shows that increased urban spacing improves daylight access. In north-east-oriented layouts, numbers 1, 3, and 4 demonstrated higher daylight autonomy when obstructions were placed 8 m and 10 m from the building. Conversely, nearby obstructions caused a significant decrease in daylight on the ground, first, and second floors. Under these conditions, Layout 4 performed relatively better, while Layouts 5 and 7 consistently showed poor daylighting results across all tested scenarios.
Figure 4
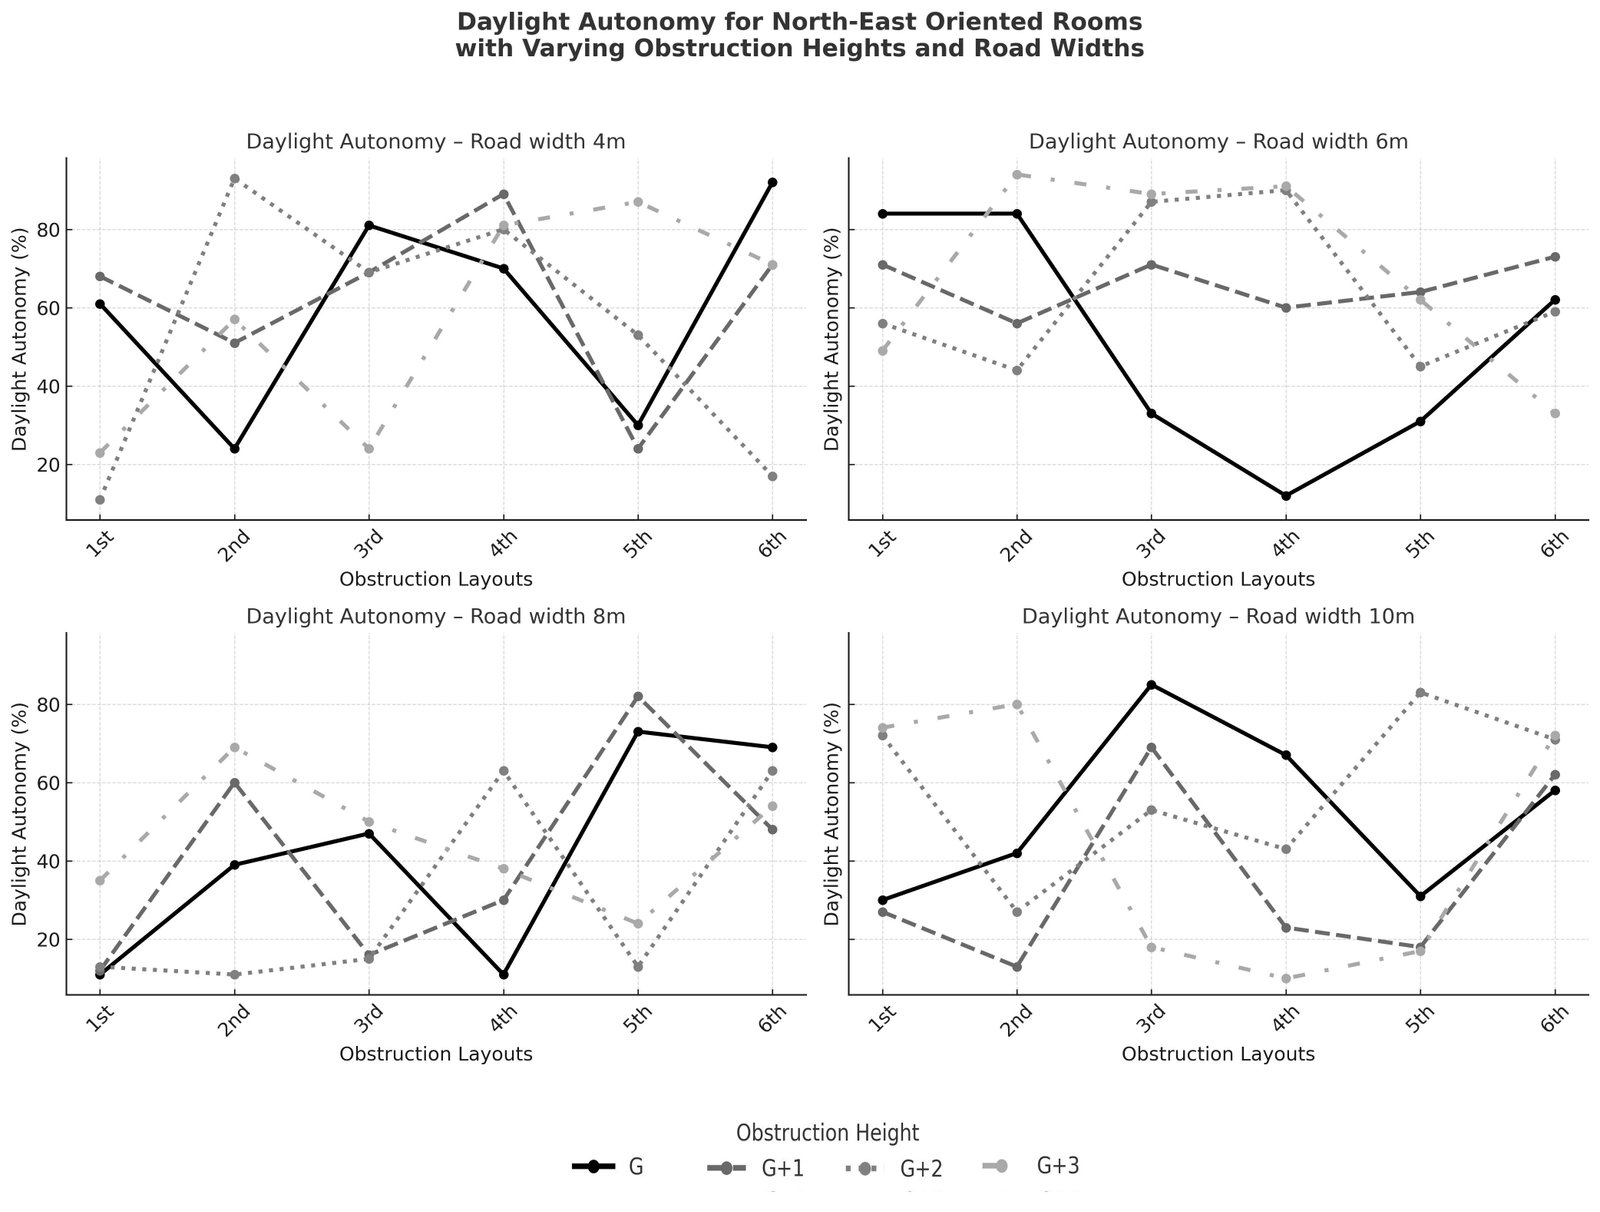
Fig. 4. DA performance for NE rooms across six layouts.
This analysis confirms that the geometry of urban obstructions plays a crucial role in daylight autonomy, particularly for rooms located in the northeast corner.
4.4. Specific influence in the South-West oriented room
The results for southwest-facing rooms (Fig. 5) indicate a notable sensitivity of sDA to both obstruction height and street width. In all layouts, increasing the obstruction height from G to G+3 floors results in noticeable decreases in sDA, especially at lower levels where shading from the obstruction is more pronounced. The reduction is particularly significant on narrow roads (4 m wide), where sDA values often fall below the recommended daylight sufficiency threshold.
Figure 5
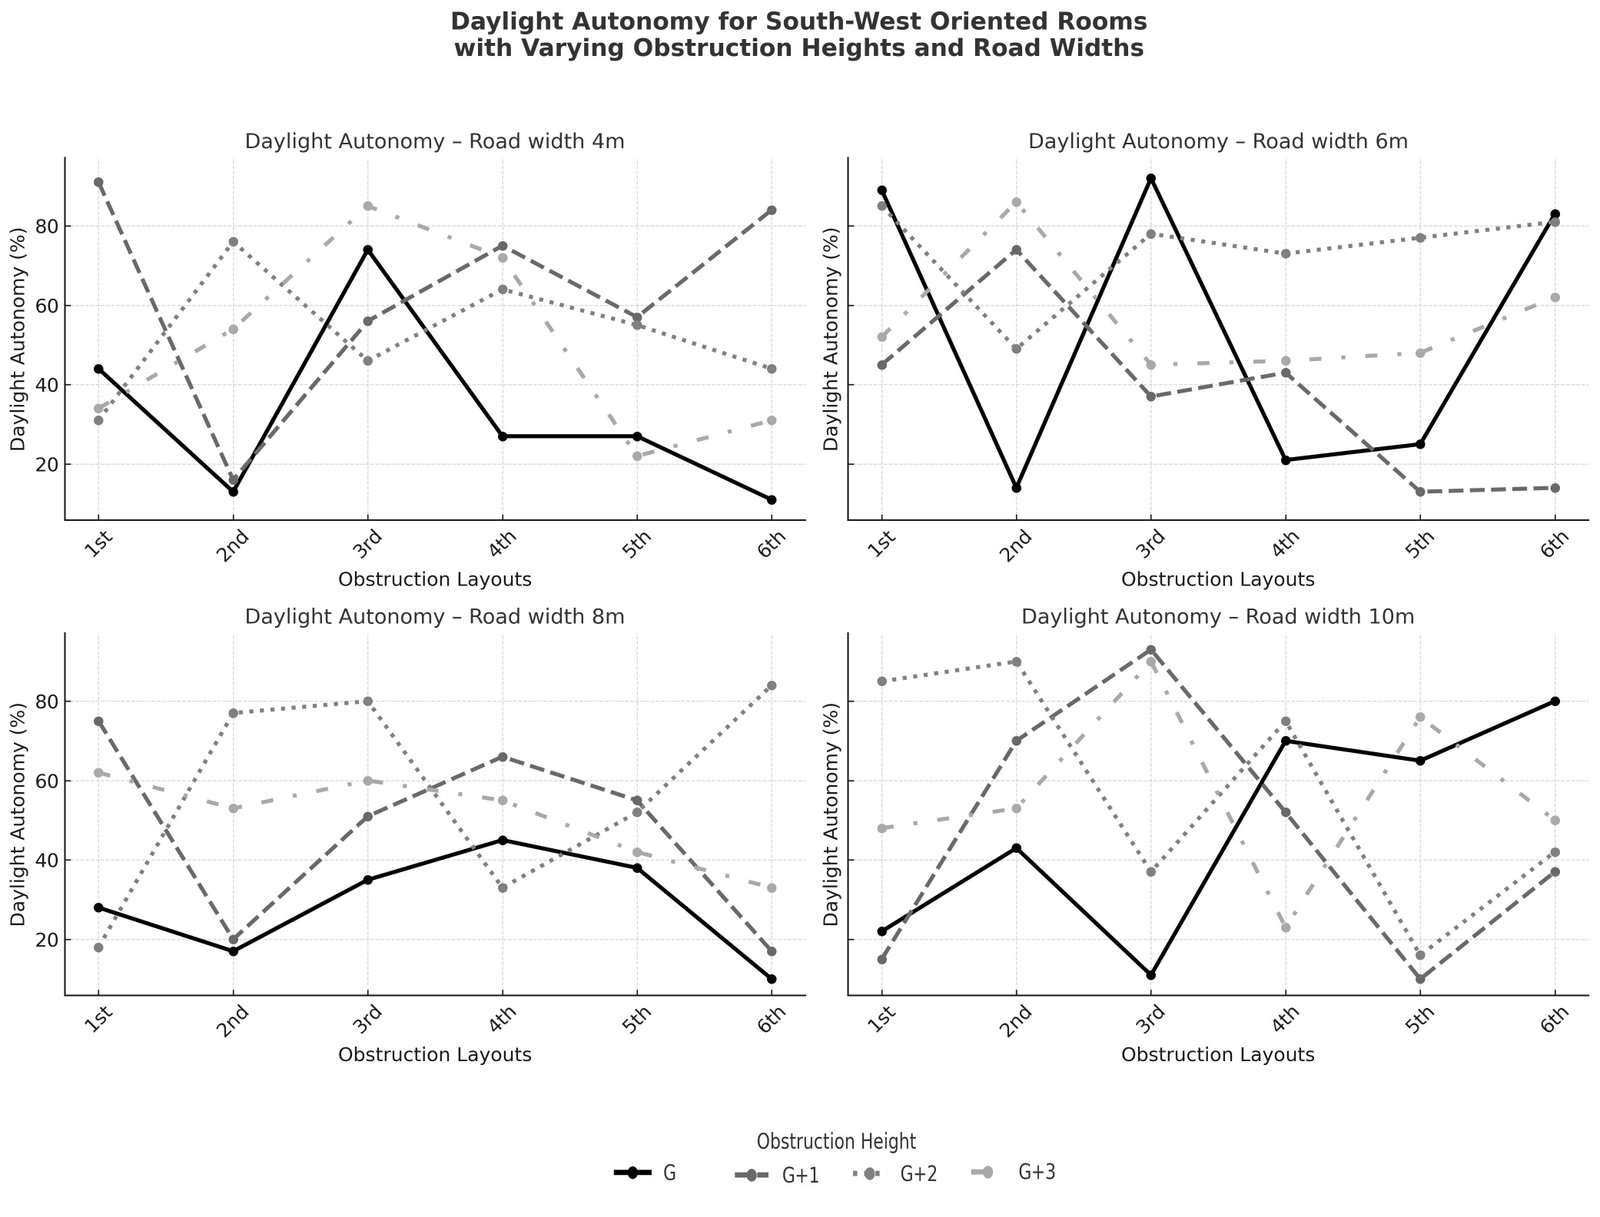
Fig. 5. DA performance for SW rooms across six layouts.
Figure 5, illustrates Daylight Autonomy for rooms facing southwest, with varying obstruction heights and road widths. Narrow streets, measuring 4 meters, combined with tall obstructions (G+3), result in the lowest sDA values, especially on the ground and first floors, indicating limited natural light. On wider roads (10 m), upper floors can reach about 80% sDA in some layouts, even with G+3 obstructions. This suggests that increasing setback distances can partly reduce the impact of taller nearby structures on daylight access.
In summary, units facing northeast are slightly more resistant to obstructions for sDA because of better morning sunlight and less intense afternoon sun. In contrast, southwest-facing layouts experience more significant performance drops when obstructed by the intense afternoon sun.
In contrast, wider roads or setbacks of 8 m and 10 m significantly improve daylight access, reducing the effect of taller obstructions. This promotes a more even distribution of daylight across layouts. Seasonal shading from the southwest orientation makes lower floors more vulnerable, as they receive less daylight than upper floors. This shows that orientation, obstruction height, and street width collectively affect overall daylight performance.
4.5. Daylight autonomy comparative analysis
4.5.1 General trends
A strong positive correlation exists between road width and daylight autonomy (Pearson’s , ). Wider streets ( 8 m) significantly reduce the shading effect of nearby buildings, whereas narrower streets ( 6 m) intensify it. Regression analysis confirms a strong linear relationship (R² = 0.82), emphasizing road width as a key factor influencing daylight autonomy.
Figure 6, presents a summary chart of the average sDA for six layouts, comparing NE and SW orientations. Ground floors consistently have the lowest values, ranging from below 10% at 4 m (G) to between 40% and 55% at 10 m (G+3). ANOVA analysis confirms that these differences across widths are statistically significant (F-test, p < 0.05). Effect size assessments (Cohen’s d > 0.8) indicate substantial improvements when moving from narrow to wide streets. The first and second floors show significant gains for roads or setbacks 6 m to 8 m wide (post-hoc p < 0.01). Meanwhile, third floors remain high above 70%, with SW spaces generally underperforming compared to NE due to later solar angles.
Figure 6
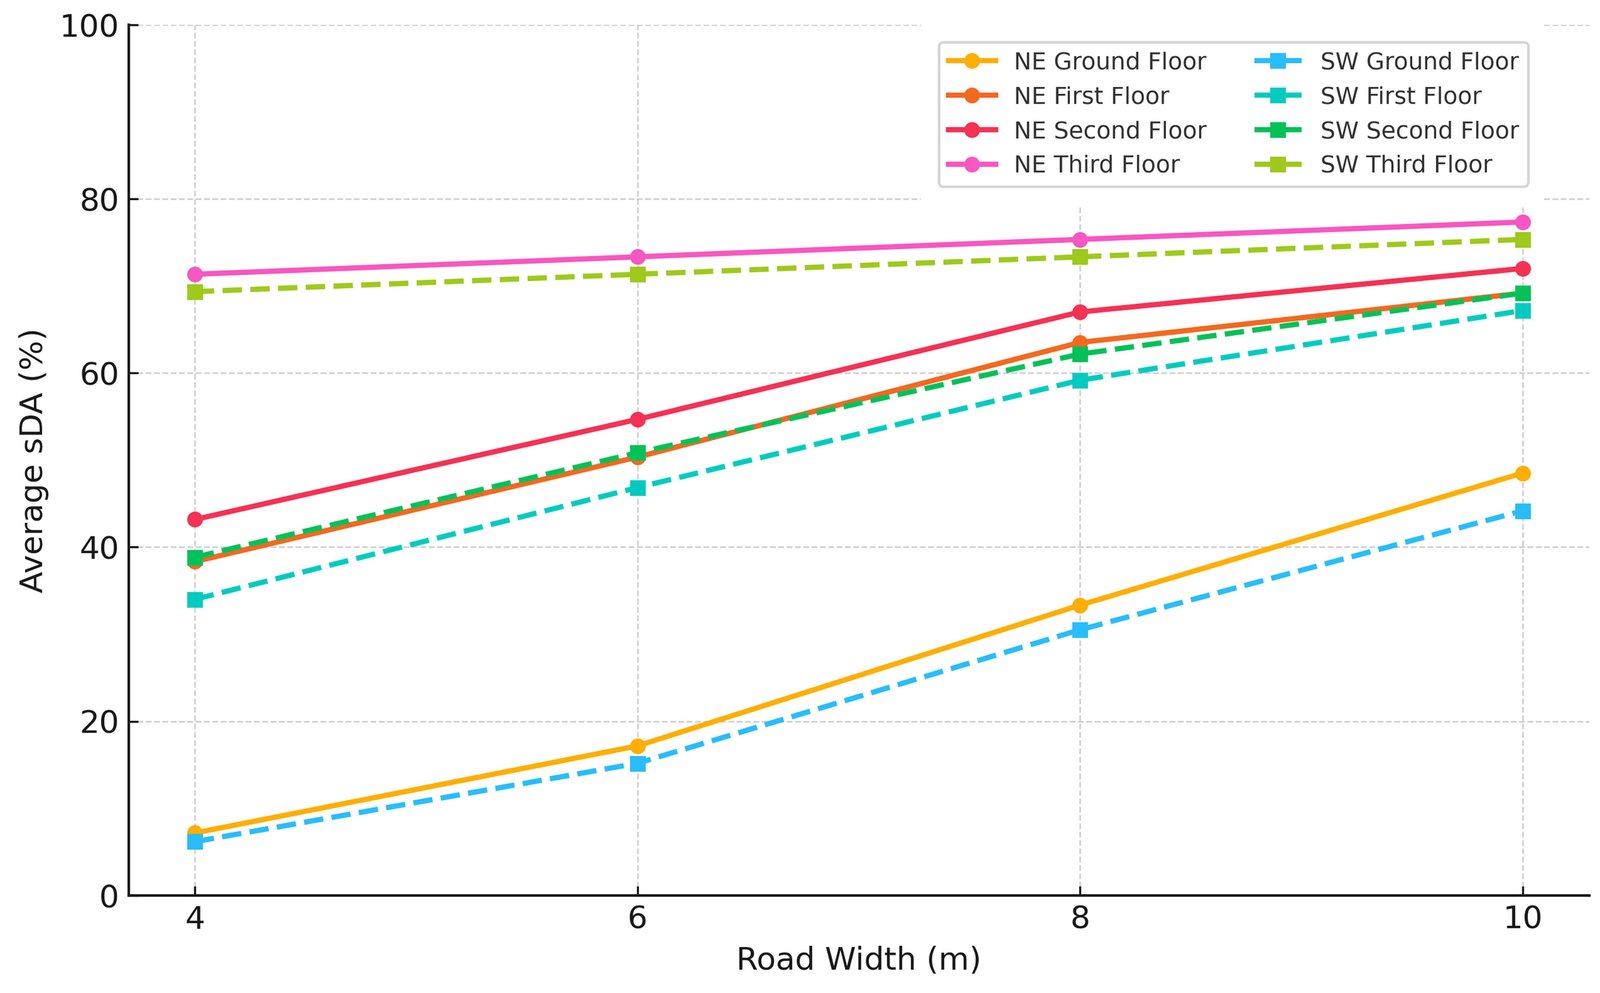
Fig. 6. Average sDA across road widths. NE vs. SW.
4.5.2 Obstruction sensitivity
Figure 7, shows the relationship between obstruction sensitivity and sDA across different road widths and orientations (NE and SW). Figure 7, indicates that obstruction height has the most significant impact on narrow roads (4 m wide), where steep slopes result in very low sDA values (<30% to 35%). As the road width increases, the slopes become gentler, reducing the impact of obstruction height. Consequently, sDA values improve, with NE layouts reaching approximately 65% to 80% and SW layouts around 55% to 70% at a 10 m width.
Figure 7
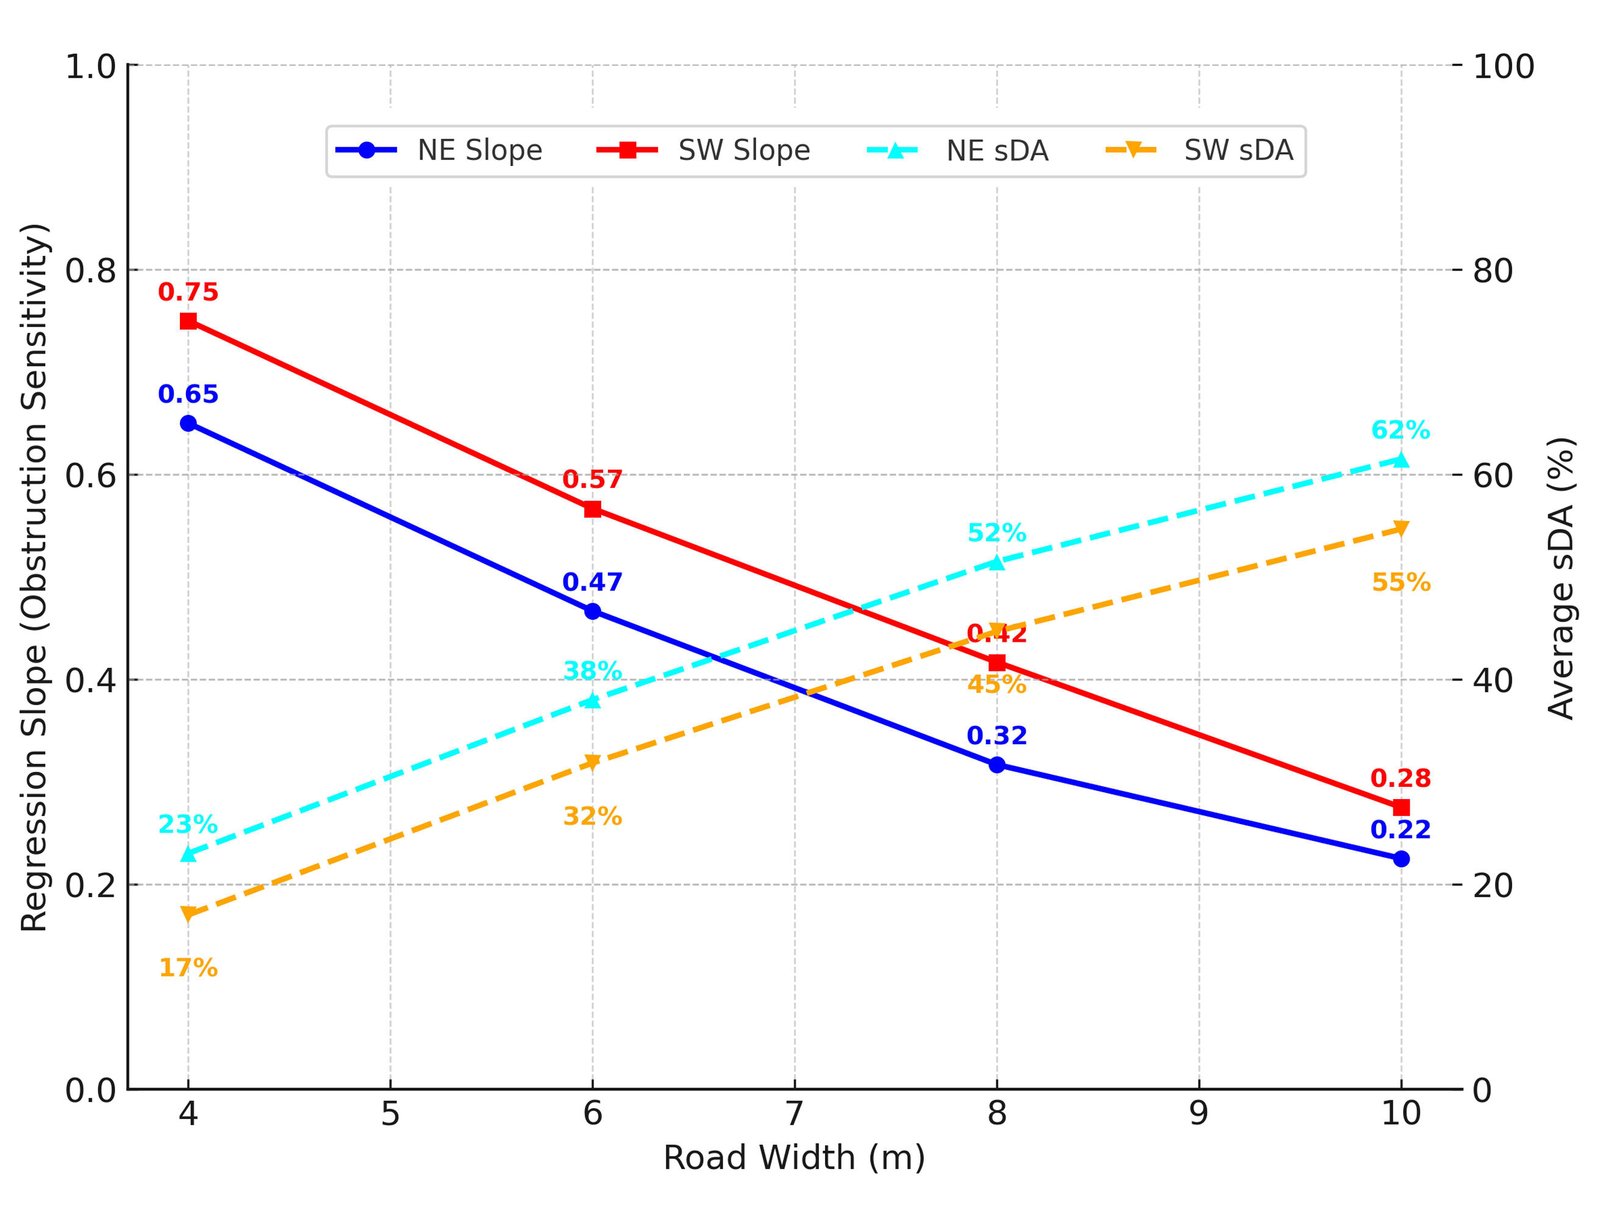
Fig. 7. Regression sDA vs. Road width – NE vs. SW.
An apparent effect of orientation becomes clear. The SW consistently shows steeper slopes and lower sDA, indicating a more substantial influence of afternoon solar angles. Meanwhile, NE demonstrates greater resilience, maintaining higher daylight sufficiency across all road widths. The combination of slope reduction and higher sDA levels at streets wider than 8 meters underscores the importance of street width in reducing obstruction effects. These findings highlight that setback regulations should not be applied uniformly and must consider orientation-specific performance trade-offs in dense tropical housing.
4.5.3 Layout performance
Layouts 2 and 4 show improved daylight performance compared to layouts 1, 5, and 6. This is because rooms in the centre receive more evenly distributed sunlight, while corner rooms are more prone to shading effects. Regression analysis indicates that approximately 20% of daylight variation is attributed to layout effects, while over 60% is caused by road width, highlighting the significant influence of street geometry. Orientation also affects daylight performance. Northeast-facing rooms experience consistent increases in sDA from the ground floor to upper levels, especially when road widths are 8 m or more. Conversely, southwest-facing rooms tend to have higher sDA on upper floors but are more affected by obstruction height and dense urban layouts. SW rooms also face the dual challenge of lower sDA and a higher risk of glare in the late afternoons. These findings emphasize the importance of road width, obstruction height, and orientation in influencing daylight performance. They emphasise the importance of planning strategies that incorporate minimum road-width standards, setback rules, and orientation-specific window placement. Implementing these measures can enhance daylight access and improve visual comfort in tropical residential buildings.
4.6. Daylight glare probability analysis
Daylight glare and autonomy were consistently assessed using DIVA-for-Rhino simulations and confirmed with IES-VE. For the glare assessment, key viewpoints were set at an eye level of about 1.2 m, located near the center of each room and facing the window.
This approach ensured that the Daylight Glare Probability (DGP) was measured from the view most affected by glare looking directly at the brightest window in every scenario. The analysis included urban obstruction geometry, obstruction distance, orientation, and surface reflectance properties to predict DGP in real-world conditions accurately. Results indicate that although external reflectance influences glare intensity, the primary factors affecting daylight glare comfort are orientation and the distance to obstructions.
4.6.1. External surface reflectance
Glare performance was assessed at two external reflectance levels: 30% and 65%, representing the typical lower and upper limits of façade reflectance in the region. Figure 8, displays the results for both levels. At 30% reflectance, facade surfaces reflected minimal daylight into indoor spaces, resulting in moderate glare primarily around window areas.
Figure 8
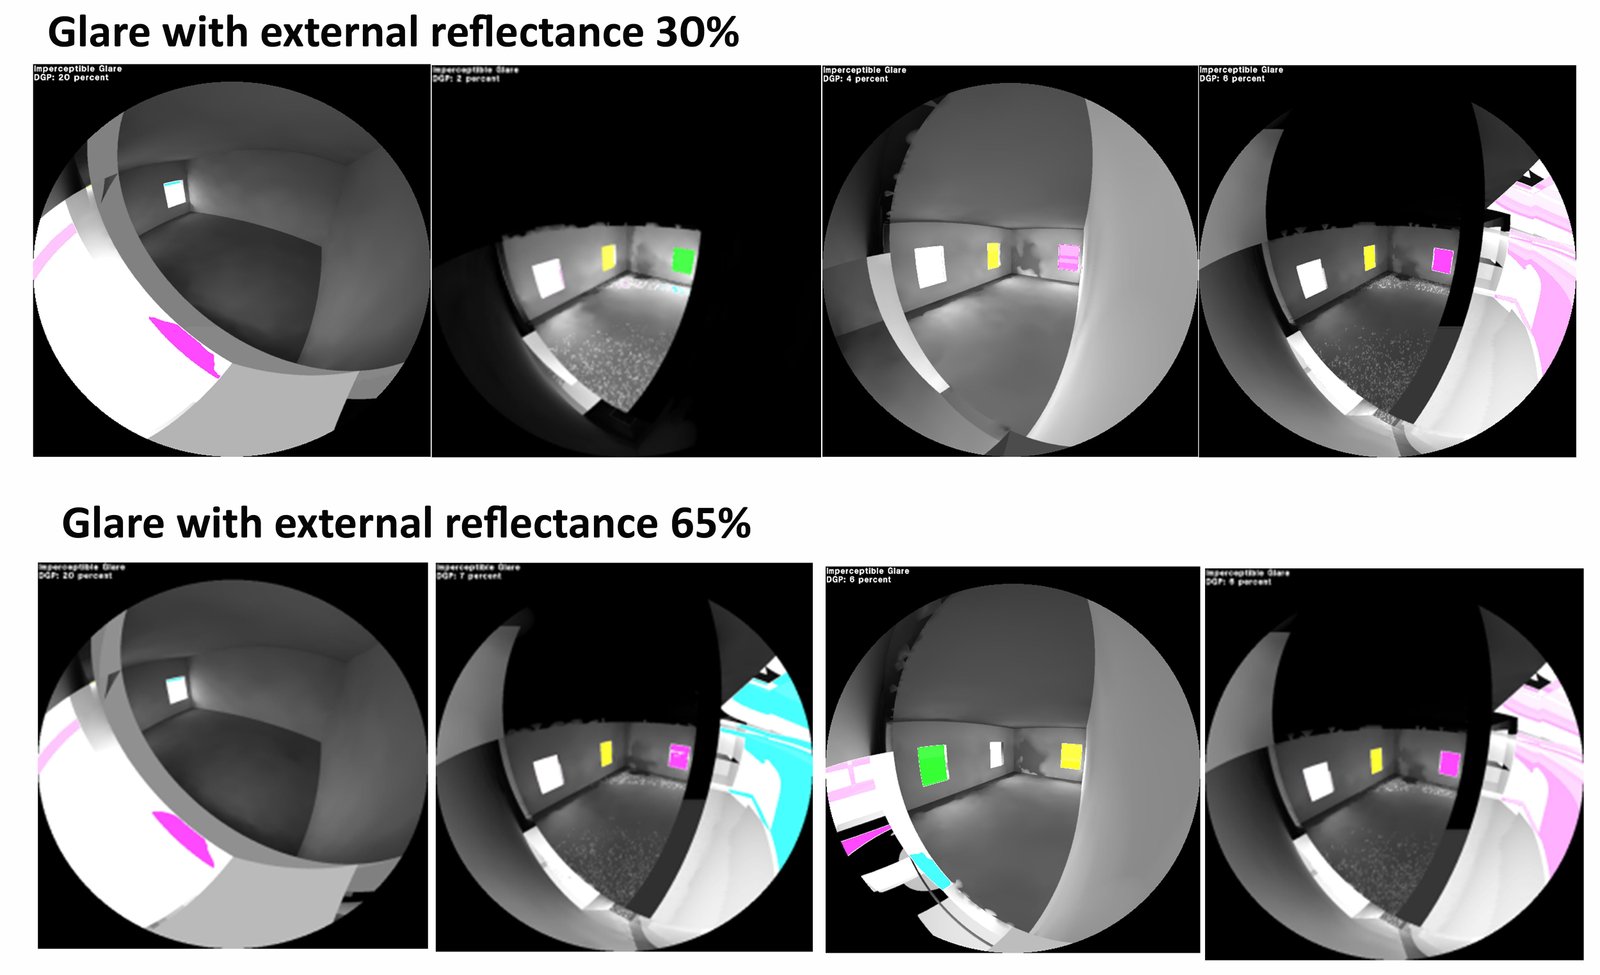
Fig. 8. Reflectance-induced glare.
Simulation results indicated that intolerable glare (DGP 0.45) occurred in less than 15% of occupied hours. Perceptible glare (0.35 DGP 0.40) and disturbing glare (0.40 DGP 0.45) together made up about 25% to 30% of total occupied time. At 65% reflectance, secondary reflections from nearby urban surfaces significantly increased luminance contrast, creating bright patches and expanding glare zones. Under these conditions, the occurrence of intolerable glare rose to 30% to 35% of occupied hours, with disturbing glare exceeding 25%. This indicates that while reflective surfaces enhance daylight penetration, they also increase glare discomfort, particularly in densely populated urban areas where reflective surroundings amplify secondary light effects.
4.6.2. Orientation effects
Orientation significantly affects both the timing and duration of glare, with notable differences between the north-east and south-west directions. In the North-East Orientation (Fig. 9), glare was most noticeable in the morning (06:00 am to 10:00 am), when direct sunlight entered the space. During this time, perceptible glare (0.35 DGP 0.40) occurred for 40% to 55% of occupied hours, while disturbing glare (0.40 DGP 0.45) was seen for up to 20%. Short bursts of severe glare (DGP 0.45) occurred mainly during summer, accounting for about 10% of the morning hours. After 10:00 am, over 80% of the day had minimal glare (DGP 0.35). This shows that the north-east orientation provides sufficient daylight with minimal glare, especially in the early morning.
Figure 9
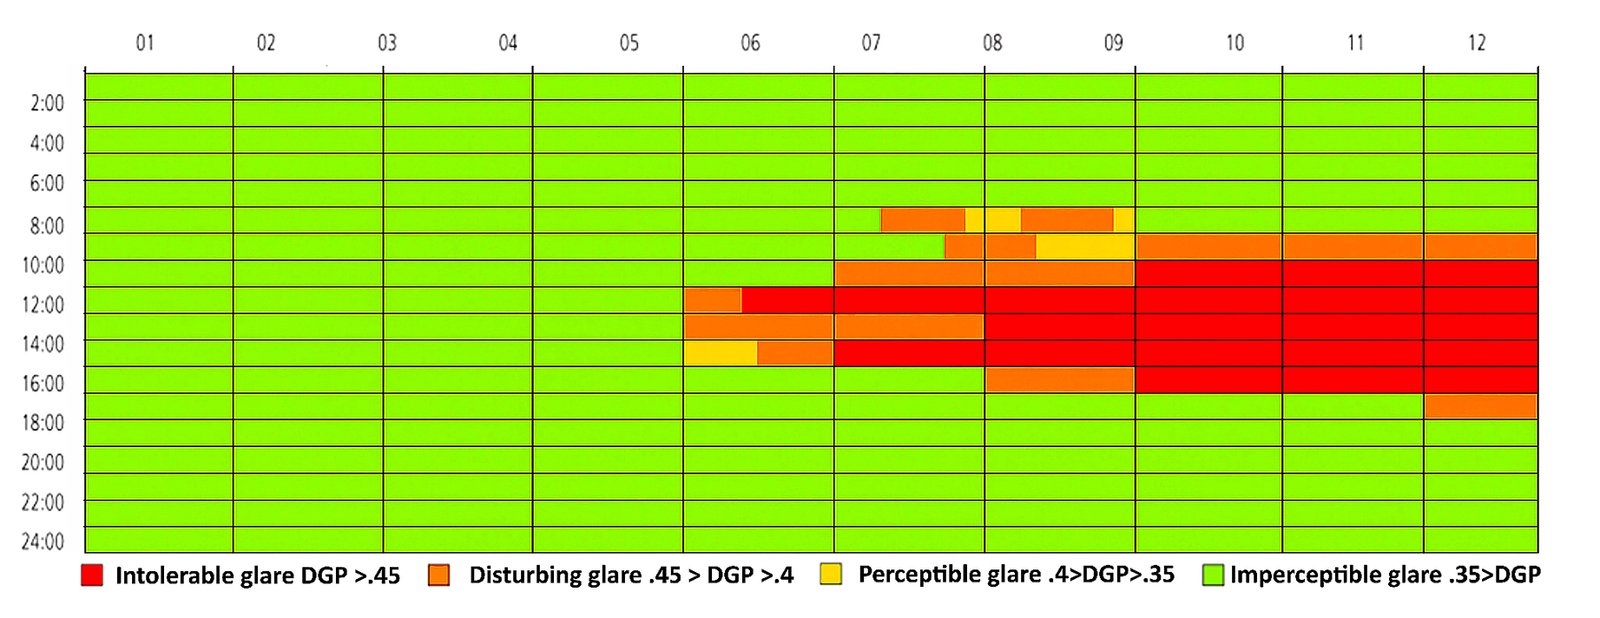
Fig. 9. Annual glare in NE-facing rooms.
In the South-West Orientation (Fig. 10), intolerable glare (DGP 0.45) occurred from 8:00 am to 6:00 pm, accounting for about 60% to 70% of occupied hours annually. The highest glare levels were recorded between March and September, coinciding with periods of intense solar exposure. During early mornings and evenings, glare levels were moderate. Approximately 20% to 25% of the day experienced either disturbing glare (0.40 DGP 0.45) or perceptible glare (0.35 DGP 0.40). Consequently, less than 10% of the time was visually comfortable. These findings confirm that south-west orientations consistently cause glare problems, regardless of reflectance levels, making them the most significant for visual discomfort.
Figure 10
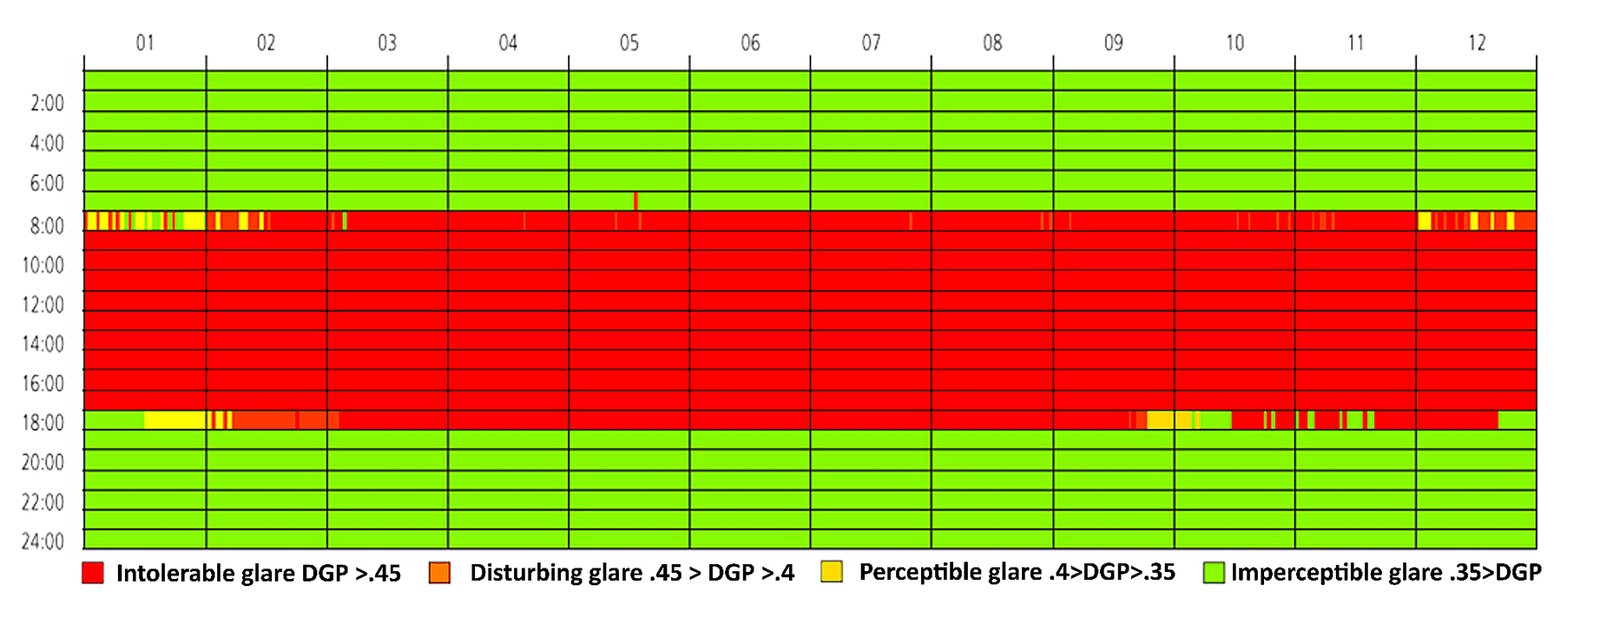
Fig. 10. Annual glare in SW-facing rooms.
4.6.3. Urban obstruction geometry
Glare probability was analysed across six obstruction configurations by varying building heights (G, G+1, G+2, G+3) and road widths (4 m, 6 m, 8 m, 10 m). The results shown in Figure 10 demonstrate that the geometry of obstructions has a significant influence on the distribution and intensity of glare. On the northeast ground floor, Rooms (Fig. 11), the G+3 building with a 4-meter-wide road causes severe glare, with a DGP 0.45, affecting up to 25% to 30% of the morning hours. Additionally, it causes glare disturbance 20% of the time, with a DGP ranging from 0.40 to 0.45. As road widths increase from 8m to 10 m, excessive glare drops to under 15% during morning hours, shifting more than half of the occupied time into the perceptible or imperceptible range. On the upper floors, especially the 2nd and 3rd levels, intolerable glare rarely exceeds 10% with wider setbacks. This indicates that increasing obstruction spacing can effectively reduce glare for north-east facing orientations.
Figure 11
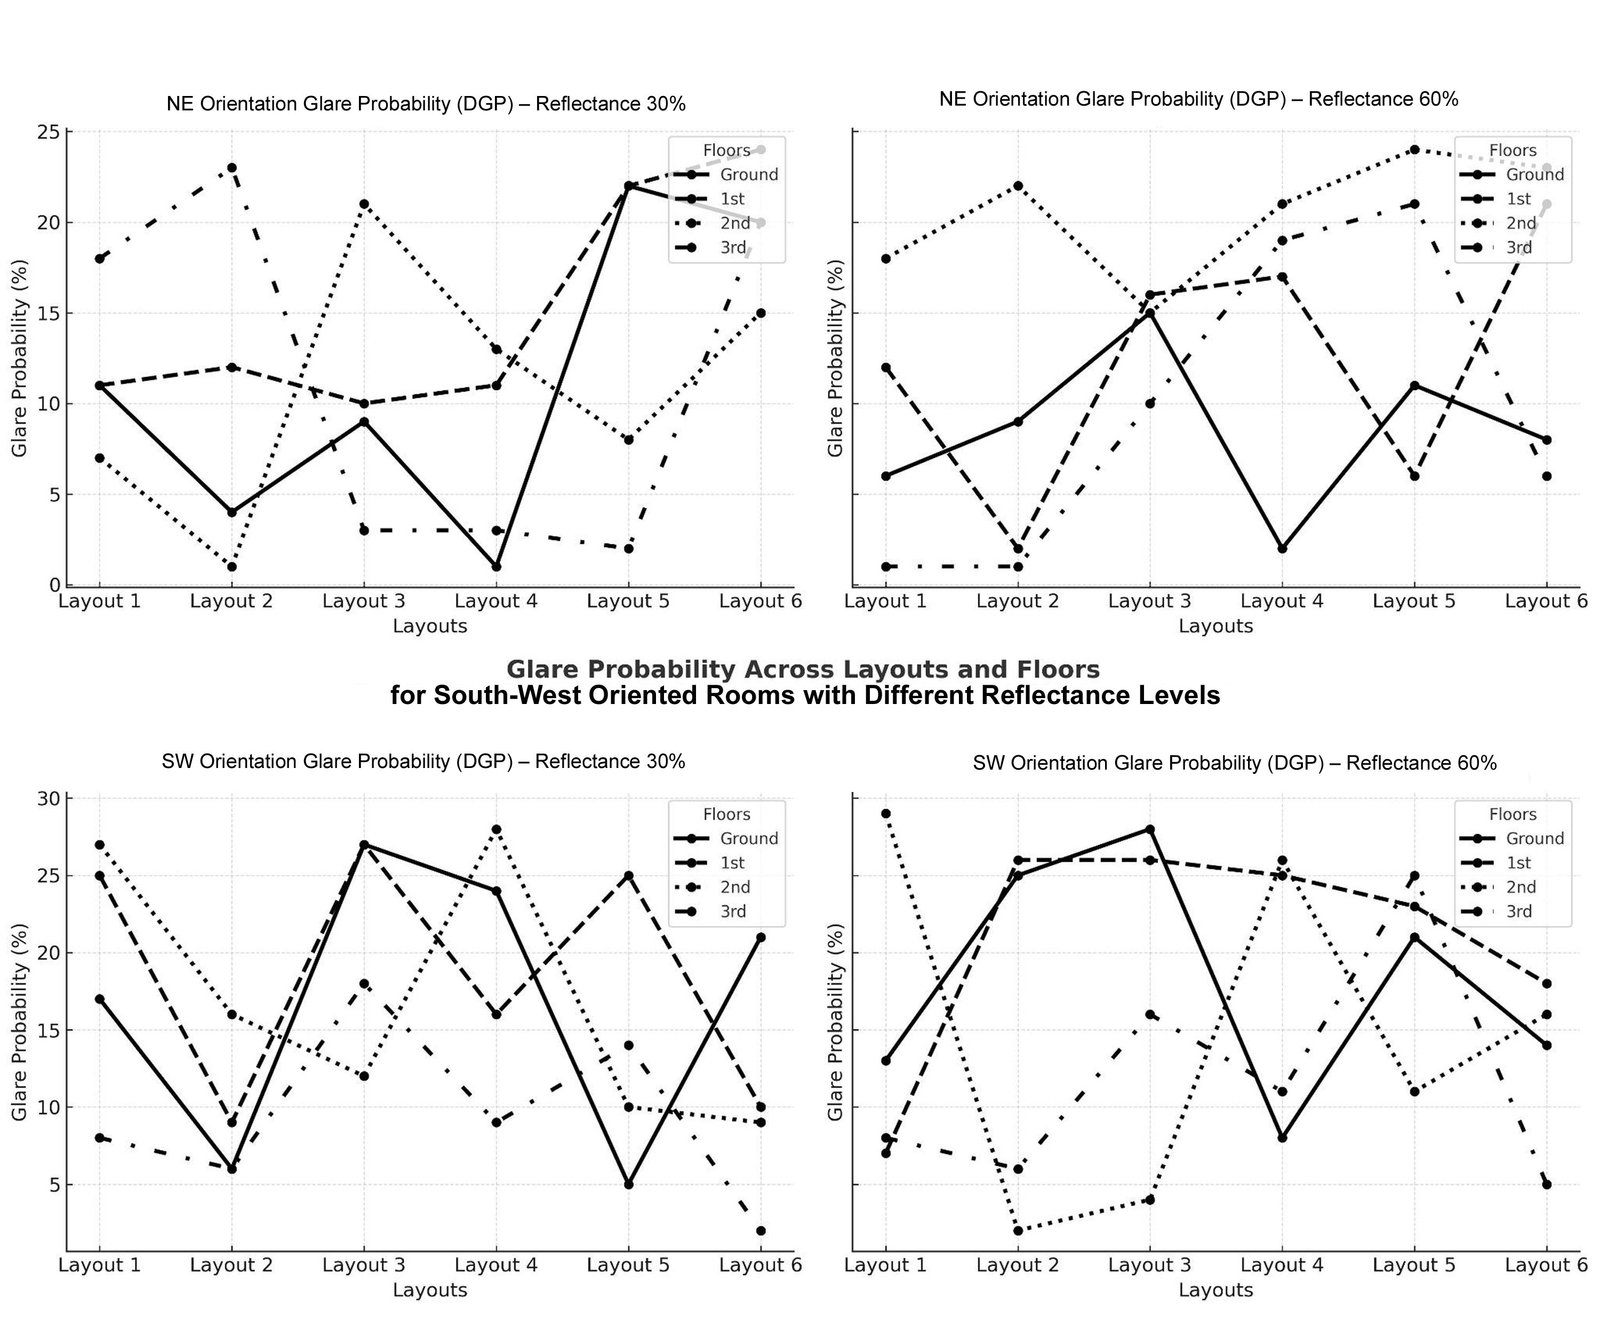
Fig. 11. NE–SW glare probability by layout and floor.
In the South-West rooms (Fig. 11), daylight was more significantly affected by the distance of obstructions. On the ground floor, with G+3 obstructions and 4-meter-wide streets, glare was unbearable for over 70% of the occupied hours, while less than 10% of hours experienced imperceptible glare. Widening the road from 8m to 10m reduced the unbearable glare but did not eliminate it. The glare persisted for 50% to 55% of the day, highlighting the persistent intensity of southwest exposure. On the second and third floors, glare levels remained high. Severe glare occurred for 60–65% of the day, despite widening the road to 10 m. These findings suggest that while increasing the spacing between obstructions can decrease glare, it does not eliminate it in this orientation.
Results indicate that rooms in the northeast experience a significant reduction in glare as road widths increase. At higher floors, NE reaches acceptable glare levels (<10% intolerable glare) with a 10m street width. Conversely, southwest rooms remain highly susceptible to glare, with unacceptable levels consistently exceeding 45% to 70%, even at the same road widths and with lower obstructions. This emphasizes the need for adequate daylight in dense tropical urban areas. The heat map (Fig. 12) reveals unacceptable glare levels in northeast- and southwest-facing rooms, which are affected by various obstruction heights (G–G+3) and setback widths (4m to 10 m). Data show that northeast rooms generally stay within comfort thresholds, with intolerable glare below 15% at road widths of 8m to 10 meters and even under G+3 obstructions. Conversely, southwest-facing rooms consistently experience high glare, with values exceeding 40% to 70% across all obstruction scenarios, underscoring their vulnerability. The heatmap illustrates how orientation and urban form influence visual comfort. These findings highlight the importance of adopting orientation-specific adaptive daylighting strategies in tropical city environments.
Figure 12
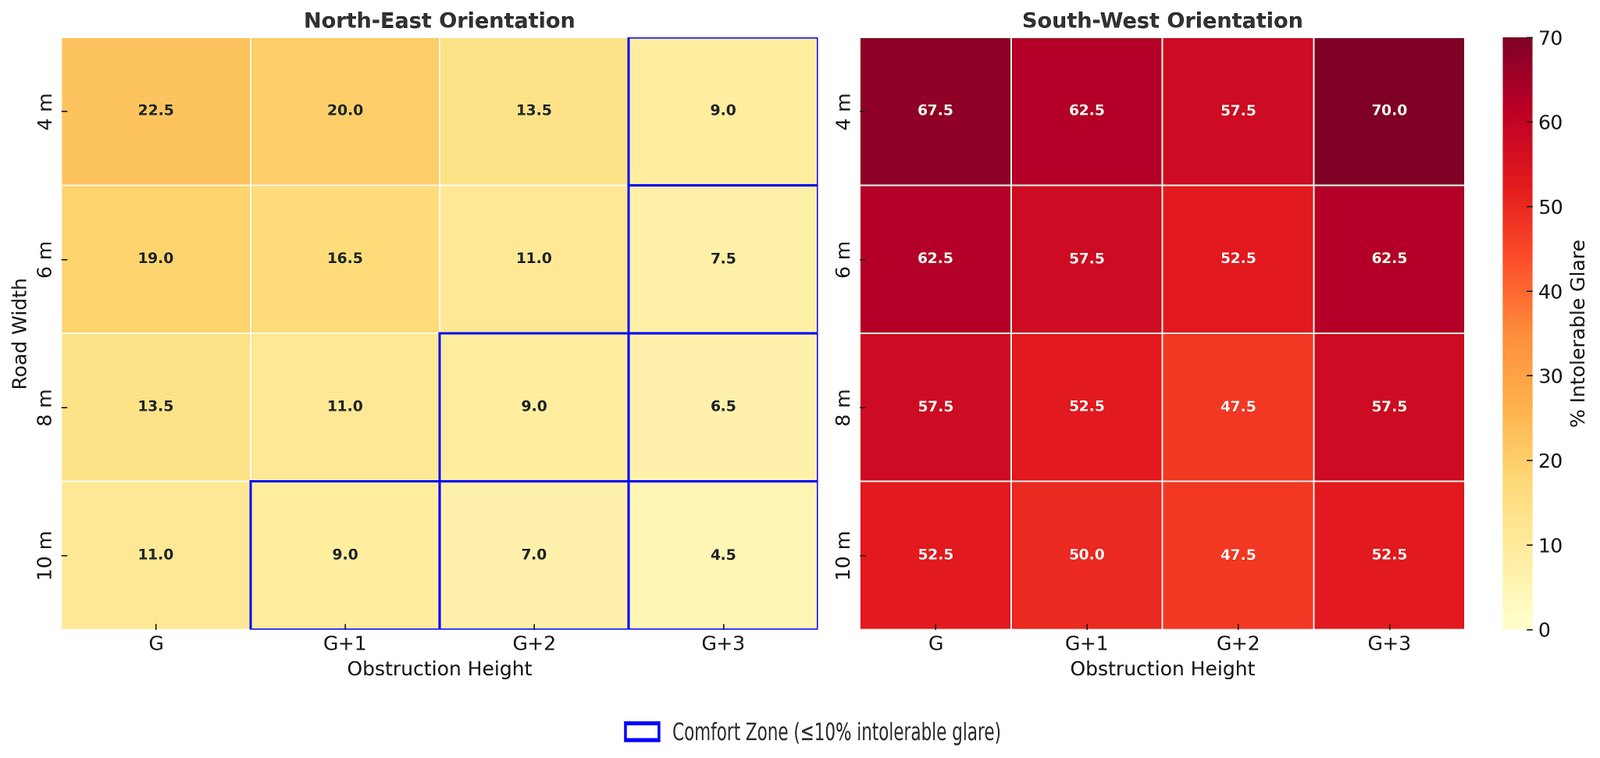
Fig. 12. NE-SW glare intolerance map.
4.6.4. Orientation-wise comparative analysis of DGP
The study demonstrates how obstruction geometry and surface reflectance jointly influence indoor daylight access across various orientations. North-east orientations receive diffuse morning sunlight, offering balanced daylight autonomy with only a moderate risk of glare. Conversely, rooms facing southwest receive intense afternoon sunlight and are much more prone to glare, particularly on upper floors. Surface reflectance of obstructions has a significant impact on glare in both orientations. As obstruction reflectance increases from 30% to 65%, glare intensifies on every floor and across all layout types. This effect is especially pronounced in upper-level layouts facing narrow road widths.
Table 2, reveals substantial daylighting differences between north-east and south-west orientations. North-east rooms strike a balance, providing adequate daylight with moderate glare, especially on upper floors. Conversely, south-west rooms experience persistent high glare levels, despite good daylight autonomy. This discomfort worsens on higher floors due to afternoon sunlight and nearby reflective surfaces. These insights indicate that NE orientations require strategies to balance daylight and glare. In contrast, SW orientations necessitate stronger glare-control measures, such as low-reflectance facades, external shading, and orientation-sensitive fenestration.
Table 2
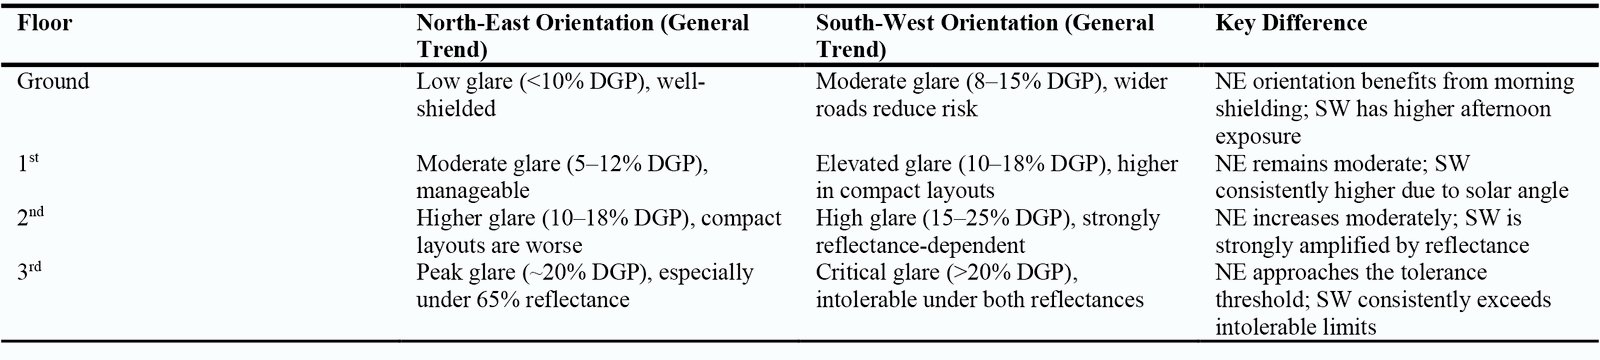
Table 2. Comparative summary of glare probability (DGP) for NE and SW.
4.6.5. Occupant perception
The occupant survey, with 57 participants, revealed notable variations in daylight perception across floors. The sample had a balanced gender distribution (56% female, 44% male) and included diverse occupational backgrounds: 40% professionals, 29% homemakers, 13% students, and 4% retirees. Results showed that 50.9% of participants are sensitive to glare, highlighting it as a primary comfort issue.
The occupant survey (Fig. 13) revealed clear differences between floor levels. Ground-floor residents (n = 15) mainly reported insufficient daylight (92%) due to obstructed sky views and limited natural light penetration. In contrast, third-floor occupants frequently reported glare and overheating, which aligns with their higher exposure to daylight. The middle floors had a more balanced perspective: residents on the first and second floors generally found conditions acceptable, although they occasionally experienced glare during peak sunlight hours.
Figure 13
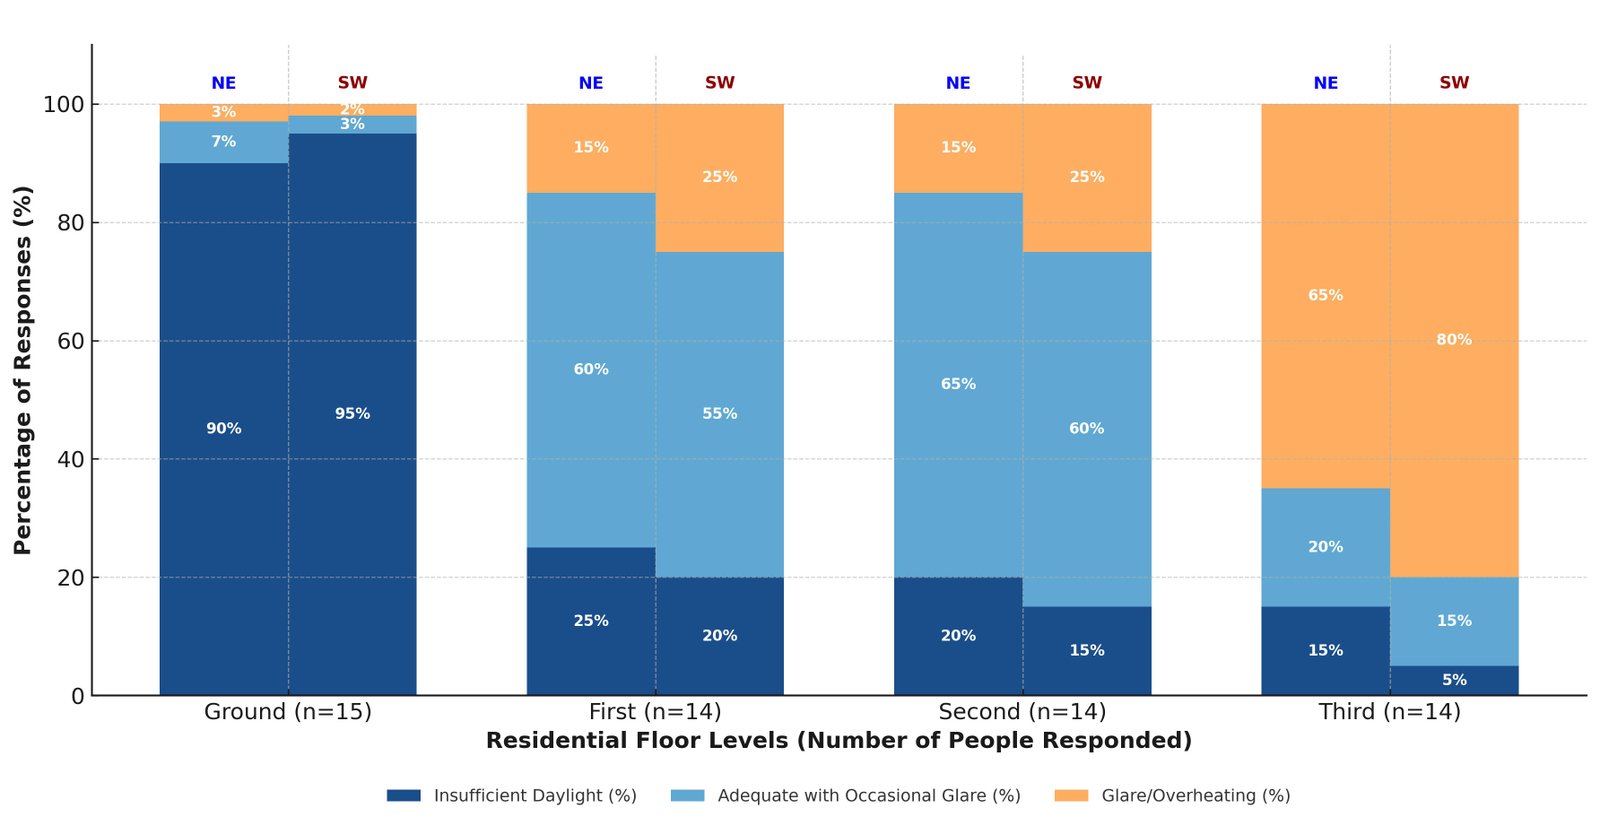
Fig. 13. Occupant perceptual feedback.
User observations specific to each floor largely aligned with the simulation results. Ground-floor units were often described as receiving “too little light,” while upper floors experienced consistent midday glare, matching the models' predictions of vertical daylight stratification. Notably, occupant feedback was closely aligned with the simulation recommendations. In 85% of cases, residents identified the same window configurations as optimal that the models predicted, confirming the accuracy of the simulation outcomes.
5. Discussion
5.1. Spatial daylight autonomy
Analysis of 1,152 simulations revealed a strong correlation between obstruction proximity and daylight sufficiency (R² = 0.87, p < 0.001). Daylight performance decreases significantly in tropical urban areas with narrower streets or nearby obstructions. In northeast-facing locations, a 4 m setback resulted in a 67% reduction in sDA compared to unobstructed conditions. In such situations, daylight sufficiency often fell below 30%, failing to meet the recommended standards. When the setback distance or road width increased to 10 m, daylight loss reduced to 23%. This indicates that larger spacing between buildings greatly improves daylight performance.
The heatmap (Fig. 14) clearly shows orientation-related differences in daylight autonomy. NE-facing layouts consistently achieved good sDA values above 45% even with G+2 obstructions. When the road width increased to 10 m, their sDA values improved further to 65–77.5%. Conversely, SW-facing layouts performed well at wider separations, reaching up to 80% sDA. However, their performance sharply declined to below 25% as the road width decreased to less than 6 m. The most critical scenario was with a 4 m road and a G+3 obstruction, where SW orientations dropped to 5% sDA, while NE orientations still maintained 17.5%.
Figure 14
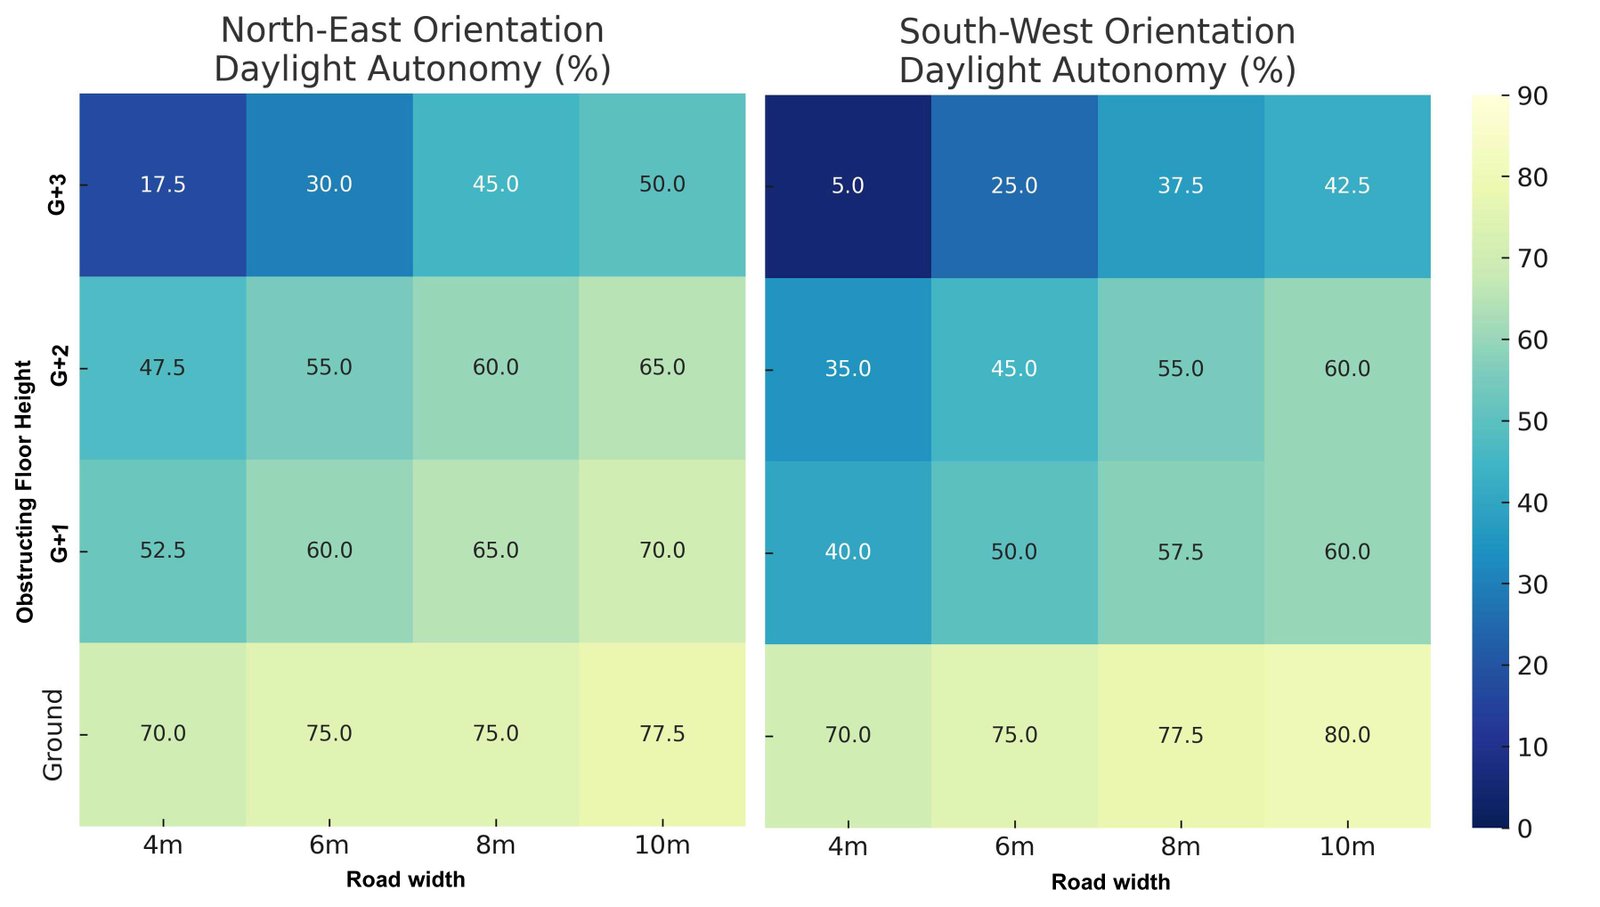
Fig. 14. Orientation-wise DA heatmap.
5.2. Vertical and horizontal daylight stratification
The sDA analysis revealed a clear vertical stratification pattern across all street-width scenarios. Ground floors exhibited the lowest performance with a mean sDA of 28.4 ± 5.2%, which is below the recommended adequacy threshold of 50%. Daylight levels increased on the first (41.7 ± 8.1%) and second floors (47.9 ± 7.3%), but both remained under the threshold. From the second floor upward, daylight sufficiency reached 58.2 ± 6.4%, accompanied by a noticeable rise in glare. Tukey’s HSD post-hoc tests (Table 3) confirmed significant differences between all floors (p < 0.01), indicating substantial vertical variation in daylight performance.
Table 3
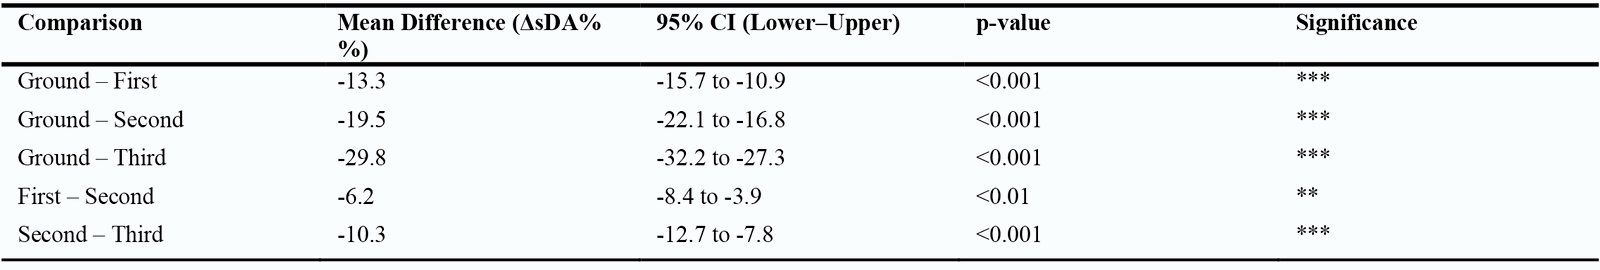
Table 3. Tukey HSD floor-level comparisons of sDA.
A two-way ANOVA was conducted with floor level (G to G+3) and road width (4 m, 6 m, 8 m, 10 m) as the variables. The results (Table 4) showed significant effects of both floor level (F (3,384) = 156.8, p < 0.001, η² = 0.51) and road width (F (3,384) = 112.6, p < 0.001, η² = 0.42). A significant interaction was also observed (F (9, 384) = 18.3, p < 0.001, η² = 0.17), indicating that both factors jointly influence daylight, rather than acting independently.
Table 4
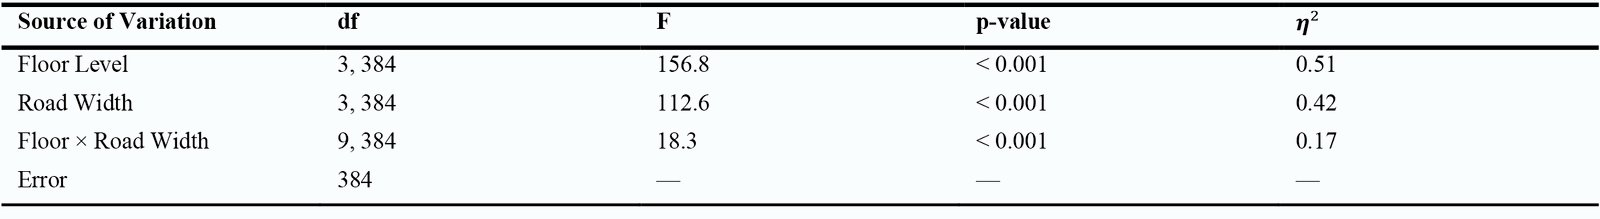
Table 4. Two-Way ANOVA for Daylight Autonomy (sDA).
The study confirms that both obstruction height and street width significantly and interactively affect daylight penetration in interior spaces in dense tropical areas. This highlights the essential vertical and horizontal design standards to improve sDA performance across the floors of mid-rise buildings in tropical high-density environments.
5.3. Visual comfort and glare assessment
The ground floor has very little glare at 2%, as nearby obstructions shield it from direct sunlight. This matches occupants' reports of insufficient daylight rather than discomfort due to glare. Glare levels rise significantly with height, increasing from 4.3% on the first floor to 6.7% on the second floor, then sharply jumping to 20.4% on the third floor. This creates a clear divide between the second and third floors, where glare becomes the primary visual concern.
The façade reflectance intensifies the vertical distribution of glare across floors. When reflectance increases to 65%, mid-level floors experience a 250% increase in glare compared to 30% reflectance, despite adequate daylight levels (sDA 55–65%). This indicates that glare at intermediate levels is highly sensitive to surface reflectivity, with sufficient daylight overlapping the discomfort risk. On higher floors, glare is primarily caused by direct sunlight (DGP > 0.35), indicating that shading strategies are effective.
The study also found that glare is strongly affected by orientation. SW-facing layouts experienced nearly three times more glare than NE-facing ones (p < 0.001), mainly because of intense tropical afternoon solar exposure. NE-oriented rooms are filled with diffuse morning light, keeping DGP values below 0.30 in most cases. On the other hand, despite wider roads, SW-facing rooms exceeded glare comfort limits. This shows that orientation influences glare as much as obstruction distance, highlighting the importance of direction-sensitive daylight strategies.
The results revealed a clear trade-off between daylight and glare. Wider streets improved daylight autonomy on all floors. At the ground level, sDA increased from 17.5% at 4 m to over 50% at 10 m. At the same time, DGP values on the upper floors rose from 0.32 (6 m) to 0.42 (10 m). This indicates that increasing daylight access can also raise the risk of glare. The analysis identified two key thresholds in daylight performance.
- A minimum street width of 8 meters or more is set to ensure sufficient daylight, ensuring that the sDA exceeds 40% on lower floors.
- Starting from the third floor, buildings consistently achieve high daylight sufficiency (sDA > 70%) but also suffer from persistent glare (DGP > 0.35). This suggests that upper floors are naturally more prone to glare, regardless of the obstruction's shape or placement.
The results confirm that daylight sufficiency and glare risk are interconnected and must be managed together. Effective daylight design must balance both. First, a minimum street width of 8 meters is necessary to maintain daylight sufficiency with appropriate glare control. Beyond the second floor, glare must be controlled using shading devices, low-reflectance urban façades, or adaptive glazing. In dense tropical settings, optimizing building orientation and urban form through integrated design ensures visual comfort and equitable daylight access across all floors.
5.4. Validation of sDA and glare analysis
Validation aims to identify the connection between simulations and occupant responses (Table 5). The study showed a strong link between sDA and occupant daylight satisfaction (ρ = 0.82, p < 0.001, n = 57). A 30% sDA threshold was identified as a critical point; below this level, over 90% of ground-floor residents reported insufficient daylight. This finding is important because it confirms that the simulation threshold aligns with user perception. On the ground floor, where sDA fell below 28% due to G+2 and G+3 obstructions, 92% of occupants said their spaces had “too little light”. This supports the predictive reliability of the sDA benchmark.
Table 5
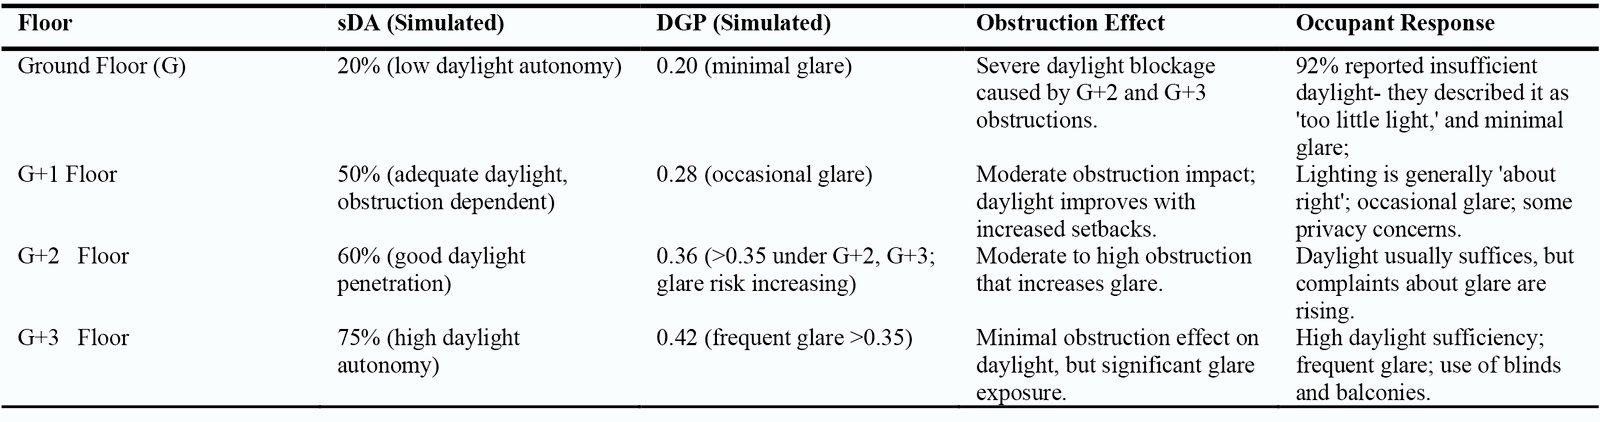
Table 5. Validation of obstruction effect on sDA and DGP with occupant feedback.
DGP analysis showed a strong link between DGP values and occupant glare perception (ρ = 0.79, p < 0.001). A DGP threshold of 0.35 was identified as the point at which glare discomfort increased significantly. This threshold was consistently exceeded on the second and third floors, with DGP values ranging from 0.36 to 0.45, aligning with occupant reports of glare discomfort. Although the sDA exceeded 70%, meeting LEED and EN 17037 standards, 78% of residents on the third floor still experienced persistent glare issues. This indicates that daylight sufficiency alone does not ensure occupant comfort without effective glare management.
The study found that urban obstructions affect indoor daylight performance in tropical compact mid-rise apartments in both positive and negative ways. On lower floors, taller obstructions (G+2, G+3) reduced daylight sufficiency (sDA < 30%) but helped prevent glare (DGP < 0.25). Conversely, on upper floors, shorter obstructions increased daylight autonomy (sDA > 70%) but caused persistent glare (DGP > 0.35). Occupants managed these conditions with blinds, curtains, and balcony shading, which matched the simulation results. This study demonstrates that comparing survey data with simulation results shows these metrics genuinely reflect real human experiences rather than just theoretical performance indicators.
Along with the affirmation of sDA and DGP simulated with occupant response (Table 5), the following key occupant perceptions strongly support the floor-specific stratified daylight guidelines.
- 92% of ground floor occupants reported inadequate daylight, consistent with sDA < 30% and low glare.
- On the first floor, lighting is perceived as “sufficient,” with sDA 40–55% and occasional glare (DGP = 0.25–0.32).
- On the second floor, residents experienced adequate daylight (sDA 55–65%) but noted increasing glare complaints, especially where DGP exceeds 0.35 under G+2/G+3.
- On the third floor, occupants experience high daylight availability (sDA > 70%), but frequently encounter glare discomfort, with DGP values between 0.38 and 0.45.
The results demonstrated a strong correlation between the simulation outputs and occupant feedback. Eighty-five percent of residents agreed with the predicted optimal layouts, confirming that the model accurately reflected perceived visual comfort. Overall, the study affirms sDA as a reliable measure of daylight adequacy and DGP as an effective predictor of visual discomfort in tropical housing.
5.5. Summary of findings compared to previous research
In line with previous studies, daylight distribution in the selected mid-rise apartment is significantly influenced by the shapes, distances, street layout, floor heights, and orientations of obstructions [68-72]. This study confirms a nonlinear relationship between daylight sufficiency (sDA) and glare probability (DGP), consistent with earlier research indicating that brighter spaces generally have a higher glare risk [69,70]. In SW rooms on the second and third floors, DGP values ranged from 0.38 to 0.45, surpassing the discomfort threshold of 0.35 due to intense afternoon sunlight. Surveys confirmed these findings, with 78% of upper-floor SW residents reporting frequent discomfort due to glare. This pattern aligns with orientation-specific trends observed by Chien & Tseng [68] and Sun et al. [70]. NE-oriented rooms proved more effective under similar obstructions, showing 25% higher sDA and DGP values below 0.30, supporting previous urban canyon studies [68,70].
A 4-meter-wide street with G+3 obstructions reduced the ground-floor sDA to 17.5%, but expanding the street to 10 meters increased it by over 30%. This change in daylight performance relative to street profile aligns with previous research on the H/W–SVF relationship [1,23,73,74], suggesting that wider streets improve the sky-view factor and enhance daylight access. Wider spacing obstructions improved daylight access but increased DGP from 0.32 to 0.42 at upper levels, confirming the daylight–glare trade-off reported in prior studies [69-71]. As observed by Šprah et al. [13], beyond the third floor, direct solar gains exceeded the effects of reflectance. Raising reflectance to 65% increased DGP by as much as 250% on mid-level floors, confirming Šprah, et al. [13]'s findings that bright façades enhance luminance contrast in canyon environments. Therefore, adding moderate reflectance (30–45%) along with upper-level shading elements such as overhangs, fins, and selective glazing, as recommended by Czachura et al. [23,75] and Šprah & Košir [76], can improve daylight conditions.
Ground floors in compact areas experience low sDA (<30%) with minimal glare, while first- and second-floor units have moderate sDA (40–65%) and higher glare levels (DGP 0.25–0.36). These results align with those reported by Chokhachian et al. [73] and Nasrollahi & Rostami [1]. Additionally, this study observed that upper floors achieved high daylight autonomy (sDA > 70%) and persistent glare (DGP > 0.35), as noted by Chien & Tseng [68] and Koster et al. [74]. Taller G+2–G+3 obstructions reduce ground-floor daylight sufficiency (sDA < 30%) and lower mid-level glare by up to 40%, consistent with findings by Sun et al. [70], Aydin & Ünver [51], and Nasrollahi & Rostami [1]. Using height modulation and site-specific setbacks effectively balances daylight access and visual comfort, as noted by Ng [77]. This confirms that obstructions serve as contextual regulators rather than mere barriers, influencing both daylight adequacy and comfort. In line with previous research, this study demonstrates that daylight levels vary by floor height and emphasizes that daylight design should be tailored to local conditions.
As suggested by Czachura et al. [23,75], Hraška & Čurpek [78], Šprah & Košir [76], and Kılıç & Yener [79], this study examined daylight performance by integrating performance-oriented, context-specific factors. The findings support the adoption of performance-oriented daylight frameworks, utilising context-specific benchmarks (e.g., modified VSC or EN 17037), which are crucial for managing daylight and glare in multi-story residential environments [79-81].
5.6. Knowledge contribution and practical implications for daylight design and urban policy
This research emphasizes spatial Daylight Autonomy (sDA) and Daylight Glare Probability (DGP) as key benchmarks for daylight performance in tropical housing. An sDA below 30% indicates inadequate daylight, while a DGP above 0.35 suggests potential glare discomfort. Occupant surveys showed 85% agreement with the simulation results, demonstrating that these thresholds effectively reflect user experience. On an urban scale, a street width of at least 8 meters is required to ensure sufficient daylight reaches the lower floors in mid-rise apartment layouts. Research also shows that façades with reflectance exceeding 65% can increase glare by up to 250%, underscoring the importance of regulating façade reflectance in dense urban environments.
Daylight and glare levels vary significantly between different floor levels, requiring tailored design strategies. Lower floors should incorporate wider setbacks ( 8 m), reflective surfaces, and strategically placed windows to enhance daylight access. Middle floors require a balance between daylight penetration and glare reduction, which can be achieved through orientation-based shading and moderate façade reflectance. Upper floors, although receiving ample daylight, should incorporate features such as louvres, adaptive glazing, or low-reflectance materials to effectively reduce glare. The study found that simulation-based thresholds closely match occupants' perceptions. This validates their use in tropical daylighting standards and urban planning guidelines, fostering balanced, human-centred daylight design.
6. Conclusion
This study investigated the impact of urban obstructions on indoor daylight in a tropical mid-rise apartment. A total of 1,152 simulations were conducted using IES-VE with RadianceIES to assess the effects of varying orientations, street widths, and façade reflectance levels (30%-65%) on daylight quality. The results showed that daylight sufficiency is highly affected by the distance to the obstruction. At 4 m setbacks, sDA decreased by 67%, while upper floors maintained sDA over 60%, revealing vertical daylight inequality. Glare levels increased by up to 250% on the first and second floors when façade reflectance rose from 30% to 65%. Analysis of orientation indicated that NE layouts benefited from diffuse morning light, whereas SW layouts experienced more glare. The findings suggest that the proximity, height, orientation, and surface reflectance of nearby buildings significantly influence daylight and glare, underscoring the importance of context-specific daylight design over conventional window-to-wall ratio methods.
The simulation results were verified using perception surveys from 57 occupants, showing an 85% correlation between the simulated and perceived daylight conditions. Significant correlations were found between sDA and daylight satisfaction (ρ = 0.82) and between DGP and glare perception (ρ = 0.79), demonstrating the reliability of computational daylight metrics in tropical housing. By combining simulations with user feedback, this study developed a validated framework for assessing indoor daylight autonomy in a tropical multi-floor residence.
Based on these findings, the study recommends the following evidence-based strategies to ensure sufficient indoor daylight in compact tropical mid-rise apartments.
- Fenestration design should be context-sensitive, accounting for obstruction height, reflectance, and proximity, rather than depending on standard ratios [51].
- The daylight performance assessment should take into account the larger urban context from the early stages of design [82].
- Guidelines for regulating façade material reflectance at an urban scale are essential to minimize overall glare in tropical, multi-storey, dense urban housing [83].
- Daylight strategies should be customized for each floor, such as increasing daylighting on lower levels and controlling glare on upper floors with louvres or adaptive glazing.
- Overall, achieving effective multi-scale coordination is crucial for optimizing daylight in the compact multi-storey residence. This involves harmonizing various urban planning regulations related to setbacks, height limits, surface reflectance, and urban design approaches, along with architectural elements such as fenestration, shading, and materials [84].
In summary, this research demonstrates that enhancing daylighting in tropical multi-storey residential buildings requires integrated urban–architectural strategies rather than isolated building solutions. The study’s methodological framework and guidelines offer practical approaches for architects and urban planners to enhance daylight access in multi-story residential buildings. Future research could explore notable differences in daylight access and glare in high-rise building types. Additionally, the current study could be expanded to assess adaptive façade systems, conduct long-term monitoring of occupant experiences, and apply advanced glare indices for more precise evaluations. A coordinated design approach that integrates urban planning and façade strategies is essential for ensuring daylight resilience in tropical, compact cities.
Funding
This research received no external funding.
Author Contributions
M. Sundaram A: Conceptualization, methodology, modelling, analysis, original draft preparation, writing, reviewing and editing. J. Luthra: Data collection, survey, development, formatting, and technical refinement of the final draft during the revision process.
Declaration of competing interest
The authors declare no conflict of interest.
References
- N. Nasrollahi and E. Rostami, The impacts of urban canyon morphology on daylight availability and energy consumption of buildings in a hot-summer Mediterranean climate, Solar Energy, 266 (2023) 112-181. https://doi.org/10.1016/j.solener.2023.112181
- T. Dogan, C. Reinhart, and P. Michalatos, Urban daylight simulation calculating the daylit area of urban designs. In: Proceedings of SimBuild Conference, Madison, WI- 5 (1-3 August 2012), pp. 613-620.
- M. DeKay, Daylighting and urban form: an urban fabric of light, Journal of Architectural and Planning Research, 27:1 (2010) 35-56.
- International Energy Agency (IEA), Energy Technology Perspectives 2016: Towards Sustainable Urban Energy Systems. Paris: International Energy Agency, 2016. https://iea.blob.core.windows.net/assets/37fe1db9-5943-4288-82bf-13a0a0d74568/Energy_Technology_Perspectives_2016.pdf (accessed on 30/ 08 /2025).
- U.S. Choi, R. Johnson, and S. Selkowitz, The impact of daylighting on peak electrical demand, Energy and Buildings, 6:4 (1984) 387-399. https://doi.org/10.1016/0378-7788(84)90021-5
- D.H. Li, J.C. Lam, and S.L. Wong, Daylighting and its effects on peak load determination, Energy, 30:10 (2005) 1817-1831. https://doi.org/10.1016/j.energy.2004.09.009
- S. Zhu, C. Ma, Z. Wu, Y. Huang, and X. Liu, Exploring the impact of urban morphology on building energy consumption and outdoor comfort: A comparative study in hot-humid climates. Buildings, 14:5 (2024) 13-81. https://doi.org/10.3390/buildings14051381
- K. Salih, Impact of the design of urban block on buildings' indoor daylight and energy loads in semi-arid regions. In: Urban and Transit Planning: A Culmination of Selected Research Papers from IEREK Conferences on Urban Planning, Architecture and Green Urbanism, Italy and Netherlands, Cham: Springer International Publishing, (21 Jul 2019), pp. 575-589. https://doi.org/10.1007/978-3-030-17308-1_50
- R.S. Nahrkhalaji, L.L. Boston, and R. Mistrick, The impacts of different levels of exterior surround detail on daylight simulation results, Leukos, 18:3 (2021) 341-356. https://doi.org/10.1080/15502724.2021.1947313
- N.M. Barbosa and R.C. Cabús, The influence of the facade of the built environment on the performance of natural lighting, Paranoá, Brasilia, 27 (2020) 113-124. https://doi.org/10.18830/issn.1679-0944.n27.2020.07
- E. Montes-Villalva, L. Pereira-Ruchansky, B. Piderit-Moreno, and A. Pérez-Fargallo, Impact of Urban Re-Densification on Indoor Lighting Demand and Energy Poverty on the Equator, in the City of Quito, Sustainability, 14:7 (2022) 3783. https://doi.org/10.3390/su14073783
- C. Giarma, K. Tsikaloudaki, and D. Aravantinos, Daylighting and visual comfort in buildings' environmental performance assessment tools: a critical review, Procedia Environmental Sciences, 38 (2017) 522-529. https://doi.org/10.1016/j.proenv.2017.03.116
- N. Šprah, J. Potočnik, and M. Košir, The influence of façade colour, glazing area, and geometric configuration of urban canyon on the spectral characteristics of daylight, Building and Environment, 251 (2024) 111214. https://doi.org/10.1016/j.buildenv.2024.111214
- I.G.D. Santos, T. Auer, and R.V.G.D. Souza, Optimized indoor daylight for tropical dense urban environments, Ambiente Construído, 17:3 (2017) 87-102. https://doi.org/10.1590/s1678-86212017000300164
- E. Saratsis, T. Dogan, and C.F. Reinhart, Simulation-based daylighting analysis procedure for developing urban zoning rules, Building Research and Information, 45:5 (2017) 478-491. https://doi.org/10.1080/09613218.2016.1159850
- J.C. Lam, Shading effects due to nearby buildings and energy implications, Energy Conversion and Management, 41:7 (2000) 647-659. https://doi.org/10.1016/S0196-8904(99)00138-7
- Z. Dicka, E. Dolnikova, and D. Katunsky, The impact of shading by vegetation on the level of daylight in buildings: A case study. In: E3S Web of Conferences EDP Sciences, 550 01003 (2024) pp.1-7. https://doi.org/10.1051/e3sconf/202455001003
- P. Perišić, J. Živaljić, and D. Brkić, Daylight and urban morphology: a model for analysing the average annual illumination of residential housing, Technical Gazette, 23:3 (2016) 675-682. https://doi.org/10.17559/TV-20150526191843
- M. Amado and F. Poggi, Towards solar urban planning: A new step for better energy performance, Energy Procedia, 30 (2012) 1261-1265. https://doi.org/10.1016/j.egypro.2012.11.139
- I.G. Capeluto, The influence of the urban environment on the availability of daylight in office buildings in Israel, Building and Environment, 38:5 (2003) 745-752. https://doi.org/10.1016/S0360-1323(02)00238-X
- A. Bugeat, E. Fernández, B. Beckers, and J. Aguerre, A multi-scale consideration of daylight in a real urban context, In: Building Simulation IBPSA, 16 (2 September 2019) p. 3460-3467. https://doi.org/10.26868/25222708.2019.210650
- E. Rostami and N. Nasrollahi, The impact of urban morphology on sunlight availability at urban and neighborhood scales: A systematic review, Sustainable Cities and Society, (2025)106-194. https://doi.org/10.1016/j.scs.2025.106194
- A. Czachura, J. Kanters, M. Wall, and N. Gentile, Enhancing daylighting predictions in urban planning: A workflow for setting bespoke Vertical Sky Component (VSC) targets, Building and Environment, 266 (2024) 1-13. https://doi.org/10.1016/j.buildenv.2024.112066
- Z. Fan, S. Tang, X. Zong, and M. Liu, Multi-objective optimization framework of tropical urban block morphology for balanced daylight illuminance, visual comfort, and energy load in central community gymnasium, Journal of Building Engineering, 114 (2025) 114-281. https://doi.org/10.1016/j.jobe.2025.114281
- Q. He, Z. Li, W. Gao, H. Chen, X. Wu, X. Cheng, and B. Lin, Predictive models for daylight performance of general floorplans based on CNN and GAN: A proof-of-concept study, Building and Environment, 206 (2021) 108-346. https://doi.org/10.1016/j.buildenv.2021.108346
- J. Strømann-Andersen and P.A. Sattrup, The urban canyon and building energy use: urban density versus daylight and passive solar gains, Energy and Buildings, 43:8 (2011) 2011-2020. https://doi.org/10.1016/j.enbuild.2011.04.007
- E. Ng, A simplified daylighting design tool for high-density urban residential buildings, Lighting Research & Technology 33:4 (2001) 259-269. https://doi.org/10.1177/136578280103300417
- R.M. DeKay, Climatic urban design: configuring the urban fabric to support daylighting, passive cooling, and solar heating, Sustainable City VII Ancona, Italy, 2 (2012) 619-630. https://doi.org/10.2495/SC120522
- H.D. Cheung, Daylighting performance assessment methods for high-rise residential buildings in a dense urban environment [thesis], Hong Kong: Hong Kong Polytechnic University, 2006.
- F.O. Pereira, S.M. Leder, L.N. Moraes, and C. Lenzi, Sky obstruction and daylight, In: Proceedings of PLEA2009-26th conference on Passive and Low Energy Architecture, Quebec City, Canada, (22-24 June 2009), p. 22-24.
- H.D. Cheung and T.M. Chung, Calculation of the vertical daylight factor on window facades in a dense urban environment, Architectural Science Review, 48:1 (2005) 81-91. https://doi.org/10.3763/asre.2005.4811
- I.R. Edmonds and P.J. Greenup, Daylighting in the tropics, Solar Energy, 73:2 (2002) 111-121. https://doi.org/10.1016/S0038-092X(02)00039-7
- J. Mardaljevic, L. Heschong, and E. Lee, Daylight metrics and energy savings, Lighting Research & Technology, 41:3 (2009) 261-283. https://doi.org/10.1177/1477153509339703
- D.H. Li and S.L. Wong, Daylighting and energy implications due to shading effects from nearby buildings, Applied Energy, 84:12 (2007) 1199-1209. https://doi.org/10.1016/j.apenergy.2007.04.005
- C. Reinhart, Daylight performance predictions. In: Hensen J.L.M., Lamberts R., eds. Building performance simulation for design and operation, Abingdon, UK: Routledge, 2019. p. 221-269. https://doi.org/10.1201/9780429402296-7
- I. Acosta, M.Á. Campano, S. Domínguez, and J. Fernández-Agüera, Minimum daylight autonomy: a new concept to link daylight dynamic metrics with daylight factors, Leukos, 15:4 (2019) 251-269. https://doi.org/10.1080/15502724.2018.1564673
- IES, Lm I., Approved method: IES spatial Daylight autonomy (sDA) and annual sunlight exposure (ASE). Illum. Eng. Soc., 2013.https://www.ies.org/product/ies-spatial-daylight-autonomy-sda-and-annual-sunlight-exposure-ase. (accessed on 30/ 08 /2025)
- R.A. Mangkuto, M.A. Siregar, and A. Handina, Determination of appropriate metrics for indicating indoor daylight availability and lighting energy demand using genetic algorithm, Solar Energy, 170 (2018) 1074-1086. https://doi.org/10.1016/j.solener.2018.06.025
- Z. Dicka, E. Dolnikova, and D. Katunsky, The impact of shading by vegetation on the level of daylight in buildings: A case study, In: E3S Web of Conferences, EDP Sciences, 550 (2024) p. 01003. https://doi.org/10.1051/e3sconf/202455001003
- A. Eltaweel and Y. Su, Parametric design and daylighting: a literature review, Renewable and Sustainable Energy Reviews, 73 (2017) 1086-1103. https://doi.org/10.1016/j.rser.2017.02.011
- K.A. Al-Sallal and N. Abu-Obeid, Effects of shade trees on illuminance in classrooms in the United Arab Emirates, Architectural Science Review, 52:4 (2009) 295-311. https://doi.org/10.3763/asre.2008.0061
- A. Ahmad, A. Kumar, O. Prakash, and A. Aman, Daylight availability assessment and the application of energy simulation software-A literature review, Materials Science for Energy Technologies, 3 (2020) 679-689. https://doi.org/10.1016/j.mset.2020.07.002
- M. Ayoub, 100 Years of daylighting: A chronological review of daylight prediction and calculation methods, Solar Energy, 194 (2019) 360-390. https://doi.org/10.1016/j.solener.2019.10.072
- M. Ayoub, A review on machine learning algorithms to predict daylighting inside buildings, Solar Energy, 202 (2020) 249-275. https://doi.org/10.1016/j.solener.2020.03.104
- A. Toutou, M. Fikry, and W. Mohamed, The parametric based optimization framework daylighting and energy performance in residential buildings in hot arid zone, Alexandria engineering journal, 57:4 (2018) 3595-3608. https://doi.org/10.1016/j.aej.2018.04.006
- C.F. Reinhart and J. Wienold, The daylighting dashboard-A simulation-based design analysis for daylit spaces, Building and Environment, 46:2 (2011) 386-396. https://doi.org/10.1016/j.buildenv.2010.08.001
- S. Cammarano, A. Pellegrino, V.R. Lo Verso, and C. Aghemo, Assessment of daylight in rooms with different architectural features, Building Research and Information, 43:2 (2015) 222-237. https://doi.org/10.1080/09613218.2014.922359
- S.G. Navada, C.S. Adiga, and S.G. Kini, Prediction of daylight availability for visual comfort, International Journal of Applied Engineering Research, 11:7 (2016) 4711-4717.
- H.-J. Kim and K.-H. Kim, A design methodology for street-oriented block housing with optimization of natural daylight, Journal of the Architectural Institute of Korea Planning & Design, 31:5 (2015) 45-56. https://doi.org/10.5659/JAIK_PD.2015.31.5.45
- Illuminating Engineering Society, Approved method: IES spatial daylight autonomy (sDA) and annual sunlight exposure (ASE) (IES LM-83-12), New York, NY: Illuminating Engineering Society, 2012.
- A. Mahdavi, N. Inangda, and S. Rao, Impacts of orientation on daylighting in highrise office buildings in Malaysia, Journal of Design and Built Environment, 15:2 (2015) 29-38.
- A. Nabil and J. Mardaljevic, Useful daylight illuminance: a new paradigm for assessing daylight in buildings, Lighting Research and Technology, 37:1 (2005) 41-59. https://doi.org/10.1191/1365782805li128oa
- J. Wienold and J. Christoffersen, Evaluation methods and development of a new glare prediction model for daylight environments with the use of CCD cameras, Energy and Buildings, 38:7 (2006) 743-757. https://doi.org/10.1016/j.enbuild.2006.03.017
- T. Alaqtum, A. Engineer, and C. Moeller, Daylighting glare and design for visual comfort, Technology| Architecture+ Design, 8:1 (2024) 126-142. https://doi.org/10.1080/24751448.2024.2322924
- C. Pierson, C. Cauwerts, M. Bodart, and J. Wienold, Tutorial: luminance maps for daylighting studies from high dynamic range photography, Leukos, 17:2 (2021) 140-169. https://doi.org/10.1080/15502724.2019.1684319
- E. Resch, R.A. Bohne, T. Kvamsdal, and J. Lohne, Impact of urban density and building height on energy use in cities, Energy Procedia, 96 (2016) 800-814. https://doi.org/10.1016/j.egypro.2016.09.142
- P. Ihm, A. Nemri, and M. Krarti, Estimation of lighting energy savings from daylighting, Building and Environment, 44:3 (2009) 509-514. https://doi.org/10.1016/j.buildenv.2008.04.016
- D.H. Li and J.C. Lam, An investigation of daylighting performance and energy saving in a daylit corridor, Energy and Buildings, 35:4 (2003) 365-373. https://doi.org/10.1016/S0378-7788(02)00107-X
- S. Oulmouden, H. Radoine, and B. Benhamou, Assessing the Impact of Urban Morphology on Residential Building Energy Efficiency and Daylight Autonomy, In: International Conference on Sustainability in Energy and Buildings, Springer Nature: Singapore, (18 September 2024). p. 495-505. https://doi.org/10.1007/978-981-96-5069-9_42
- M. DeKay and G.Z. Brown, Sun, wind, and light: architectural design strategies, 3rd ed. Hoboken, NJ: John Wiley & Sons, 2013.
- L.M. Obeidat, S.N. Ma'bdeh, A.W. Subuh, and H.Z. Nusair, Assessment of the Daylight Performance in Residential Buildings: The Impact of Setback Regulations in the Jordanian Building Code, International Journal on Energy Conversion, 12:1 (2024). https://doi.org/10.15866/irecon.v12i1.23679
- M. Bodart and C. Cauwerts, Assessing daylight luminance values and daylight glare probability in scale models, Building and Environment, 113 (2017) 210-219. https://doi.org/10.1016/j.buildenv.2016.08.033
- Z.S. Zomorodian, S.S. Korsavi, and M. Tahsildoost, The effect of window configuration on daylight performance in classrooms: a field and simulation study, International Journal of Architectural Engineering and Urban Planning, 26:1 (2016) 15-24.
- Chartered Institution of Building Services Engineers, Society of Light, Lighting, Code for Lighting. Routledge, 2002.
- International Commission on Illumination, CIE S 011/E:2003: spatial distribution of daylight-CIE standard overcast sky and clear sky, Vienna: International Commission on Illumination, 2003.
- J. Wienold, Dynamic daylight glare evaluation. In: Proceedings of the 11th International Conference of the International Building Performance Simulation Association (IBPSA), Glasgow, Scotland, (27-30 July 2009), pp. 944-951.
- L.K. Lawrie and D.B. Crawley, Development of global typical meteorological years (TMYx). onebuilding.org, 2022. https://climate.onebuilding.org. (accessed on 30/ 08 /2025)
- S.C. Chien and K.J. Tseng, Assessment of climate-based daylight performance in tropical office buildings: a case study, International Journal of Low-Carbon Technologies, 9:2 (2014) 100-108. https://doi.org/10.1093/ijlct/ctu014
- N. Nasrollahi and E. Shokri, Daylight illuminance in urban environments for visual comfort and energy performance, Renewable and Sustainable Energy Reviews, 66 (2016) 861-874. https://doi.org/10.1016/j.rser.2016.08.052
- J. Sun, Z. Li, and F. Xiao, The influence of exterior obstruction on the integrated evaluation of daylight utilization during initial design stage, Procedia Engineering, 205 (2017) 2785-2792. https://doi.org/10.1016/j.proeng.2017.09.882
- D.H. Li and J.C. Lam, Measurements of solar radiation and illuminance on vertical surfaces and daylighting implications, Renewable Energy, 20:4 (2000) 389-404. https://doi.org/10.1016/S0960-1481(99)00126-3
- F.R. Frans, S. Sesotya Utami, R. Armanto Mangkuto, and D.J. Suroso, The effects of orientation, window size, and lighting control to climate-based daylight performance and lighting energy demand on buildings in tropical area. In: Building Simulation, IBPSA, 16 (2 September 2019) pp. 1075-1082. https://doi.org/10.26868/25222708.2019.210677
- A. Chokhachian, K. Perini, S. Giulini, and T. Auer, Urban performance and density: Generative study on interdependencies of urban form and environmental measures, Sustainable Cities and Society, 53 (2020) 101-952. https://doi.org/10.1016/j.scs.2019.101952
- D. Koster, A. Rafiee, and E. Brembilla, The effect of urban density on compliance with indoor visual and non-visual daylight targets: A Dutch case study. Sustainable Cities and Society, 120 (2025) 106-149. https://doi.org/10.1016/j.scs.2025.106149
- A. Czachura, J. Kanters, N. Gentile, and M. Wall, Solar performance metrics in urban planning: A review and taxonomy, Buildings, 12:4 (2022) 393. https://doi.org/10.3390/buildings12040393
- N. Šprah and M. Košir, Daylight provision requirements according to EN 17037 as a restriction for sustainable urban planning of residential developments, Sustainability, 12:1 (2019) 315. https://doi.org/10.3390/su12010315
- E. Ng, A study of the relationship between daylight performance and height difference of buildings in high density cities using computational simulation, Ninth International IBPSA Conference, Montréal, Canada, (01 July 2005) 15-18.
- J. Hraška and J. Čurpek, The practical implications of the EN 17037 minimum target daylight factor for building design and urban daylight in several European countries, Heliyon, 10:1 (2024). https://doi.org/10.1016/j.heliyon.2023.e23297
- Z.A. Kılıç and A.K. Yener, A Framework for Integrating Zoning Regulations and Site Layout Design to Enhance Visual Comfort-A Study based on Zoning Regulation and EN 17037, Journal of Daylighting, 12:1 (2025) 148-166. https://doi.org/10.15627/jd.2025.9
- P. Aydin and R. Ünver, The effect of building height and street width on indoor daylight performance according to the town planning code--office buildings for the case of Istanbul and Adana, Megaron, 18:4 (2023) 466-482. https://doi.org/10.14744/megaron.2023.79577
- A.D. Galasiu and C.F. Reinhart, Current daylighting design practice: a survey, Building Research and Information, 36:2 (2008) 159-174. https://doi.org/10.1080/09613210701549748
- L.E. Mavromatidis, X. Marsault, and H. Lequay, Daylight factor estimation at an early design stage to reduce buildings' energy consumption due to artificial lighting: A numerical approach based on Doehlert and Box-Behnken designs, Energy, 65 (2014) 488-502. https://doi.org/10.1016/j.energy.2013.12.028
- E. Rostami and N. Nasrollahi, The impact of urban morphology on sunlight availability at urban and neighborhood scales: A systematic review, Sustainable Cities and Society, (2025) 106-194. https://doi.org/10.1016/j.scs.2025.106194
- S. Islam and C. Subasinghe, Denied delights of daylight in density: Optimizing building codes to achieve maximum daylight in apartments of Dhaka, Bangladesh, Energy for Sustainable Development, 69 (2022) 51-63. https://doi.org/10.1016/j.esd.2022.04.014
2383-8701/© 2026 The Author(s). Published by solarlits.com. This is an open access article distributed under the terms and conditions of the Creative Commons Attribution 4.0 License.

2904
Total views
Citations
SHARE ON


