Article | 15 March 2026
Volume 13 Issue 1 pp. 108-123 • doi: 10.15627/jd.2026.7
Architectural Factors Affecting Illumination in Swedish Dairy Barns: Insights from Photometric Measurements and Simulations
Sheikh Rishad Ahmmad,1,* Niko Gentile,2 Maria Vilain Rørvang,1 Knut-Håkan Jeppsson,1 Marie-Claude Dubois2
Author affiliations
1 Department of Biosystems and Technology, Swedish University of Agricultural Sciences (SLU), Alnarp, Sweden
2 Department of Building and Environmental Technology, Division of Energy and Building Design, Lund University (LTH), Lund, Sweden
*Corresponding author.
rishad.ahmmad@slu.se (S. R. Ahmmad)
niko.gentile@ebd.lth.se (N. Gentile)
mariav.rorvang@slu.se (M. V. Rørvang)
knut-hakan.jeppsson@slu.se (K-H. Jeppsson)
marie-claude.dubois@ebd.lth.se (M-C. Dubois)
History: Received 13 November 2025 | Revised 29 January 2026 | Accepted 6 February 2026 | Published online 15 March 2026
2383-8701/© 2026 The Author(s). Published by solarlits.com. This is an open access article distributed under the terms and conditions of the Creative Commons Attribution 4.0 License.
Citation: Sheikh Rishad Ahmmad, Niko Gentile, Maria Vilain Rørvang, Knut-Håkan Jeppsson, Marie-Claude Dubois, Architectural Factors Affecting Illumination in Swedish Dairy Barns: Insights from Photometric Measurements and Simulations, Journal of Daylighting, 13:1 (2026) 108-123. doi: 10.15627/jd.2026.7
Figures and tables
Abstract
Illumination of dairy barns impacts animal health, milk production, and building energy efficiency. The aim of this study was to assess the existing daylighting and electric lighting conditions of dairy barns located in Southern Sweden. The study specifically examined how different architectural features impact the lighting environment, aiming to identify retrofit potentials in older barns and areas of improvement for new constructions. Ten dairy barns on seven farms were selected as case studies with different construction types, construction year, and size; and were monitored during November 2023 and February 2024. Photometric and geometric measurements were collected, and simulation models were created and calibrated by comparing them with the measurements. The simulation results were used to analyse the lighting performance of the barns. The results indicate that several older barns have lower than recommended illumination from daylighting and electric lighting systems, inappropriate choice of building materials with low reflectance, poor maintenance of building surfaces, etc; thus, requiring maintenance and retrofit measures. Newer barns often showcased improved lighting conditions compared to older barns, primarily due to better daylighting through side openings and skylights (aperture-to-floor ratio: 1-6 % in older barns and 12-20 % in newer designs), underscoring the importance of improving design practices. Older barns consistently showed mean daylight factor values below 1 %, while newer barns exhibited notably improved daylighting. Compared to most older barns having a daylight autonomy below 10 %, newer barns achieved a daylight autonomy higher than 50 %. Mean electric lighting illuminance ranged from 57 to 157 lux across the studied barns. Both new constructions and retrofit projects can benefit from implementing clearly defined design guidelines and lighting requirements for agricultural buildings. Future studies on long-term impacts of illumination on farm animals and human caretakers, environmental and economic assessment of improved barn design and retrofit measures can provide more information on this topic.
Keywords
photometric assessment, daylighting performance, electric lighting, animal building, agricultural building
1. Introduction
Daylighting and electric lighting systems in dairy barns play an important role in supporting animal health [1–3], as well as milk quality and quantity [2,4–6]. Research shows that cows exposed to 16 to 18 hours of daylight and/or electric lighting produce more milk [7–9]. Light exposure also increases the cows’ feed intake and prolactin levels [1]. Appropriately designed daylighting and electric lighting systems can mitigate the risk of overheating and prevent heat stress in dairy barns [10], which relates to body temperature and breathing rate, feed intake, milk production, and blood chemistry [11,12]. Illumination moreover supports the animals’ circadian rhythm [3]. Providing recommended illuminance further helps to create a safer and more stimulating work environment for the human caretakers [13]. Thus, high-quality daylighting and electric lighting systems create a safe and comfortable environment for both cattle and humans.
Several studies show that ensuring well designed, energy-efficient daylighting and lighting in dairy barns can contribute to building energy efficiency [14–16]. The minimum illuminance required for dairy barns in Sweden is 150 lux, measured at work surface according to Swedish Institute for Standards [17]; measurement plane not specified by Swedish Fire Protection Association [18]. The European standard (EN 12464-1:2021) specifies a minimum illuminance for barns used for production of animal species as 50 lux, measured at 0.85 m according to European Committee for Standardization [19]. In contrast, it provides more specific and higher requirements for human-occupied buildings (500 lux horizontally on an office desk, 300 lux in the whole office, and 150 lux in corridors) [19], indicating a potential room for improvement in regulation for animal-inhabited spaces. Using appropriate illuminance levels, appropriate electric light fixtures and ensuring regular maintenance of building surfaces and electric lighting fixtures and choosing Light Emitting Diodes (LED) over fluorescent lamps can lower cost for electricity, as shown in built environments for humans [20–22]. These measures are also important to maintain low production costs in dairy facilities.
Agricultural buildings constitute a large portion of the building stock in Europe [23], which makes it an energy-intensive sector. However, these buildings are regulated differently than other building types in Sweden. Buildings in Sweden generally must go through a building permit process (or “bygglov” in Swedish) [24]. However, agricultural buildings, including barns for farm animals, are instead required to pass a preliminary inspection (or “förprövning” in Swedish) [25], which must comply with the Swedish animal welfare act [26]. As the lighting requirements for farm animal buildings are less rigorous than those required for other building types [27], they may not guarantee optimal illumination for the cattle and human occupants. The preliminary inspection process requires the horizontal illuminance (lux) recommended by the Swedish Institute for Standards [17] and Swedish Fire Protection Association [18], and the presence of windows in the barns. However, it does not specify any quantitative daylight provision (e.g., minimum Daylight Factor of 1 %) as is the case for human-occupied buildings [27]. This lack of a defined daylight metric limits the ability to carry out both qualitative and quantitative assessments of daylight conditions during design approval and later inspections.
Several studies on the impact of light on cattle have been conducted according to a review [28]; however, none of the studies fully considered aspects related to the building envelope or the architecture. Some studies investigated electric lighting conditions of dairy barns in Sweden [29-31], while other European or American studies performed general photometric assessments [32,33], investigated the impact of different materials and design techniques [32,34], and the impact of light treatment on the animals [35]. None of these studies specifically focused on a holistic investigation of daylighting and lighting performance in conjunction with architectural features and their influence on illumination in the Swedish context. Therefore, the aim of this study was to investigate architectural characteristics of Swedish dairy cattle barns and evaluate their lighting conditions through measurements and simulations. The overarching research question of this study was “How do architectural design choices in Swedish dairy cattle barns influence daylighting and electric lighting conditions?” To achieve this, the study focused on four sub-research questions:
- How have architectural design practices in Swedish dairy cattle barns evolved over time, and what implications do these changes have for illumination conditions?
- What are the current daylighting and electric lighting conditions in existing Swedish dairy cattle barns, as assessed through on-site measurements and lighting simulations using static and dynamic daylight metrics?
- To what extent do older dairy cattle barns present opportunities for lighting retrofit interventions to improve overall illumination conditions?
- What lighting-related shortcomings or limitations can be identified in newer dairy cattle barns, and how can these inform improvements in future barn design?
- Daylight Factor (DF): A measure of the illuminance within a room on a horizontal plane, relative to the total amount of light available under an unobstructed hemisphere with an overcast sky, calculated by Eq. (1). [36]. DF was used in this study for primary on-site measurement and subsequent simulation model calibration.
- Uniformity Ratio (UR): Also called illuminance uniformity, it is defined as the ratio of minimum to average illuminance on a surface, calculated by Eq. (2) [37]. UR is particularly relevant for dairy barns, as uneven illumination can negatively affect cow activity and movement, even when average illuminance levels are adequate [31].
- Daylight Autonomy (DA): The percentage of occupied hours of the year when the minimum illuminance threshold at a point or a grid of points is met by daylight alone [38]. DA was used to link daylight performance to potential reduction in electric lighting use.
- Spatial Daylight Autonomy (sDA): The percentage of an analysis area meeting a minimum horizontal daylight illuminance level (e.g. 300 lux for offices) for a specified fraction (e.g. 50 %) of the operating hours per year [39]. sDA was used in this study to evaluate the spatial extent of daylight adequacy.
- Lighting Dependency (LD): The percentage of the occupation hours per year when electric lighting must be added to maintain a minimum work plane illuminance threshold (e.g. 300 lux for offices), calculated by Eq. (3) [40]. LD was used mainly to complement DA results.
- Lighting Power Density (LPD): A measure of the lighting power per unit area of a building, expressed in Watts per square foot or square meter, calculated by Eq. (4) [41]. LPD was used as a benchmark for evaluating lighting system efficiency.
- Useful Daylight Illuminance (UDI): A daylight metric expressing the percentage of time when illuminance at a point is insufficient (< 100 lux), useful (100–2 000 lux), or in oversupply [42]. The range was later redefined through various studies [43–45] to insufficient (< 100 lux), supplementary (100–300 lux), autonomous (300–3 000 lux), and in oversupply (> 3 000 lux). UDI was included to capture the full distribution of daylight levels over time and explore its suitability as a daylight metric for dairy barns.
- Annual Sunlight Exposure (ASE): ASE is the number of hours per year at a given point where direct sunlight is incident on the surface; it quantifies the percentage of analysis points that receive at least 1 000 lux for at least 250 occupied hours per year [39]. ASE was included to identify areas of potential excessive direct sunlight that may cause overheating.
- Barn age: Older barns were included to assess the impact of building period on lighting conditions and potential need for retrofitting. Newly constructed barns were included to evaluate advancements in daylighting and lighting design and construction practices while trying to identify potential areas of improvement. The final selection included barns constructed between 1965 and 2019.
- Barn construction: Barns constructed with different materials and construction techniques, as well as different apertures such as windows, skylights, open facades, and curtains were included to examine how this affects illumination, while also indicating the changing design practices.
- Size and capacity: Barns with varying sizes as well as varying number of cattle were selected.
- Cattle type: Barns that were primarily used to house dairy cows were included. However, in some cases, other cattle production groups such as heifers, calves, and fattening bulls were also present.
- Daylight Factor (DF) and Uniformity: Pre 2000s barns except B2 showed DFmean values consistently below 1 , indicating insufficient daylight. DFmean in post-2000s barns improved notably, peaking in B10. DFmedian values follow a similar trend. The lower DF in the pre-2000 barns was also visually evident in the photographs, which showed generally dimmer interior conditions compared to the more recently constructed barns. UR was low in early barns but gradually improved, with B10 achieving the highest UR. Barns with skylights positioned along the central axis showed higher DF in those areas. Barn B8, which had the widest span and the largest skylight, also had a lower UR, indicating uneven daylight distribution across the space.
- Daylight Autonomy (DA) and Light Dependency (LD): LD was generally higher in most pre-2000 barns with a low DA, indicating a high reliance on electric lighting systems. Barn B2 exhibited generally higher DA compared to other barns of the same construction period, indicating better natural light availability. DA increased substantially from B6 to B10, with B10 showing the highest DA. This trend was confirmed by the sDA, which was higher in newer barns.
- Annual Sunlight Exposure (ASE) and Aperture-to-Floor Ratio (AFR): ASE remained below the 10 threshold in eight out of ten barns with B8 barn having the highest ASE. The AFR increased gradually over the years, indicating improved daylight penetration. The North-South elongated barns (B6, B8, and B10) obtained higher ASE than the East–West oriented barns, as also seen in the simulations where the central axis had increased ASE due to skylights. East-West oriented barns had lower ASE despite higher AFR. B1 is an exception among North-South elongated barns, with low ASE due to absence of skylight and very low AFR.
- Useful Daylight Illuminance (UDI): Older barns exhibited high UDIfailing values except B2. In contrast, newer barns (B6-B10) showed high proportions of UDIacceptable. However, these newer barns also had higher UDIexcessive, indicating a potential risk of overlighting and overheating.
- Introduce skylights, clerestories, light tubes, and windows in the gables to ensure daylight access.
- Repaint walls and ceilings with lighter shades to increase surface reflectances.
- Replace fluorescent lamps with LED systems that offer higher luminous efficacy and longer lifespan.
- Introduce daylight sensors and dimmers to minimize unnecessary use.
- Clean windows, skylights, and luminaires to prevent light loss due to soiling.
- Maintaining higher AFR values, while prioritizing well-distributed windows and skylights.
- Taking advantage of the building orientation to have better natural ventilation and lower ASE.
- Optimizing the roof angle and profile, skylight size, shape and location based on daylighting simulations.
- Incorporating automatic switch-off, step or dimming systems that respond to real-time daylight availability.
- Using high-reflectance materials for ceilings and walls for better illumination.
- Ensuring a uniform illumination across the barn floor and maintaining adequate lighting at animal sight level.
- Installing LED systems with advanced controls for energy savings and adaptability.
- Maintaining a DF of at least 1 as a minimum baseline,
- Targeting DF values closer to 3 where feasible,
- Achieving AFR values above 10 , using high-reflectance interior surfaces,
- Limiting excessive Annual Sunlight Exposure (ASE) ( 10 ), and
- Integrating daylight-responsive dimming or switch-off controls for electric lighting.
- R. R. Peters, L. T. Chapin, R. S. Emery, H. A. Tucker, Milk Yield, Feed Intake, Prolactin, Growth Hormone, and Glucocorticoid Response of Cows to Supplemented Light, Journal of Dairy Science, 64 (1981) 1671-1678. https://doi.org/10.3168/jds.S0022-0302(81)82745-2
- G. E. Dahl, S. Tao, I. M. Thompson, Lactation biology symposium: Effects of photoperiod on mammary gland development and lactation, Journal of Animal Science, 90 (2012) 755-760. https://doi.org/10.2527/jas.2011-4630
- T. Casey, K. Plaut, J. Boerman, Circadian clocks and their role in lactation competence, Domestic Animal Endocrinology, 78 (2022) 106680. https://doi.org/10.1016/j.domaniend.2021.106680
- G. E. Dahl, T. L. Auchtung, E. D. Reid, Manipulating milk production in early lactation through photoperiod changes and milking frequency, Veterinary Clinics of North America: Food Animal Practice, 20 (2004) 675-685. https://doi.org/10.1016/j.cvfa.2004.06.004
- C. Gavan, V. Motorga, The effect of supplemental light on milk production in Holstein dairy cows, Scientific Papers Animal Science and Biotechnologies, 42 (2009), 261-265.
- K. Plaut, T. Casey, Does the circadian system regulate lactation? Animal, 6 (2012) 394-402. https://doi.org/10.1017/S1751731111002187
- R. R. Peters, L. T. Chapin, K. B. Leining, H. A. Tucker, Supplemental lighting stimulates growth and lactation in cattle, Science, 199 (1978) 911-912. https://doi.org/10.1126/science.622576
- A. R. Miller, E. P. Stanisiewski, R. A. Erdman, L. W. Douglass, G. E. Dahl, Effects of Long Daily Photoperiod and Bovine Somatotropin (Trobest®) on Milk Yield in Cows, Journal of Dairy Science, 82 (1999) 1716-1722. https://doi.org/10.3168/jds.S0022-0302(99)75401-9
- G. E. Dahl, B. A. Buchanan, H. A. Tucker, Photoperiodic Effects on Dairy Cattle: A Review, Journal of Dairy Science, 83 (2000) 885-893. https://doi.org/10.3168/jds.S0022-0302(00)74952-6
- R. J. Collier, G. E. Dahl, M. J. VanBaale, Major advances associated with environmental effects on dairy cattle. Journal of Dairy Science, 89 (2006) 1244-1253. https://doi.org/10.3168/jds.S0022-0302(06)72193-2
- J. W. West, Effects of heat-stress on production in dairy cattle, Journal of Dairy Science, 86 (2003) 2131-2144. https://doi.org/10.3168/jds.S0022-0302(03)73803-X
- A. Srikandakumar, E. H. Johnson, Effect of heat stress on milk production, rectal temperature, respiratory rate and blood chemistry in Holstein, Jersey and Australian milking Zebu cows, Tropical Animal Health and Production, 36 (2004) 685-692. https://doi.org/10.1023/B:TROP.0000042868.76914.a9
- Lantbrukarnas Riksförbund, Handbok om energieffektivisering: Energieffektivisering i djurproduktionen (Handbook on energy efficiency: Energy efficiency in animal production), The National Farmers' Association, Sweden, 2013 (in Swedish).
- M. Bey, A. Hamidat, B. Benyoucef, T. Nacer, Viability study of the use of grid connected photovoltaic system in agriculture: Case of Algerian dairy farms, Renewable and Sustainable Energy Reviews, 63 (2016) 333-345. https://doi.org/10.1016/j.rser.2016.05.066
- A. M. Bartkowiak, Energy-saving and low-emission livestock buildings in the concept of a smart farming, Journal of Water and Land Development, 51 (2021) 272-278. https://doi.org/10.24425/jwld.2021.139935
- A. Mohsenimanesh, E. L. LeRiche, R. Gordon, S. Clarke, R. D. MacDonald, I. MacKinnon, et al., Review: Dairy farm electricity use, conservation, and renewable production- a global perspective, Applied Engineering in Agriculture, 37 (2021) 977-990. https://doi.org/10.13031/aea.14621
- Svenska institutet för standarder, Ekonomibyggnader - Tillämpningar till Boverkets och Jordbruksverkets regler avseende utformning av ekonomibyggnader för jordbruk, skogsbruk och trädgårdsnäring samt hästverksamhet (Outbuildings - Applications to the Swedish Housing Agency's and the Swedish Agency for Agriculture's rules regarding the design of farm buildings for agriculture, forestry and horticulture as well as horse operations) (SIS-TS 37:2012), Swedish Institute for Standards, Sweden, 2012 (in Swedish).
- Brandskyddsföreningen, Elinstallationer i lantbruk och hästverksamhet (Electrical installations in agriculture and equestrian operations), Swedish Fire Protection Association, Sweden, 2023 (in Swedish).
- European Committee for Standardization, Light and lighting - Lighting of work places - Part 1: Indoor work places (EN 12464-1:2021), European Committee for Standardization, 2021.
- N. Gentile, T. Laike, M-C. Dubois, Lighting Control Systems in Peripheral Offices Rooms at High Latitude: Measurements of Electricity Savings and Users Preferences, Energy Procedia, 57 (2014) 1987-1996. https://doi.org/10.1016/j.egypro.2014.10.063
- N. Gentile, T. Goven, T. Laike, K. Sjoberg, A field study of fluorescent and LED classroom lighting, Lighting Research and Technology, 50 (2018) 631-650. https://doi.org/10.1177/1477153516675911
- N. Gentile, E. S. Lee, W. Osterhaus, S. Altomonte, C. N. David Amorim, G. Ciampi, et al., Evaluation of integrated daylighting and electric lighting design projects: Lessons learned from international case studies, Energy and Buildings, 268 (2022) 112191. https://doi.org/10.1016/j.enbuild.2022.112191
- M-C. Dubois, J. D. Boer, A. Deneyer, P. Fuhrmann, D. Geisler-Moroder, A. Hoier, et al., Building Stock Distribution and Electricity Use for Lighting: A Technical Report of IEA SHC Task 50, Fraunhofer-Institut für Bauphysik, Germany, 2016.
- Boverket, Om Boverkets byggregler, BBR (About the National Board of Housing, Building and Planning's building regulations, BBR), National Board of Housing, Building and Planning, Sweden, 2023 (in Swedish). https://www.boverket.se/sv/PBL-kunskapsbanken/regler-om-byggande/boverkets-byggregler/om-bbr/ (accessed October 13, 2025).
- Länsstyrelsen Skåne, Djurstallar (Animal stables), Skåne County Administrative Board, Sweden, 2025 (in Swedish). https://www.lansstyrelsen.se/skane/natur-och-landsbygd/information-till-verksamma-pa-landsbygden/djurstallar.html#: (accessed January 8, 2025).
- Jordbruksverket, Föreskrifter om ändring i Statens jordbruksverks föreskrifter och allmänna råd (SJVFS 2019:12) om förprövning (Regulations amending the Swedish Board of Agriculture's regulations and general advice (SJVFS 2019:12) on preliminary examination), Swedish Board of Agriculture, Sweden, 2021 (in Swedish).
- Boverket, Dagljus (Daylight), National Board of Housing, Building and Planning, Sweden, 2022 (in Swedish). https://www.boverket.se/sv/PBL-kunskapsbanken/regler-om-byggande/boverkets-byggregler/ljus-i-byggnader/dagsljus/ (accessed January 10, 2025).
- J. Stuhlträger, E. Von Borell, J. Langbein, C. Nawroth, M. V. Rørvang, C. M. C. Raoult, The role of light and vision in farmed ungulates and implications for their welfare, Frontiers in Animal Science, 5 (2025) 1433181. https://doi.org/10.3389/fanim.2024.1433181
- F. Hjalmarsson, I. Olsson, S. Ferneborg, S. Agenäs, E. Ternman, Effect of low light intensity at night on cow traffic in automatic milking systems, Animal Production Science, 54 (2014) 1784. https://doi.org/10.1071/AN14215
- K-H. Jeppsson, D-E. Nilsson, H. von Wachenfelt, T. Hörndahl, Dimensionering av belysningsstyrka i djurstallar med programmet DiaLux och en kvantitativ jämförelse av ljusmiljö i beteshagar och kostallar (Lighting design in animal buildings with DiaLux and a quantitative assessment of difference in lighting environment on pasture vs indoors for cattle), Department of Biosystems and Technology, Swedish University of Agricultural Sciences, Sweden, 2014 (in Swedish).
- S. Lindkvist. Light environments for dairy cows: Impact of light intensity, spectrum and uniformity, doctoral thesis, 2023:31, Swedish University of Agricultural Sciences, Sweden, 2023. https://doi.org/10.54612/a.3d3og9hhro
- M. Šístková, A. Peterka, B. Peterka, Light and noise conditions of buildings for breeding dairy cows, Research in Agricultural Engineering, 56 (2010) 92-98. https://doi.org/10.17221/43/2009-RAE
- R. R. Andrade, I. F. F. Tinôco, F. A. Damasceno, M. Barbari, D. A. Valente, M. O. Vilela, et al., Lighting and noise levels in compost dairy barns with natural and forced ventilation, Agronomy Research,18:1 (2020) 689-698. https://doi.org/10.15159/AR.20.104
- M. Balková, R. Záhorská, Impact of shelter on daylight in the stables for dairy cows, Research in Agricultural Engineering, 62 (2016) S21-S26. https://doi.org/10.17221/36/2016-RAE
- A. Asher, M. Fialko, F. Fares, U. Moallem, S. Yaacoby, R. Gutman, The Effect of Short-Wavelength White LED Illumination throughout the Night on the Milk Fatty Acid Profile of High-Yielding Dairy Cows, Biology, 11 (2022) 1799. https://doi.org/10.3390/biology11121799
- A. Lewis, The mathematisation of daylighting: a history of British architects' use of the daylight factor, The Journal of Architecture, 22 (2017), 1155-1177. https://doi.org/10.1080/13602365.2017.1376342
- International Commission on Illumination (CIE), CIE Standard Overcast Sky and Clear Sky, 1996. https://cie.co.at/publications/cie-standard-overcast-sky-and-clear-sky (accessed January 30, 2025).
- C. F. Reinhart, Lightswitch-2002: a model for manual and automated control of electric lighting and blinds, Solar Energy, 77 (2004) 15-28. https://doi.org/10.1016/j.solener.2004.04.003
- Illuminating Engineering Society (IES), Approved Method: IES Spatial Daylight Autonomy (sDA) and Annual Sunlight Exposure (ASE), Illuminating Engineering Society of North America, New York, United States of America, 2012.
- A. Iversen, S. Svendsen, T. Nielsen, The effect of different weather data sets and their resolution on climate-based daylight modelling, Lighting Research and Technology, 45 (2013) 305-316. https://doi.org/10.1177/1477153512440545
- American Society of Heating, Refrigerating, and Air-Conditioning Engineers (ASHRAE), ANSI/ASHRAE/IES Addendum b to ANSI/ASHRAE/IES Standard 90.1-2022, ASHRAE, United States of America, 2022.
- A. Nabil, J. Mardaljevic, Useful daylight illuminance: a new paradigm for assessing daylight in buildings, Lighting Research and Technology, 37 (2005) 41-57. https://doi.org/10.1191/1365782805li128oa
- D. Lindelöf, N. Morel, Bayesian estimation of visual discomfort, Building Research and Information, 36 (2008) 83-96. https://doi.org/10.1080/09613210701544061
- J. Wienold, Daylight glare in offices, doctoral thesis, Fraunhofer-Verl, Stuttgart, Germany, 2009.
- J. Mardaljevic. Climate-Based Daylight Modelling And Its Discontents, in: CIBSE Technical Symposium, United Kingdom, 2015.
- Statistiska centralbyrån, Jordbruksverket, Jordbruksstatistisk sammanställning 2020 (Agricultural statistical compilation 2020), Statistics Sweden, Swedish Board of Agriculture, Sweden, 2020.
- Eurostat, Animal housing by type of bovine, utilised agricultural area, size classes of livestock units and NUTS 2 region, Eurostat, 2024. https://ec.europa.eu/eurostat/databrowser/view/ef_ah_bovine__custom_12576721/default/table?lang=en (accessed November 22, 2024).
- N. Gentile, M-C. Dubois, W. Osterhaus, S. Stoffer, C. N. D. Amorim, D. Geisler-Moroder, et al., A toolbox to evaluate non-residential lighting and daylighting retrofit in practice, Energy and Buildings, 123 (2016) 151-161. https://doi.org/10.1016/j.enbuild.2016.04.026
- M-C. Dubois, N. Gentile, T. Laike, P. Mattsson, I. Bournas, M. Alenius, Daylighting and Lighting: Under a Nordic Sky, 2nd ed., Lund University, Sweden, 2025. https://doi.org/10.37852/oblu.324
- M. Fontoynont, Daylight Performance of Buildings. Earthscan, France, 2013. https://doi.org/10.4324/9781315073743
- J. A. Lynes, A sequence for daylighting design, Lighting Research and Technology, 11 (1979) 102-106. https://doi.org/10.1177/14771535790110020101
- Manuals plus, Luxorparts Avståndsmätare Användarmanual (Luxorparts Distance Meter User Manual), Manuals plus, 2024 (in Swedish). https://sv.manuals.plus/luxorparts/distance-meter-manual?utm_content=cmp-true (accessed November 22, 2024).
- Hagner. EC1, Hagner, 2024. https://www.hagner.se/products/detail/1/ (accessed November 22, 2024).
- Hagner, Universal Photometer S5, Hagner, 2024. https://www.hagner.se/products/detail/50/ (accessed November 22, 2024).
- Hagner, Reflection reference, Hagner, 2024. https://www.hagner.se/products/detail/5/ (accessed November 22, 2024).
- Hagner, EC1-X, Hagner, 2024. https://www.hagner.se/products/detail/2/ (accessed November 22, 2024).
- Lawrie, K. Linda, D. B. Crawley, Development of Global Typical Meteorological Years (TMYx), ClimateOneBuildingOrg, 2022. https://climate.onebuilding.org/WMO_Region_6_Europe/SWE_Sweden/SN_Skane/SWE_SN_Malmo.AP-Sturup.026360_TMYx.zip (accessed November 22, 2024).
- J. Mardaljevic, Rethinking Daylighting and Compliance, Journal of Sustainable Design and Applied Research 1 (2013). https://doi.org/10.1007/978-3-642-27851-8_258-1
- Autodesk, Revit 2023, Autodesk Revit: BIM Software to Design and Make Anything, 2023. https://www.autodesk.com/products/revit/overview (accessed July 30, 2025).
- Solemma, Climatestudio (version 2.2.9315.14451), Climatestudio, 2025. https://climatestudiodocs.com/index.html (accessed July 30, 2025).
- Robert McNeel and Associates, Rhino 7, Rhinoceros, 2023. https://www.rhino3d.com/ (accessed July 30, 2025).
- Dialux, Product data sheet: 3F Linda Inox 2x58 HF, Dialux Luminaire Finder, 2025. https://luminaires.dialux.com/en/article/_y_FrbwzRRenFJIm-8_dgQ (accessed July 30, 2025).
- Dialux, Product data sheet: CRUISER 2 LED DALI 21550lm 4000K IP66 110° gray, Dialux Luminaire Finder, 2025. https://luminaires.dialux.com/zh/article/jEmAr0gTRjmqKAPt8HSf-Q?_Y=500 (accessed July 30, 2025).
- Lantmäteriet, Min Karta, Lantmäteriet, 2025. https://minkarta.lantmateriet.se/ (accessed July 30, 2025).
- H. W. Barkema, M. A. G. Von Keyserlingk, J. P. Kastelic, T. J. G. M. Lam, C. Luby, J-P. Roy, et al., Invited review: Changes in the dairy industry affecting dairy cattle health and welfare, Journal of Dairy Science, 98 (2015) 7426-7445. https://doi.org/10.3168/jds.2015-9377
- N. Tomasello, F. Valenti, G. Cascone, S. M. C. Porto, Development of a CFD Model to Simulate Natural Ventilation in a Semi-Open Free-Stall Barn for Dairy Cows, Buildings, 9 (2019) 183. https://doi.org/10.3390/buildings9080183
- S. Reeves, D. M. Amaral-Phillips, Improving Ventilation in Dairy Cow Barns, Department of Animal and Food Sciences, Martin-Gatton College of Agriculture, Food and Environment, 2025.
- G. H. Jacobs, Evolution of colour vision in mammals, Philosophical Transactions of the Royal Society B: Biological Sciences, 364 (2009) 2957-2967. https://doi.org/10.1098/rstb.2009.0039
- G. L. Walls, The Vertebrate Eye and Its Adaptive Radiation, Bloomfield Hills: Cranbrook Institute of Science, Michigan, United States of America, 1942.
- A. Rochon-Duvigneaud, Les Yeux et la Vision des Vertébrés (The Eyes and Vision of Vertebrates), Masson, Paris, France, 1943 (in French).
- Ø. V. Sjaastad, O. Sand, K. Hove, Physiology of Domestic Animals, 2nd ed., Scandinavian Veterinary Press, Oslo, Norway, 2012.
2. Methodology
The study followed a sequential process of barn selection and survey, data collection, modelling and simulation, calibration, analysis, and synthesis, as shown in Fig. 1.
Figure 1
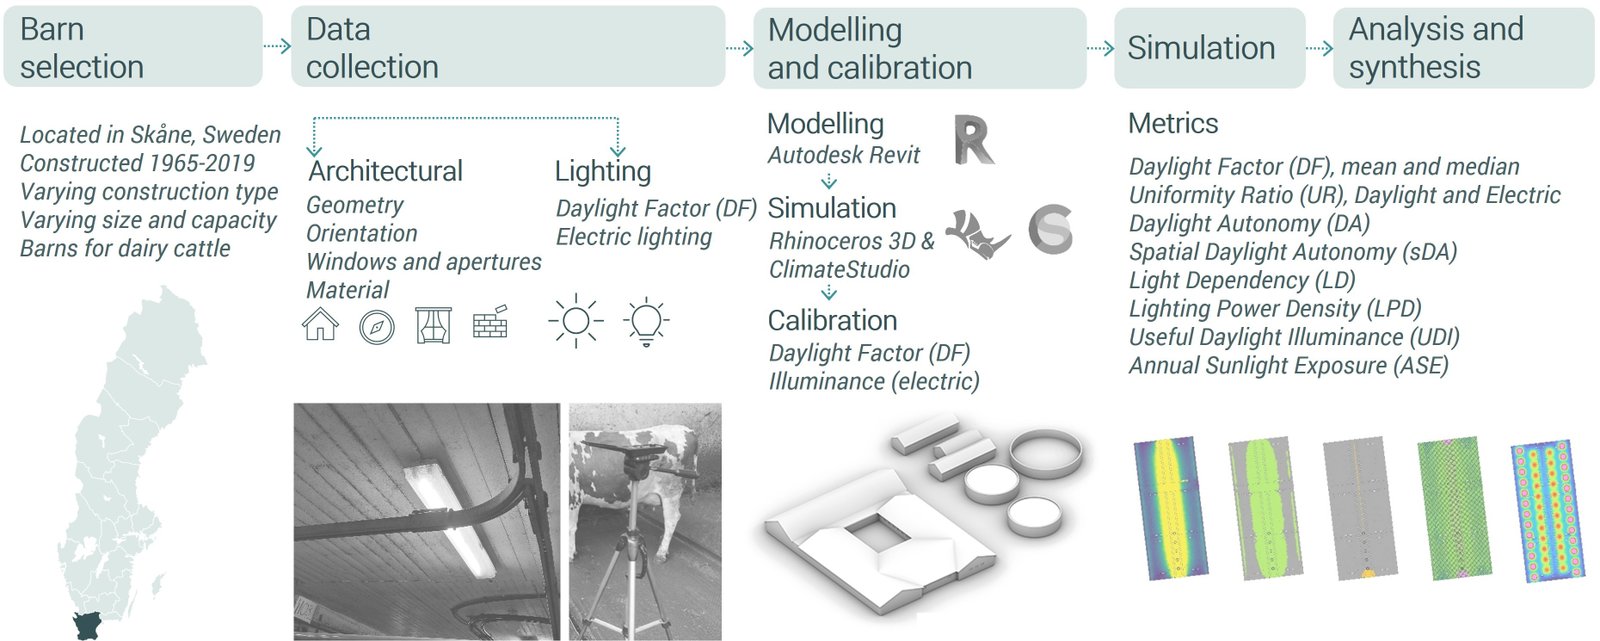
Fig. 1. The overall methodology of the study about daylighting and electric lighting in ten dairy barns of Southern Sweden: barn selection, data collection, modelling and calibration, simulation, analysis, and synthesis.
2.1. Lighting performance metrics
Since Swedish regulations for dairy barns do not specify daylight performance metrics [17,18], in contrast to human-occupied buildings where such metrics are well established [19], this study applied several lighting performance metrics to evaluate dairy barns. This approach enabled an assessment of which metrics can reasonably represent lighting conditions in dairy barns, which are large spaces with substantial spatial variation in illuminance. The following static and dynamic metrics were used for analysis in this study:
where \(E_{indoor}\) is the indoor illuminance [lux] and \(E_{outdoor}\) is the unobstructed outdoor horizontal illuminance [lux].
where \(E_{min}\) is the minimum illuminance [lux] and \(E_{average}\) is the average illuminance [lux].
where \(P_{total}\) is the total power consumed by all luminaires in the space [W] and is the total floor area [m2]
All evaluation criteria used in this study based on regulations and assumptions are summarized in Table 1.
Table 1
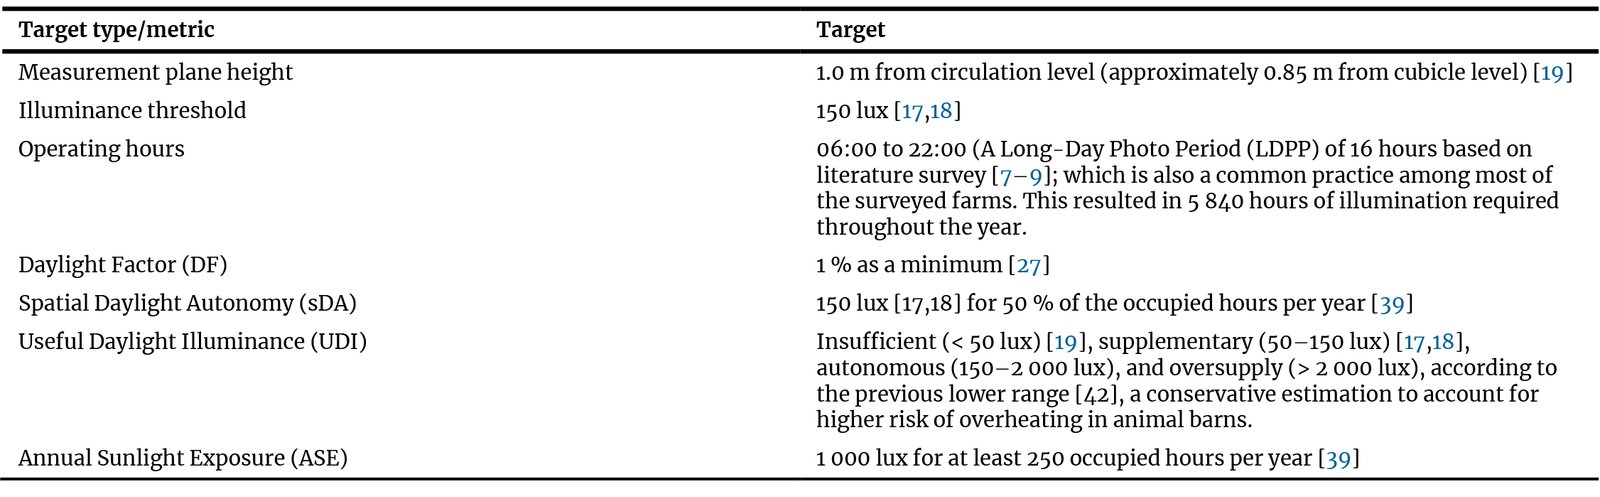
Table 1. Summary of lighting performance metrics, thresholds, and conditions applied in the analysis.
2.2. Barn selection
The study was conducted for ten dairy barns in seven farms in Skåne county of Southern Sweden (55 48 N 13 37 E) between November 2023 and February 2024 (Fig. 2). A description of the selected barns is presented in Table 2. The criteria for selecting the barns were designed to capture a wide range of barn types:
Figure 2
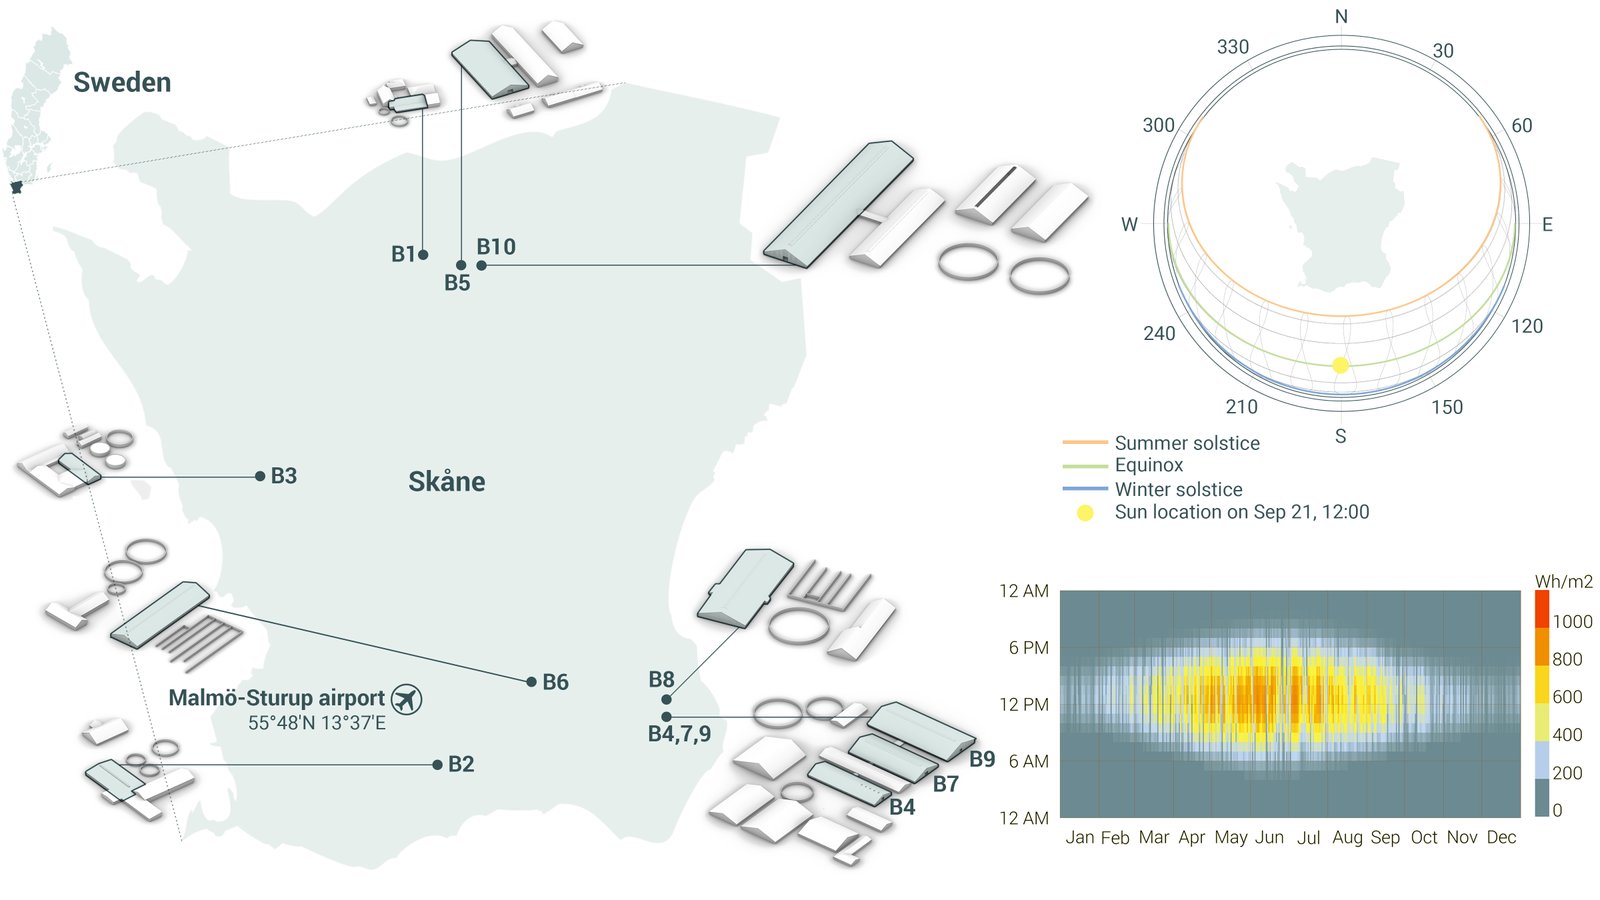
Fig. 2. The location of the dairy barns within Sweden and Skåne (left), sun path diagram showing summer solstice, equinox, and winter solstice (top right), and global horizontal radiation, highest value of 842 Wh/m2 on June 12, 12:00 (bottom right).
Table 2
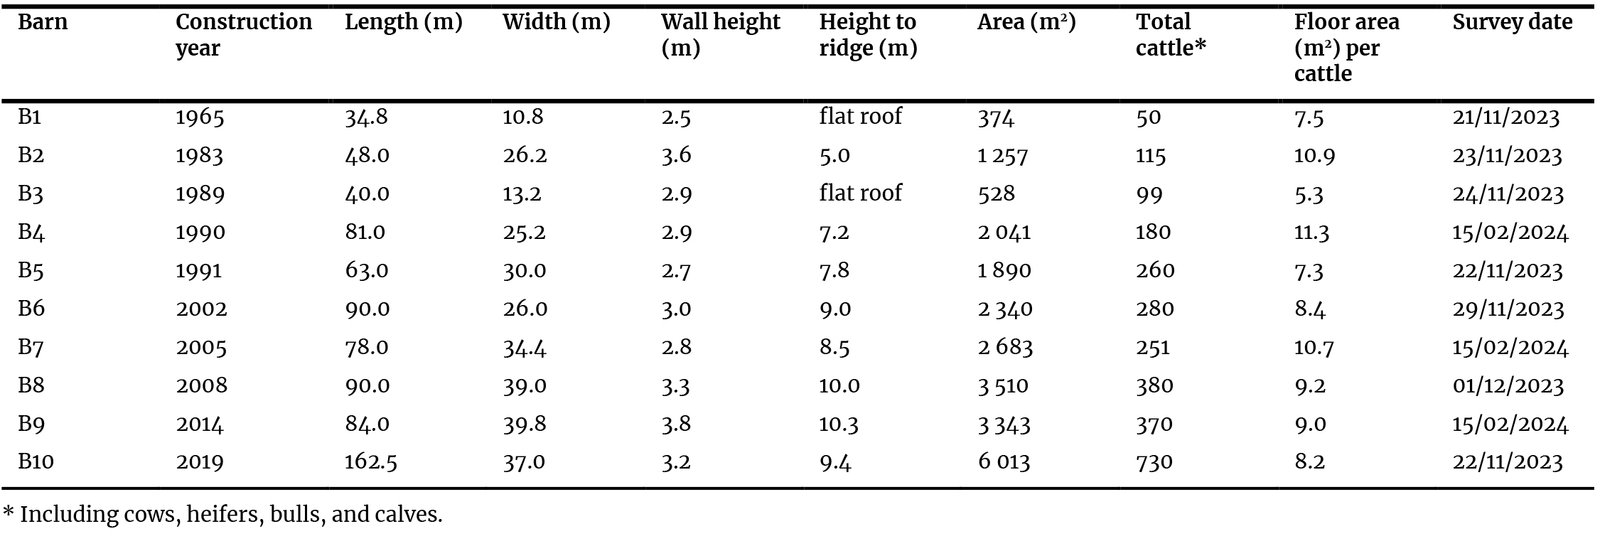
Table 2. General description of the selected dairy barns, including construction year, general geometric properties, number of cattle, and survey date.
* Including cows, heifers, bulls, and calves.
In 2020, Sweden had 3 253 dairy farms, of which 274 were in Skåne [46]. The ten barns included in this study therefore represent 0.22 % of all Swedish dairy farms and 2.55 of those situated in Skåne. According to Eurostat, 2024 [47], Sweden had 302 820 dairy cows in 2020, with 37 020 located in Skåne and Blekinge. The surveyed barns housed 2 715 cattle, including 2 490 dairy cows, corresponding to 0.82 of the national herd and 6.73 of the herd in southern Sweden. However, the ten sample barns are not intended to be statistically representative of all Swedish or Skåne dairy farms. Instead, the selected barns serve as case studies enabling detailed analysis of lighting conditions under real operational conditions.
2.3. Data collection and analysis
2.3.1. Photometric and geometric measurements
Data collected at each visit and the equipment used for the measurements are listed in Table 3. The daylight measurements were performed only under an overcast sky, as DF was the only daylight metric measured on site [37] (Fig. 1). The measurements were collected during daytime between 09:00 and 15:00 hours and thus, photometric measurements focused on daylighting. The architectural drawings of the barns were collected from the farmers for eight out of the ten barns to produce the simulation models. Physical measurements were used alongside satellite images to create the simulation models in the absence of a floor plan for the other two barns (B2 and B6). The roof slope, type, and overhang dimensions were noted. All daylight apertures through windows, doors, and skylights were measured. Window-to-wall ratio (WWR) is suitable for typical buildings where daylight openings are limited to glazed wall surfaces, but it is less appropriate for dairy barns which commonly include skylights, large doors, and often with materials other than glass. Moreover, in dairy barns the total wall area is often comparable to, and in some cases even exceeded by, the total aperture area. Instead, floor area provides a more reliable reference parameter. Therefore, this study introduces the Aperture-to-Floor Ratio (AFR) for a more reliable analysis. AFR was calculated by Eq. (5) to understand the degree to which it impacted daylighting performance in the barns when compared with the daylight metrics.
where \(A_{aperture}\) is the total area of windows, skylights, and openings including frames [m2] and \(A_{floor}\) is the total floor area [m2].
Table 3
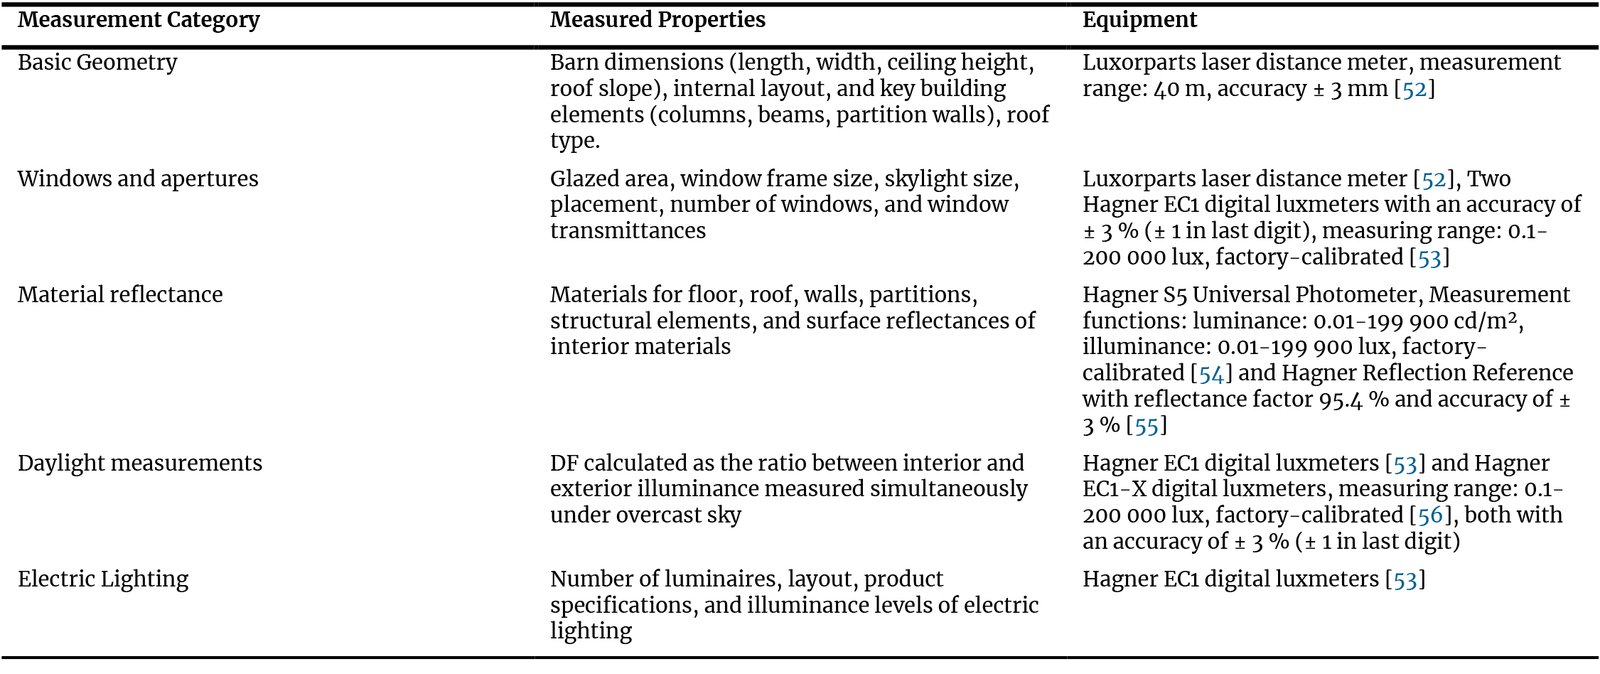
Table 3. Description of photometric and geometric measurements with equipment specifications.
The glazing transmittance was measured by placing one luxmeter on the interior side of the glass and another one on the exterior side as recommended in Gentile et al. [48] and Dubois et al. [49]. Simultaneous measurements were taken to calculate the visual transmittance by finding the ratio between indoor and outdoor illuminance, and the average of three measurements on one typical window was used in the simulations. The surface reflectances of the major diffusive building materials were measured using a calibrated luminance meter and reference plate with 95.4 reflectance, following the method described by Fontoynont [50]. The average of three measurements was used for each material. The mean material reflectance for each barn was area-weighted as described in Lynes’ formula [51]. All interior illuminance measurements were taken at a height of 1.0 m inside the barns using a tripod at 5.0 m intervals along the central axis of the barns. Exterior illuminance measurements were recorded with an exterior sensor attached to a luxmeter. The DF was calculated by simultaneous measurements inside and outside the barns [36].
2.3.2. Electric lighting
Data about lamp and luminaire types were collected at each site (Table 4). The illuminance coming from electric lighting was measured directly below luminaires on a tripod at 1.0 m from the floor. Measurements were taken during the day at the comparatively darker parts of the barns with and without the presence of electric lighting to determine the illuminance provided only by electric lighting. These data and insight from the sites were used to calibrate the electric lighting simulations, especially when the product specifications of the light sources were not available. The Lighting Power Density (LPD) of the barns was calculated using Eq. 4 [41].
Table 4
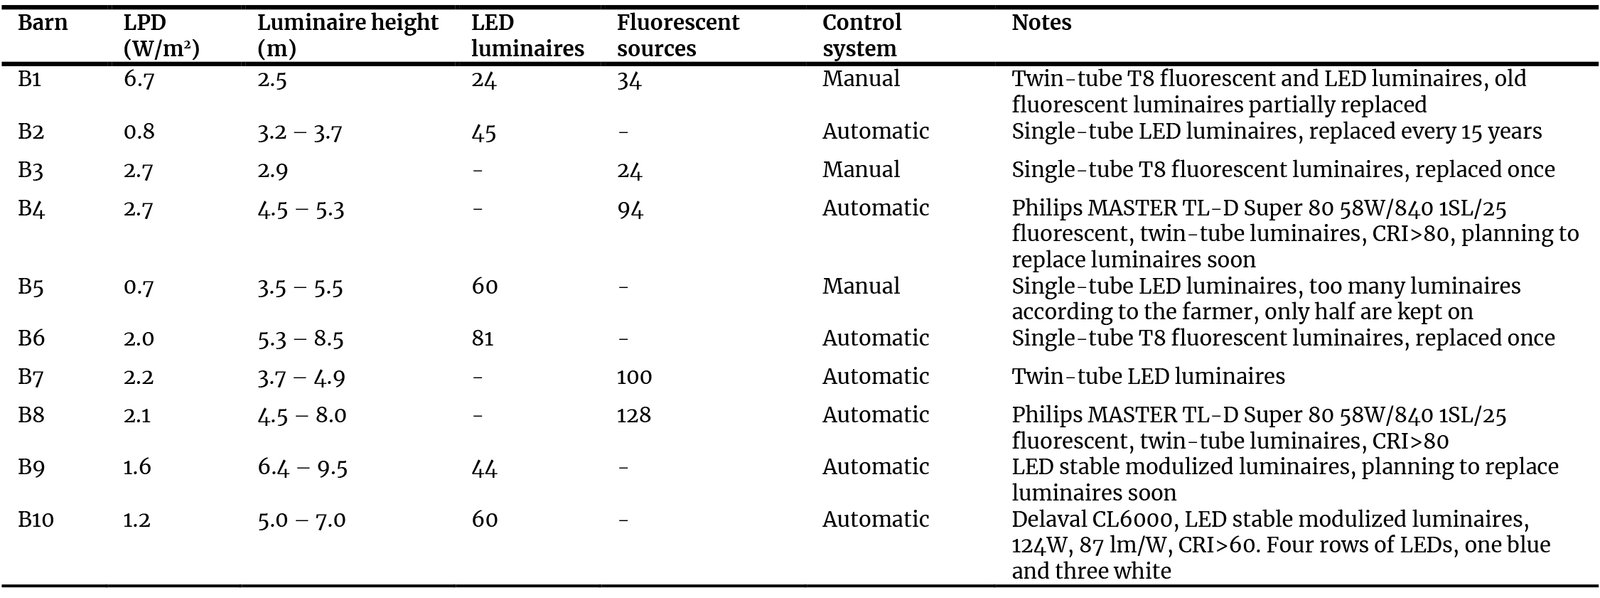
Table 4. A comparison of the electric lighting systems in different barns.
2.4. Calculations for data analysis
Weather data file from the Malmö Sturup airport (55°31'N 13°22'E, Fig. 2) [57] was used to create a cumulative exterior diffuse illuminance curve (Fig. 3) for all the 4 680 daylit hours at the site, based on an original figure by Mardaljevic [58]. This curve was used to determine the required DF to achieve 150 lux of illuminance outlined by Swedish Institute for Standards [17] and Swedish Fire Protection Association [18]. While the data exclude direct sunlight, it reflects diffuse sky conditions that are common in Sweden, especially during winter months when dairy cattle are typically housed indoors. The graph shows that 1 , 2 , and 3 DF can provide approximately 150 lux of illuminance in the barns for 45 , 66 , and 74 of the daylight hours, respectively. This calculation shows how important it may be to increase the DF to reduce the reliance on electric lighting systems.
Figure 3
![Cumulative curve showing diffuse illuminance availability throughout the daylit hours of the year, used to determine the DF required to achieve 150 lux indoors. Adapted for Skåne (Sturup airport) based on an original figure by Mardaljevic, 2013 [58].](figures/13-108-3.jpg)
Fig. 3. Cumulative curve showing diffuse illuminance availability throughout the daylit hours of the year, used to determine the DF required to achieve 150 lux indoors. Adapted for Skåne (Sturup airport) based on an original figure by Mardaljevic, 2013 [58].
2.5. Simulation and calibration
The Malmö-Sturup airport (55°31'N 13°22'E) was selected as the location for all the simulations due to its proximity to the barns (Fig. 2). A single climate file SWE_SN_Malmo.AP-Sturup. 026360_TMYx.2004-2018 [57] was used for all simulations. The barn models were created in Revit 2023 [59] taking references from the photometric and geometric measurements. The models were exported from Revit using ‘Climatestudio export daylight model’ plug-in to perform the simulations using Climatestudio [60] in Rhinoceros 3D [61]. The linear fluorescent and LED luminaires were modelled using the 3F LINDA INOX 2X58 HF IES file [62], while the modular LED luminaires were modelled using CRUISER 2 LED DALI 21550lm 4000K IP66 110° grey IES file [63]. The power multiplier for luminaires in Climatestudio was adjusted iteratively to calibrate the fixtures’ luminous output to align with luminaire specifications. During the calibration phase, the sensor plane was positioned at a height of 1.0 m above the floor to match the on-site measurements. Following calibration, all final simulations used for analysis were performed with the sensor plane placed at 1.5 m above the floor, corresponding to the approximate eye height of dairy cattle at standing position. The horizontal sensor grid spacing was set to 0.6 m, and occupancy hours were defined from 06:00 to 22:00 (16 h per day, hourly timestamp resolution). Default Radiance calculation settings in ClimateStudio were used for all daylight simulations (Samples per pass = 64, maximum number of passes = 100, ambient bounces = 6, weight limit = 0.01, ambient division = 4 096). DF was simulated under a standard CIE overcast sky [37], independent of time of year. Electric lighting simulations were performed as static illuminance calculations corresponding to the survey conditions. The DF and electric lighting illuminance measurements from the survey were compared with the simulation results to calibrate the models (Fig. 4). The calibrated models were then used for further simulations and analysis. On the day of the survey, Barn B8 (Fig. 2) had an accumulation of snow on its skylight, which resulted in a lower measured DF. To ensure accurate calibration to survey conditions, the skylight transmittance was adjusted in the simulation to reflect the snow-covered condition. All other parameters for B8, as well as the properties of all other barns, remained unchanged following the calibration phase. After the initial calibration phase, subsequent simulations were performed for analysis.
Figure 4
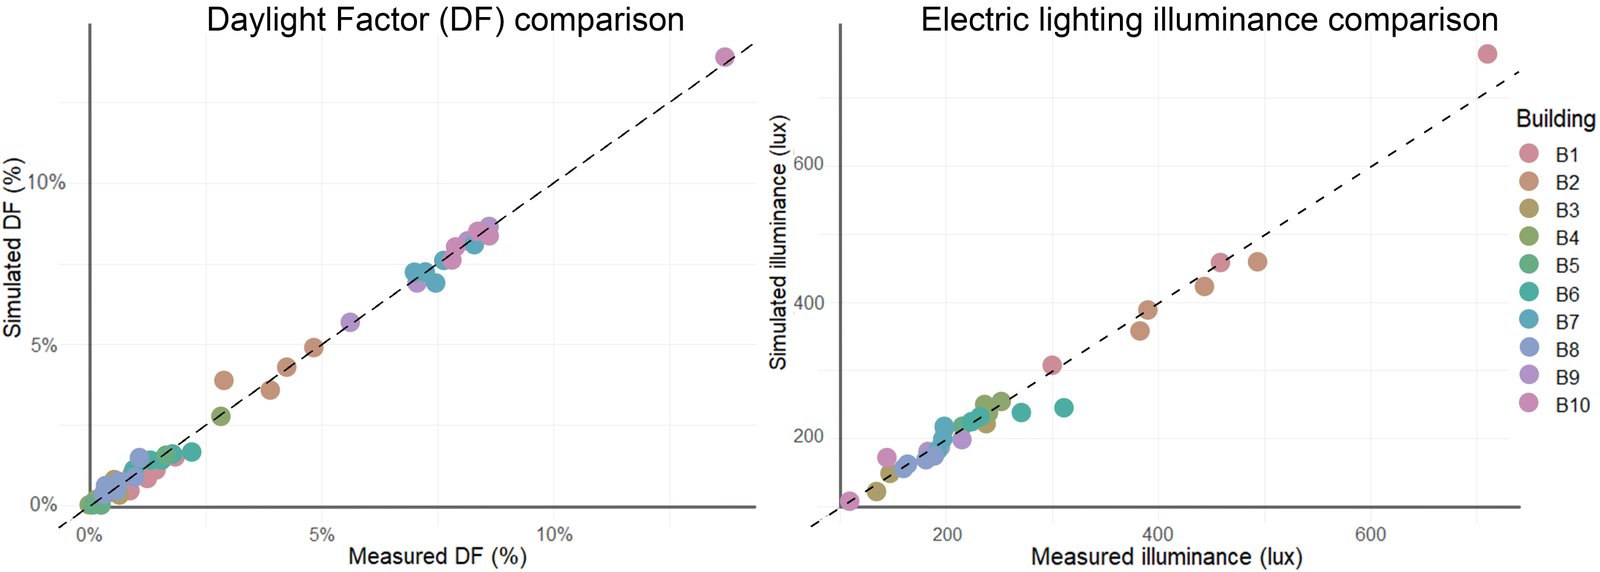
Fig. 4. Comparison of measured vs. simulated values for ten barns. Left: Daylight Factor (DF). Each of the barns have multiple measurement and simulation points, each represented by one circle and the barns are colour-coded as shown in the right. The dotted 1:1 reference line represents perfect calibration.
3. Results and discussion
The primary aim of this study was to examine the architectural design and lighting conditions of dairy barns in Southern Sweden through surveys, measurements, and simulations. The study sought to understand how evolving design practices influence daylighting and electric lighting performance, and to identify retrofit potential in older barns as well as areas of improvement in newer constructions. The findings revealed significant variations in lighting quantity and quality, with older barns often exhibiting insufficient illumination from daylight due to limited windows and skylights, low material reflectance and high soiling level. In contrast, newer barns demonstrated improved conditions in terms of illuminance level, DA and uniformity, emphasizing the gradual improvement in design through better practices over time.
3.1. Comparison of measurements and simulations of daylighting and electric lighting
Measured and simulated DF values and electric lighting illuminance were compared across the ten barns with multiple measurement locations per building. Each point in the combined figure represents measured and simulated values of a single point, allowing direct assessment of simulation accuracy (Fig. 4). For both daylighting and electric lighting, the data showed a strong correspondence with the 1:1 reference line, R2 = 0.99 for daylight (Root Mean Square Error (RMSE) = 0.2 DF, Mean Absolute Percentage Error (MAPE) = 29.3 ) and R2 = 0.97 for electric lighting illuminance (RMSE = 20.4 lux, MAPE = 5.1 ). The higher MAPE for daylighting is attributed to the sensitivity of percentage-based errors at low DF values, where small absolute deviations result in disproportionately large percentage errors.
Figure 4 indicates that the simulation models reliably captured the overall lighting performance of the barns.
3.2. Architectural evolution and its influence on barn illumination
The top view of the barns in Fig. 5 show that the elongated facades of six barns face the East and West direction (B2, B3, B4, B5, B7, B9), while the elongated facades of four barns face the North and South direction (B1, B6, B8, B10). Figure 6 presents barn dimensions arranged by year of construction on the left, and the relationship between floor area and AFR on the right. The left plot shows that barn dimensions have generally increased over time. The plot on the right illustrates that barns with larger floor areas usually have higher AFR values, implying that newer barns are not only larger but also designed with proportionally greater aperture areas.
Figure 5
![Comparison of geometry and orientation between the barns. North is oriented upwards. The barns are arranged in two rows and ordered by year of construction from left to right. Dimensions are based on on-site measurements and architectural drawings provided by the farmers; cross-checked using satellite images [64].](figures/13-108-5.jpg)
Fig. 5. Comparison of geometry and orientation between the barns. North is oriented upwards. The barns are arranged in two rows and ordered by year of construction from left to right. Dimensions are based on on-site measurements and architectural drawings provided by the farmers; cross-checked using satellite images [64].
Figure 6
![Length, width and height of the barns arranged according to their year of construction (left) and the relationship between the floor area and the Aperture-to-floor ratio (AFR). Dimensions are based on on-site measurements and architectural drawings provided by the farmers; cross-checked using satellite images [64].](figures/13-108-6.jpg)
Fig. 6. Length, width and height of the barns arranged according to their year of construction (left) and the relationship between the floor area and the Aperture-to-floor ratio (AFR). Dimensions are based on on-site measurements and architectural drawings provided by the farmers; cross-checked using satellite images [64].
The barns have become larger due to increasing production scale in fewer farms [65] and industrialization of the dairy business. Most of the studied barns were rectangular in shape, mostly due to efficient manure removal, feeding systems, and ease of cow traffic design features. Many barns are shaded by surrounding geometries, causing poorer daylight performance. Most of the barns have double pitched roofs with 10-20 º angle, with two barns having flat ceilings that limit zenithal daylighting. The similar roof design across contexts can be considered as an overlooked opportunity for daylight optimization. The orientation of the barns is important for natural ventilation and sunlight, supporting air movement and thermal comfort for the animals [66]. Elongated facades of six barns faced the East and West direction, while North-South elongated barns were more prone to overheating having higher ASE. East-West elongated barns generally minimize direct sunlight penetration, reducing heat stress [67]. This is consistent with the simulation results from this study. The building orientation should be a balance between daylighting and natural ventilation needs and further study into this could lead to optimization.
A drawing of the windows and apertures of the barns is shown in Fig. 7. The AFR in the barns through all windows, openings, and skylights are mentioned as percentages. Design practices have shifted from small windows to larger windows and clerestory or high windows, eventually leading to open facades. Skylights have evolved from non-existent to small and often non-functioning skylights, and more recently to larger skylights. AFR has increased from 1-6 in pre-2000 barns to 12-20 in post-2000 barns.
Figure 7
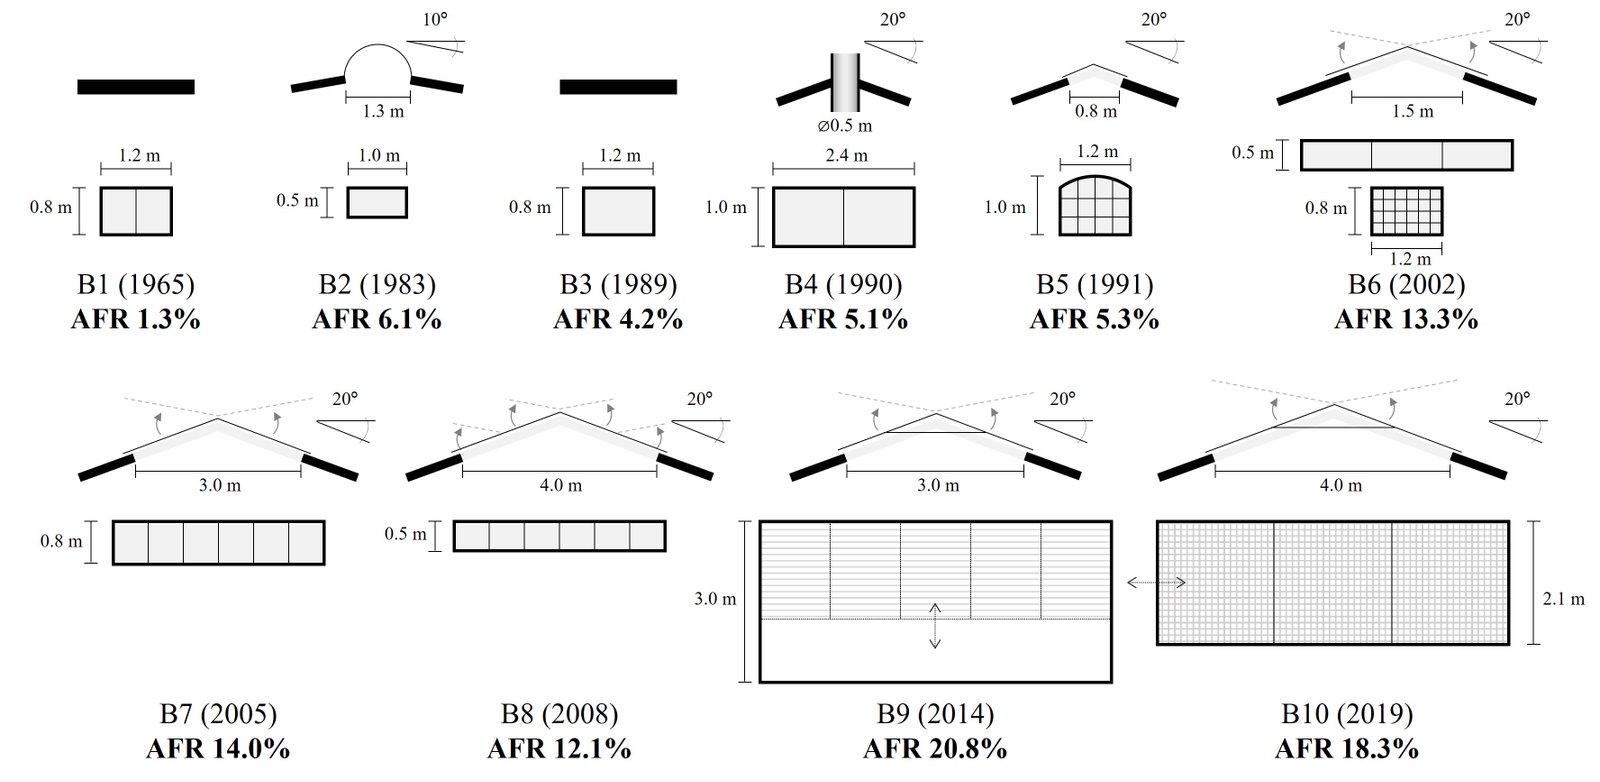
Fig. 7. Visual comparison of windows and apertures between the barns, showing the difference in AFR values. The barns are arranged in two rows and ordered by year of construction from left to right. The figure is illustrative and not to exact scale.
It is evident from Fig. 7 that the number of windows and apertures has increased throughout the years, resulting in a higher AFR. This is likely in response to both daylighting and natural ventilation needs. Older barns seldom had large skylights, which is a relatively common practice in recent years. The skylights have been increasing in size throughout the years; however, their design has remained quite similar. Older barns had small wall windows, gradually replaced by high windows and, later, open wall systems with curtains or nets for improved ventilation. While this leads to improved daylight illumination, it could also increase the risk for overheating, especially in North-South elongated barns as mentioned before. More research is needed to optimise the design of apertures to get a desired variation in daylight illuminance.
The area-weighted average material reflectance of the major interior building materials is presented in Fig. 8 along with a pictorial representation. The image indicates a preference for lighter-coloured materials in more recent constructions. Older barns often have darker-coloured materials and higher soiling levels, which reduce interreflections. The use of more metal and concrete was also observed in recent barns. A gradual rise of higher mean material reflectance can be observed in Fig. 8 throughout the years, except for barn B2 built in 1983. This farm has higher mean material reflectance compared to its contemporaries, which possibly caused a higher illuminance, partially owing to a white sprayed foam insulation on corrugated metal roof. Corrugated metal roofs have been a dominant roofing material in recent years; however, they are carbon-intensive and can cause overheating issues if not insulated. Lower parts of the walls are often painted in a darker colour for maintenance reasons, while upper parts are painted in lighter colours. Many recent barns also used corrugated metal and polycarbonate sheets in upper parts of the walls. Flooring materials often have very low material reflectance, due to soiling and cattle manure. Building materials can become very dirty; therefore, luminaires cannot perform as they should because of low material reflectance.
Figure 8
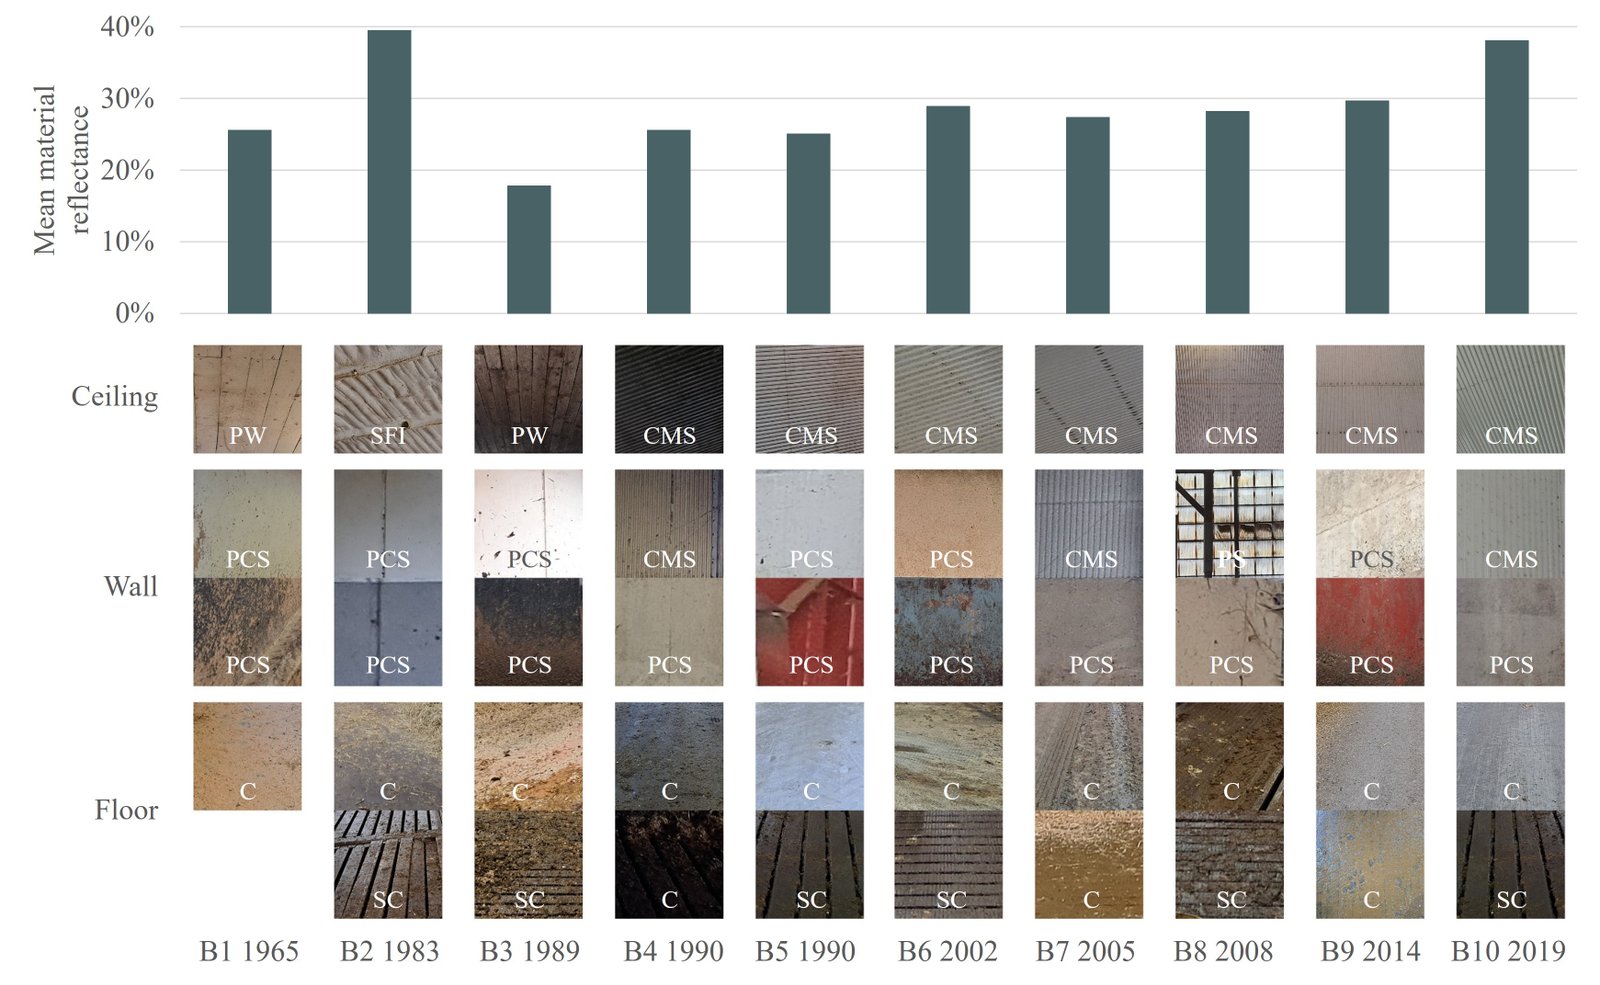
Fig. 8. A comparison of area-weighted average material reflectance between the barns (top) and a pictorial representation of the major building materials (bottom). The material types are presented with the pictures. PW = Painted wood, SFI = Sprayed foam insulation on corrugated metal sheet, CMS = Corrugated metal sheet, PCS = Painted concrete surface, PS = Polycarbonate sheet, C = Concrete, usually covered with wood chips or hay, SC = Slatted concrete, highly soiled.
3.3. Assessment of daylighting and electric lighting performance
The measured DF values along the central axes of the barns showed highly varying values between barns with different characteristics. The B4 barn built in 1990 and B9 barn built in 2014 (Fig. 5) were evaluated and measured on the same day one hour apart under an overcast sky. The older barn had few skylights and small and dirty windows on the facades with 5.1 AFR and 14 visual transmittance (Fig. 7). The results show that the DF in the B4 barn (1990) along the central axis 20.0 m from the barn entrance was very close to 0.0 , while the DF in the new barn measured in the same location was 7.0 . Photographs taken with the same camera configuration (ISO 360, aperture 3.2, and shutter speed 1/10, daylight white balance mode) on the survey day presented in Fig. 9 show the great difference in daylighting conditions between the older barn (left) and newer barn (right).
Figure 9
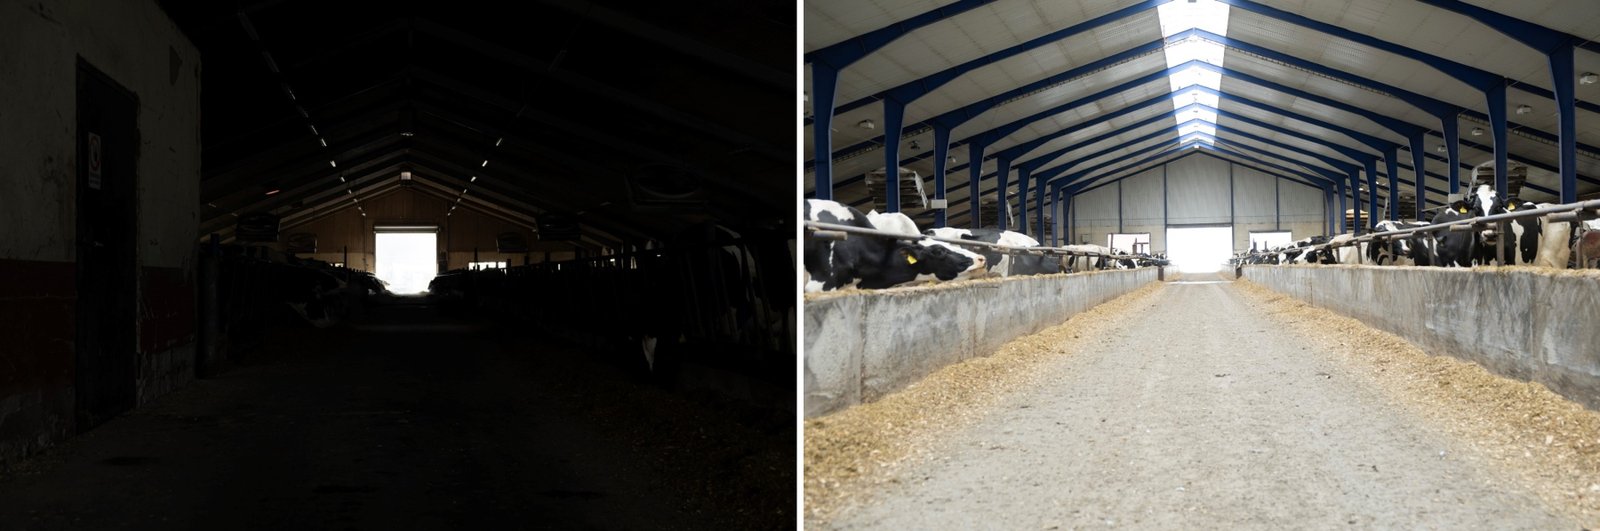
Fig. 9. Comparison of two dairy barns, B4 barn built in 1990 (left) and B9 barn built in 2014 (right), photographed with the same camera settings, same barn orientation, on the same day, and under a similar sky condition, showing the contrast created by substantially different DF.
The daylighting simulation results are presented in Fig. 10. The barns are arranged by year of construction. Barn B1-B5 are constructed pre-2000s and B6-B10 barns are constructed post-2000s. The daylight analysis of the barns reveals a clear trend of improving daylighting performance in more recently constructed barns:
Figure 10
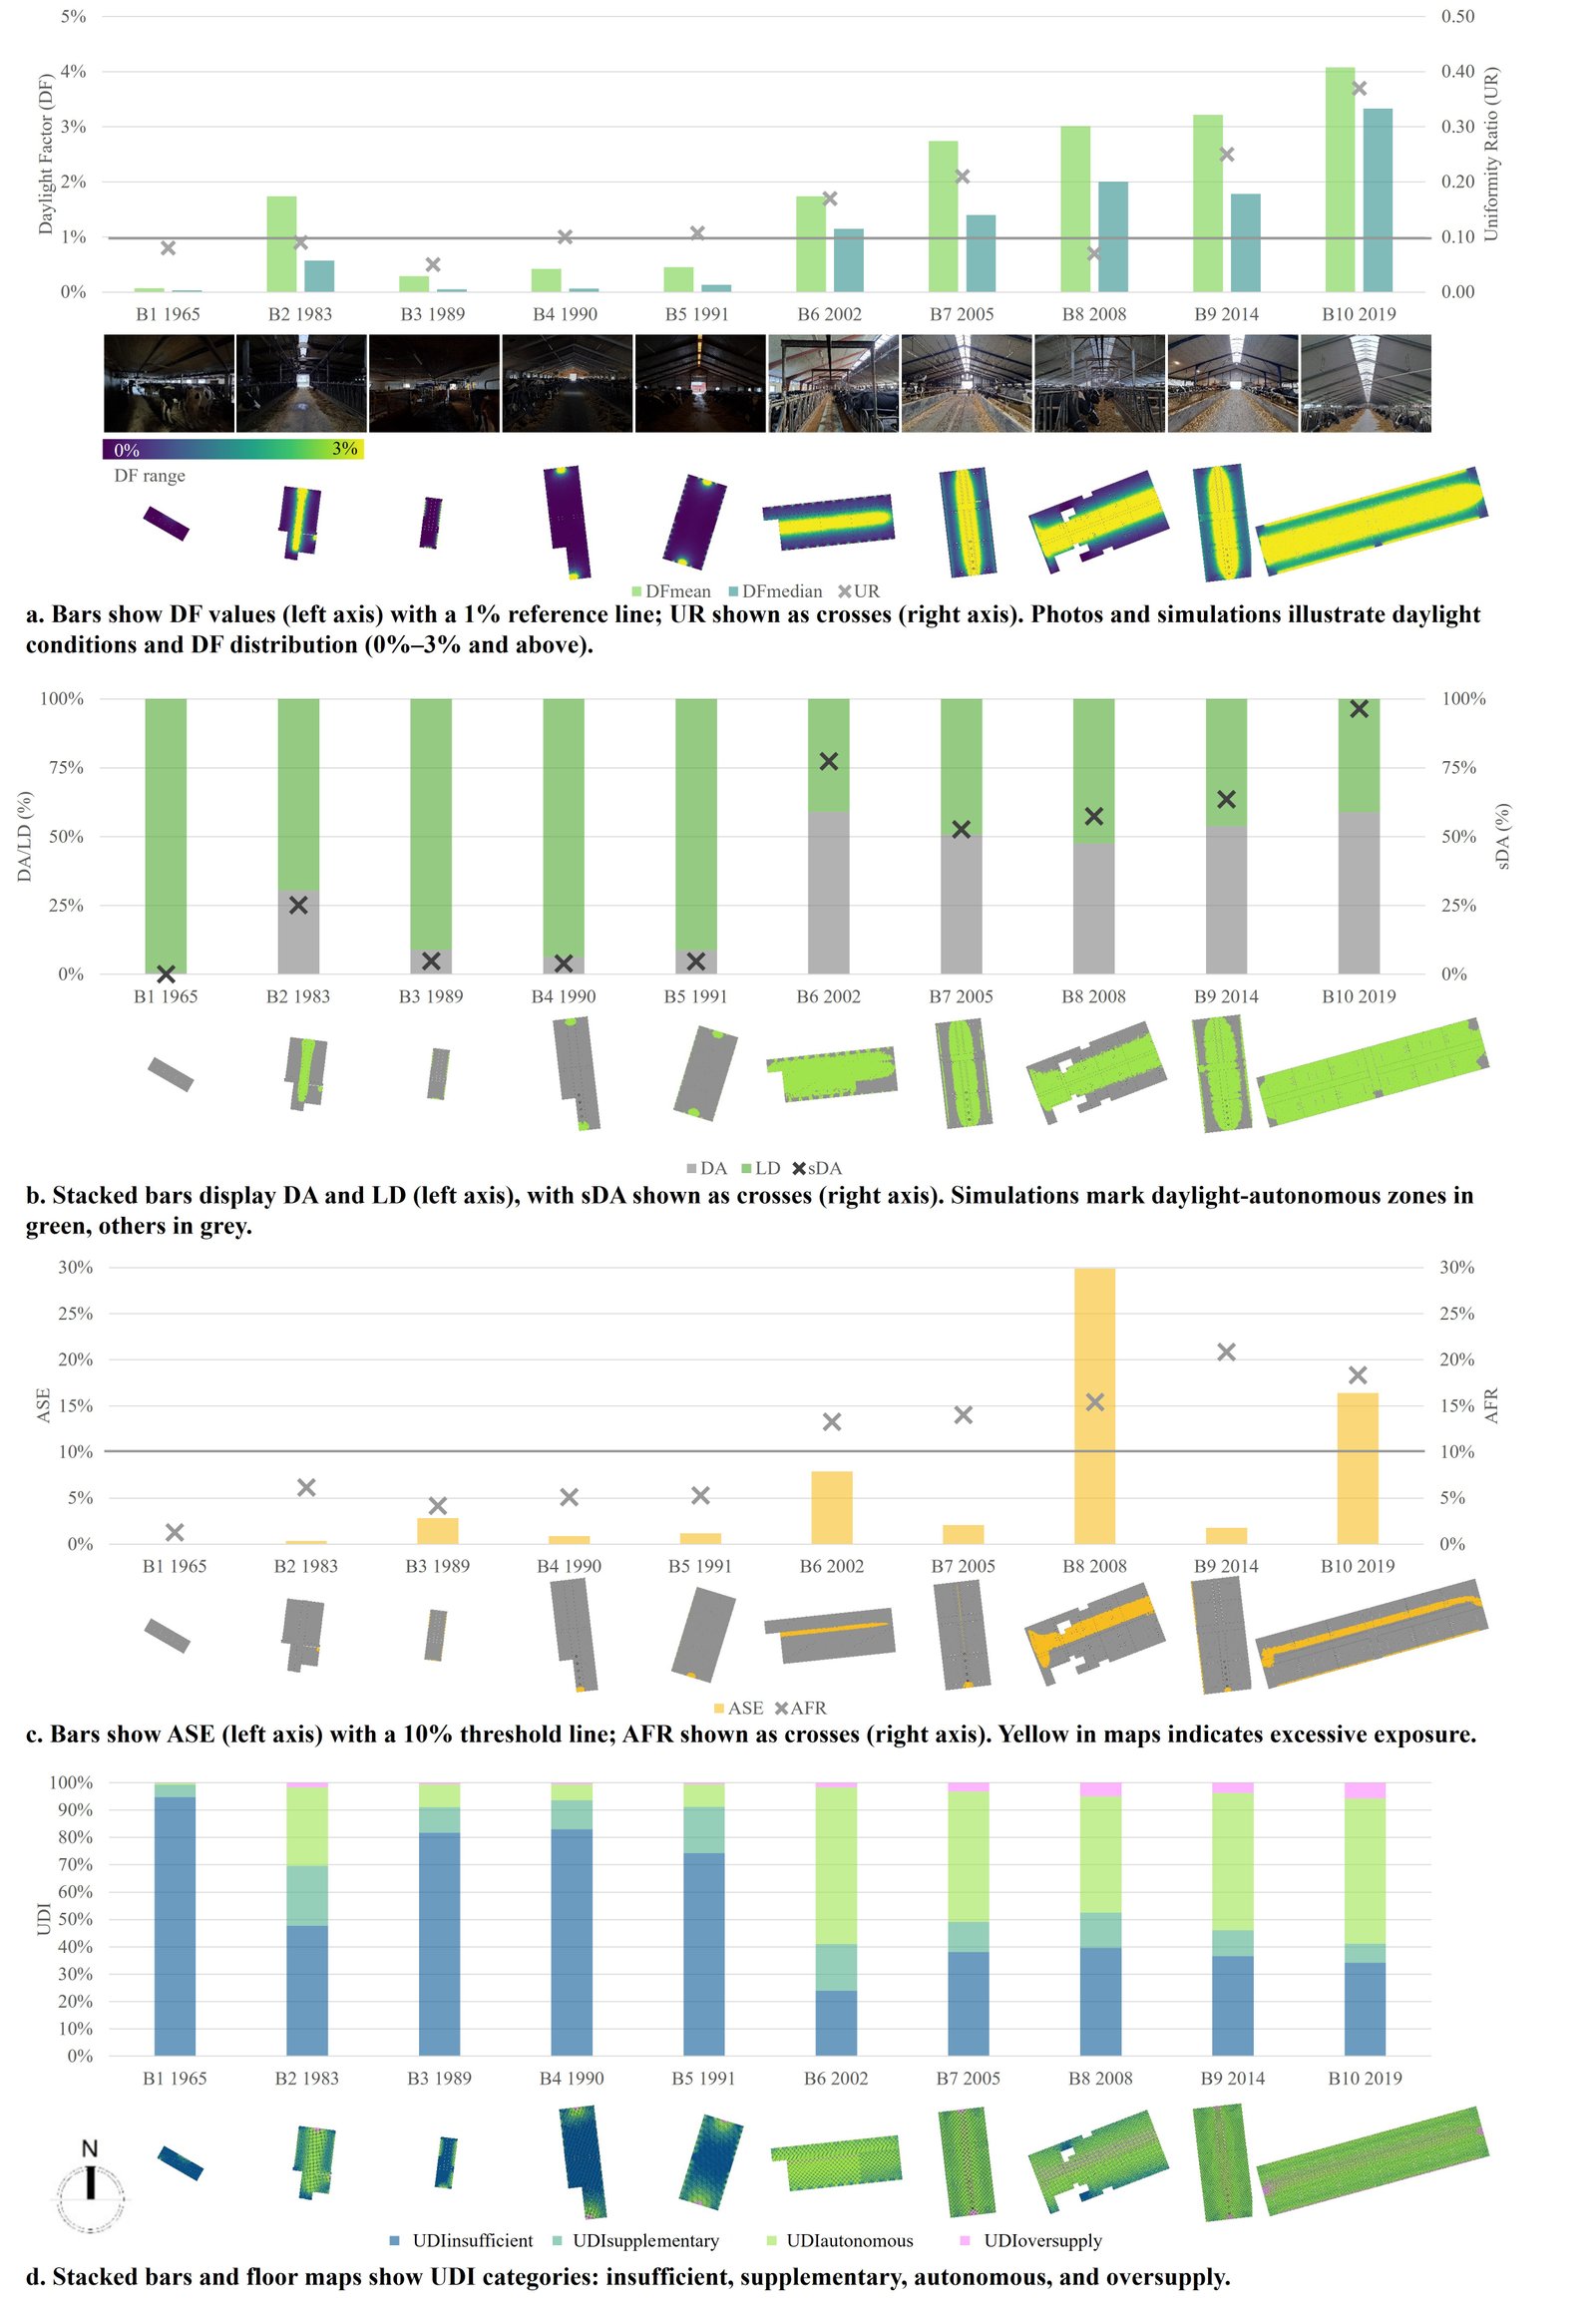
Fig. 10. Daylight performance metrics of 10 dairy barns (B1–B10) arranged chronologically by construction year. Barn B1-B5 are constructed pre-2000s and B6-B10 barns are constructed post-2000s. Results include simulation outputs for key daylighting metrics. North is upwards in all plans.
Figure 3 indicates that increasing the DF to 3 would make the barns autonomous in illumination the majority (i.e., 74 ) of daylight hours, offering substantial energy savings. However, Fig. 10 shows that most pre-2000 barns did not maintain a DFmedian of 1 %, the benchmark used in buildings for humans [27], which can also keep the barns autonomous in illumination for 45 % of the daylight hours (Fig. 3). On the other hand, post-2000s barns consistently had a DFmedian higher than 1 . Barn B8 (2008) underperformed in the on-site measurements due to dust, snow on skylights, and facade polycarbonate sheets, an isolated case caused by snowfall the previous day. Regular maintenance could significantly improve its lighting performance, as suggested by simulation results.
Generally, barns with larger windows and open facades had higher DFmedian in general, while barns with smaller windows and skylights often had a DFmean very close to zero. High-performing barns were mostly newly built ones. However, very high DF can create a risk for overheating if ventilation is inadequate. In this study, light levels exceeding 2 000 lux were considered a potential risk of overheating, but this assumption requires further research. Older barns typically failed to reach the minimum required threshold of 150 lux [17,18]. These barns were mostly reliant on electric lighting throughout the year, except for barn B2 (Fig. 10). Newer barns achieved significant DA but often lacked proper lighting control or automatic sensors to fully utilize it.
The results from the electric lighting simulations are presented in Fig. 11. These show that electric lighting conditions vary among the studied barns. The mean illuminance ranged from 57 to 157 lux. Median values were generally lower, indicating skewness in lighting distribution. UR remained below 0.12 for all barns, suggesting relatively uneven lighting distribution. Illuminance distribution maps highlight spatial variability, with several barns exhibiting significant areas below recommended lux level. Overall, newer barns did not consistently show improved lighting uniformity or higher illuminance compared to older structures. The LPD of the barns ranged from 0.7 to 2.7 W/m², except for Barn B1 exhibiting an exceptionally high LPD of 6.7 W/m².
Figure 11
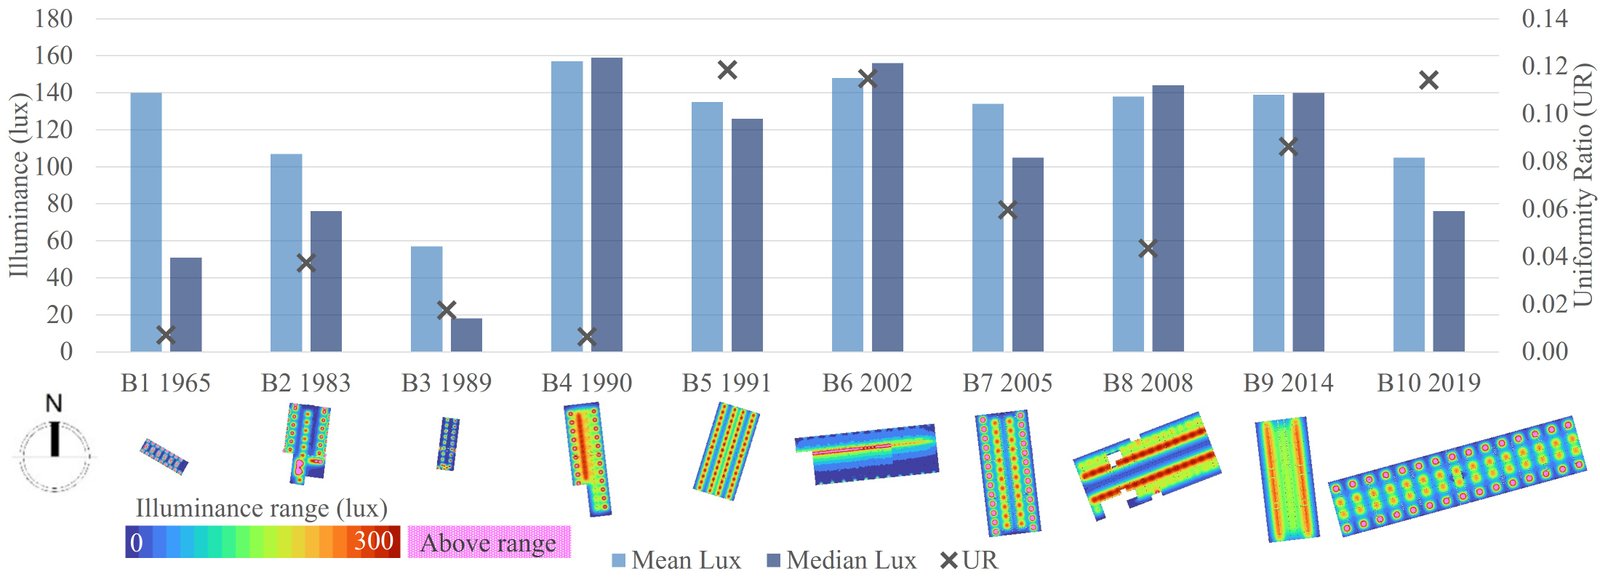
Fig. 11. Comparison of electric lighting conditions in the barns. The bar chart shows the simulated mean and median illuminance (lux) for each barn. The axis on the right indicates the uniformity ratio (UR). A corresponding illuminance distribution map visually represents the spatial lighting conditions within each barn. North is upwards in all plans.
Table 3 shows that most barns have luminaires mounted at ceiling level, which can result in a higher required LPD since the luminous flux is spread over a larger area. However, most of the barns had very low LPD. Barn B1 had an unusually high LPD, oversized lighting, and the luminaires were placed at a very low level (2.5 m). Half of the luminaires were turned off all the time to tackle this. The luminaires were often switched on even during the day in barns without automatic dimmers or light controls, indicating inefficient design and the need for proper lighting calculations. Newer barns mostly had automatic lighting control systems, while some older barns still rely on manual controls. The daylighting analysis indicated that most barns cannot run without electric lighting even during daylight hours (Fig. 10), resulting in high electricity costs. In barns with flat roofs, luminaires were generally mounted at the same height, while in sloped roof barns, they followed the roof inclination, leading to poorer UR. Four barns still use fluorescent lamps and one of them has partially upgraded to LEDs. All owners considered switching completely to LED in the near future.
Although cattle are dichromats and perceive light differently from humans [68], the instruments used in this study were chosen because lighting guidelines and norms are primarily based on human visual perception. Nonetheless, using human-centric measurements has its limitations, as cattle experience light intensity and quality differently than humans [69-71]. Daylight simulations slightly over- or underestimated DF values due to local shading, window reflectance, or sensor positioning. Electric lighting discrepancies likely reflected real-world variations in luminaire output, aging, and room reflectance. Despite these differences, most simulations matched measurement results. However, on-site data were mostly from circulation areas, with fewer readings in cattle lying areas. Thus, simulations are more reliable for circulation zones, while results in lying areas may vary, especially due to the presence of cattle and heavily soiled surfaces.
3.4. Potential for lighting retrofits in older barns
Pre-2000 barns had low AFR (1-6 ), small and often dirty windows, no skylights, and dark interior materials, resulting in very low DF values ( 1 ). Limited daylight and poor material reflectance increased their reliance on electric lighting systems, which was also inefficient. Several retrofit strategies can address these deficiencies for better energy performance and animal welfare:
Government incentives or financial support programs are needed to help small and medium-sized farms adopt improved lighting systems and energy-efficient solutions.
3.5. Opportunities for improvement in future dairy barn constructions
Although post-2000 barns performed better, inconsistencies in daylight utilization and electric lighting efficiency indicate room for improvement. Developing specific illumination guidelines especially focusing on introducing lighting performance metrics tailored to dairy barns would ensure consistent lighting quality and promote better animal welfare across the sector. Design strategies for future barns should include:
4. Conclusion
Although this study was limited by the small sample size and single-day measurements under overcast conditions, it highlighted important differences between buildings designed for dairy cattle with varying barn design characteristics and the resulting daylight availability and lighting performance. Within the broader research context, this study contributes to measurement and simulation-based evidence that links architectural design decisions to quantified lighting outcomes in operational dairy barns, which has been largely absent in previous studies. The study is crucial to address the regulatory and design gap between animal buildings and human-occupied buildings.
Most older barns in this study, constructed pre-2000 with small windows and no skylights, showed low daylight illuminance, achieving the 150 lux target during less than 25 of daylight hours and therefore depending largely on electric lighting. These barns typically exhibited Daylight Factor (DF) values below 1 , Aperture-to-Floor Ratio (AFR) of only 1-6 , and high lighting dependency throughout the year, clearly indicating suboptimal daylight provision. In contrast, newer barns with skylights and large windows achieved higher illuminance from daylight, meeting the 150 lux target for up to 75 of the daylight hours. These barns generally showed AFR values between 12-20 , DF values exceeding 1 %, and Daylight Autonomy (DA) levels consistent with achieving autonomous illumination for approximately 66-74 of daylight hours when DF approached 2-3 , as indicated by the cumulative diffuse illuminance analysis. However, despite improvements in newer barns, electric lighting systems often lacked switch-off or dimming control systems and failed to provide adequately uniform illumination. Across all barns, electric lighting uniformity ratios remained low and mean electric illuminance ranged from 57 to 157 lux, demonstrating that improvements in daylighting alone do not guarantee adequate or evenly distributed illumination without coordinated electric lighting design and controls. This article suggests the following recommendations to improve illumination in dairy barns:
Future research should include long-term monitoring across seasons, expand to more farms across broader geographical areas, assess the impact of AFR and building orientation on overheating and natural ventilation, evaluate lighting impacts on animal behaviour and productivity, and explore the economic concerns considering reduced electricity use and increased milk yield from retrofit measures. However, small and medium farms may find the investment hard to justify without government incentives. Additionally, since agricultural buildings are not subjected to the same design standards as human-occupied buildings in Sweden, establishing specific illumination guidelines including lighting performance metrics tailored to animal buildings would be a crucial step forward. Future work could explore how retrofitting older barns and applying optimized design strategies in new constructions may enhance both energy performance and animal welfare.
Acknowledgement
The authors are grateful to Anna Lindqvist, Swedish University of Agricultural Sciences, Alnarp for her support in correspondence with the farmers, site visit logistics, and support during and after the surveys. Thanks to Ishrat Laila Nowrin, Momax Arkitekter, Sweden, for her help with the Revit models. Thanks to Karl Axel Nordin and Phoo Wint Zaw from Lund University, Sweden, for their help with measurements and data collection in three barns. The authors also thank all the farmers and the co-workers at the farms for their generous support and cooperation.
Funding
This work was supported by Swedish Energy Agency (Statens energimyndighet, Eelys program, grant number P2022-000192), Bertil och Britt Svenssons Stiftelse för Belysningsteknik (grant number 20250019), and the Department of Biosystems and Technology, at Swedish University of Agricultural Sciences (SLU), Sweden.
Author Contributions
Sheikh Rishad Ahmmad: Writing - Original Draft, Writing - Review and Editing, Conceptualization, Methodology, Validation, Formal analysis, Investigation, Visualization, Funding acquisition. Niko Gentile: Writing - Review and Editing, Methodology, Supervision. Maria Vilain Rørvang: Writing - Review and Editing, Supervision, Project administration, Funding acquisition. Knut-Håkan Jeppsson: Writing - Review and Editing, Supervision. Marie-Claude Dubois: Writing – Review and Editing, Conceptualization, Methodology, Supervision, Project administration, Funding acquisition.
Declaration of competing interest
The authors declare that they have no known competing financial interests or personal relationships that could have appeared to influence the work reported in this paper.
References
2383-8701/© 2026 The Author(s). Published by solarlits.com. This is an open access article distributed under the terms and conditions of the Creative Commons Attribution 4.0 License.

1125
Total views
Citations
SHARE ON


