Article | 7 April 2026
Volume 13 Issue 1 pp. 167-195 • doi: 10.15627/jd.2026.10
Window Orientation, Glare, and Visual Comfort in Offices
Mehrdad Karimimoshaver,* Fatemeh Derakhshan
Author affiliations
Department of Architecture, Faculty of Art and Architecture, Bu-Ali Sina University, Hamedan, Iran
*Corresponding author.
mkmoshaver@basu.ac.ir (M. Karimimoshaver)
f.derakhshan@art.basu.ac.ir (F. Derakhshan)
History: Received 6 January 2026 | Revised 9 February 2026 | Accepted 18 February 2026 | Published online 7 April 2026
2383-8701/© 2026 The Author(s). Published by solarlits.com. This is an open access article distributed under the terms and conditions of the Creative Commons Attribution 4.0 License.
Citation: Mehrdad Karimimoshaver, Fatemeh Derakhshan, Window Orientation, Glare, and Visual Comfort in Offices, Journal of Daylighting, 13:1 (2026) 167-195. doi: 10.15627/jd.2026.10
Figures and tables
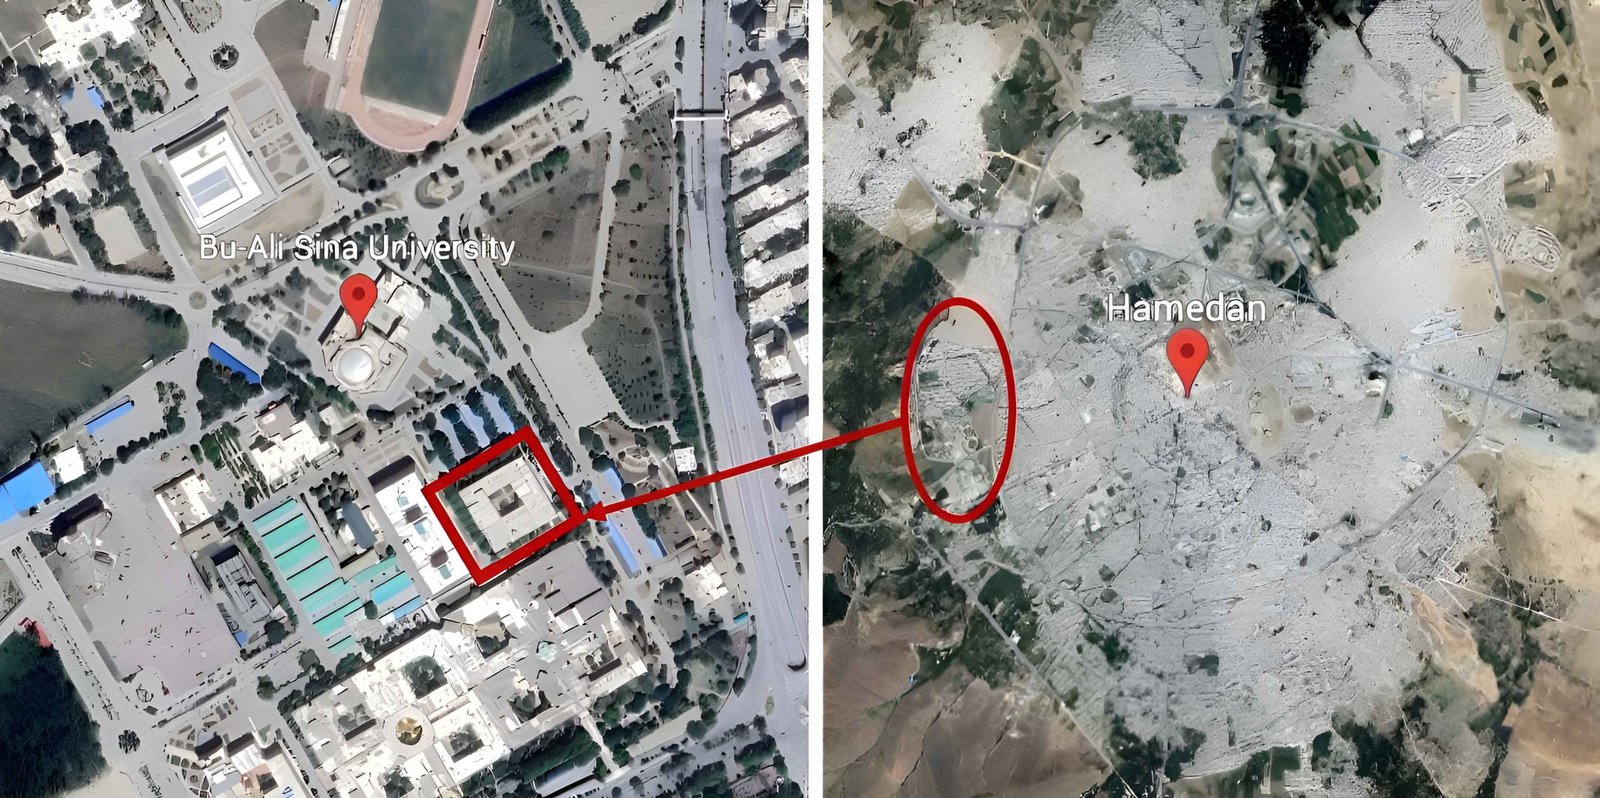 Figure 1
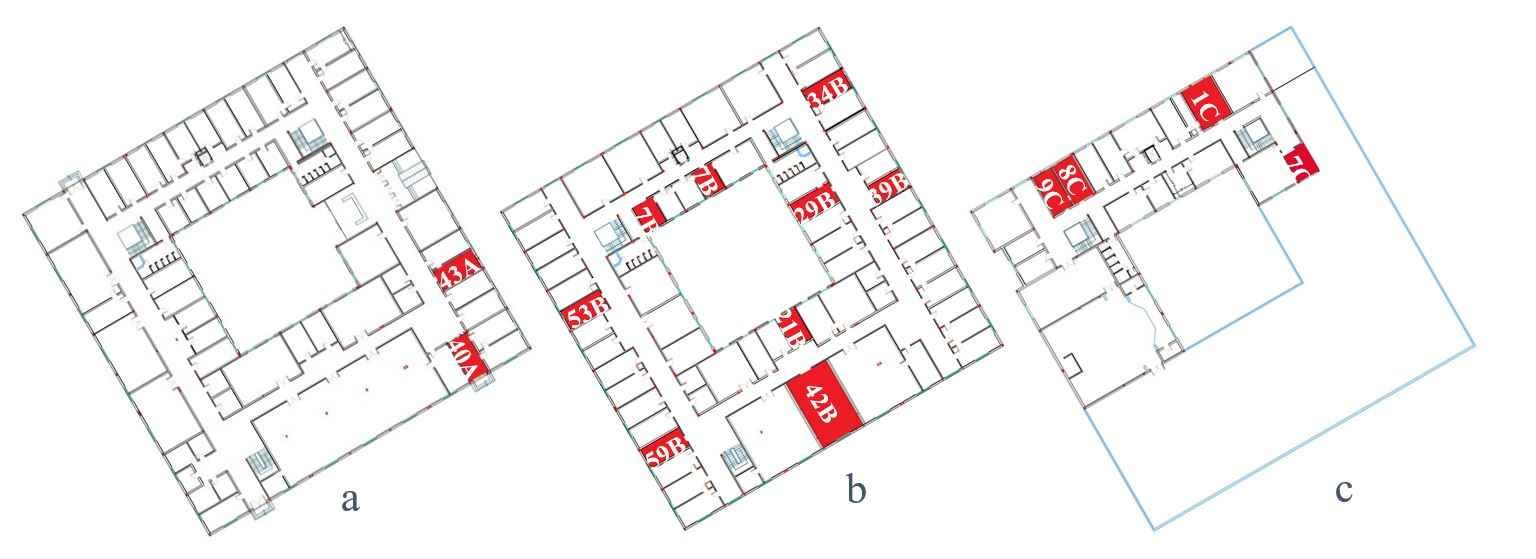 Figure 2
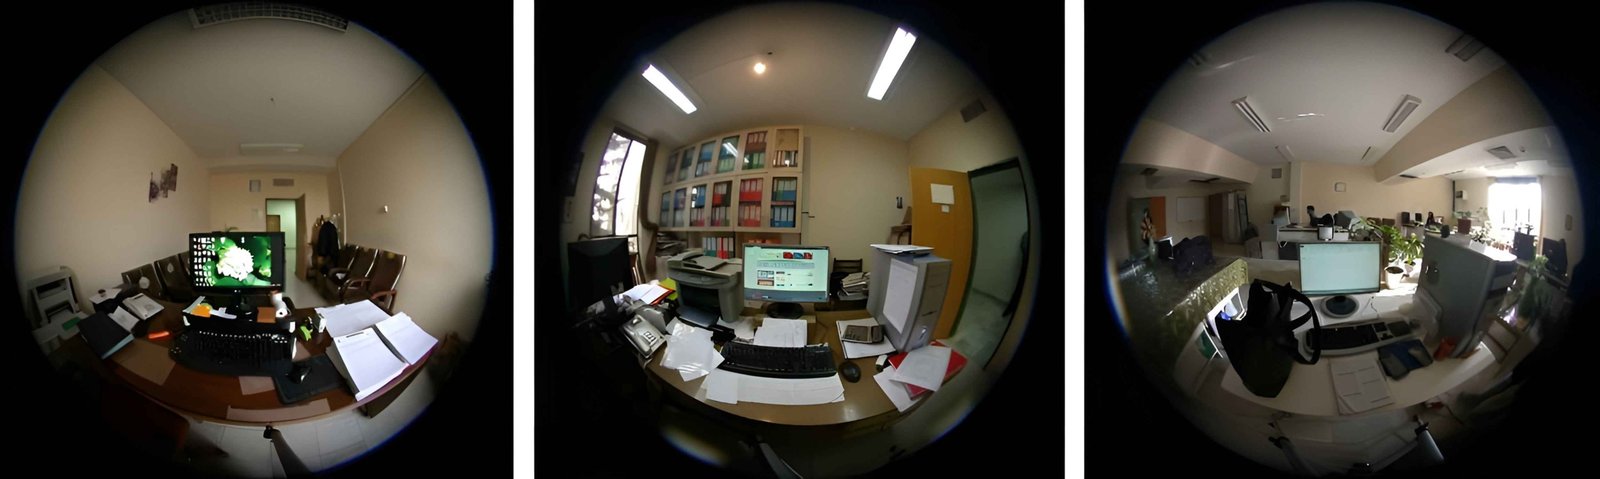 Figure 3
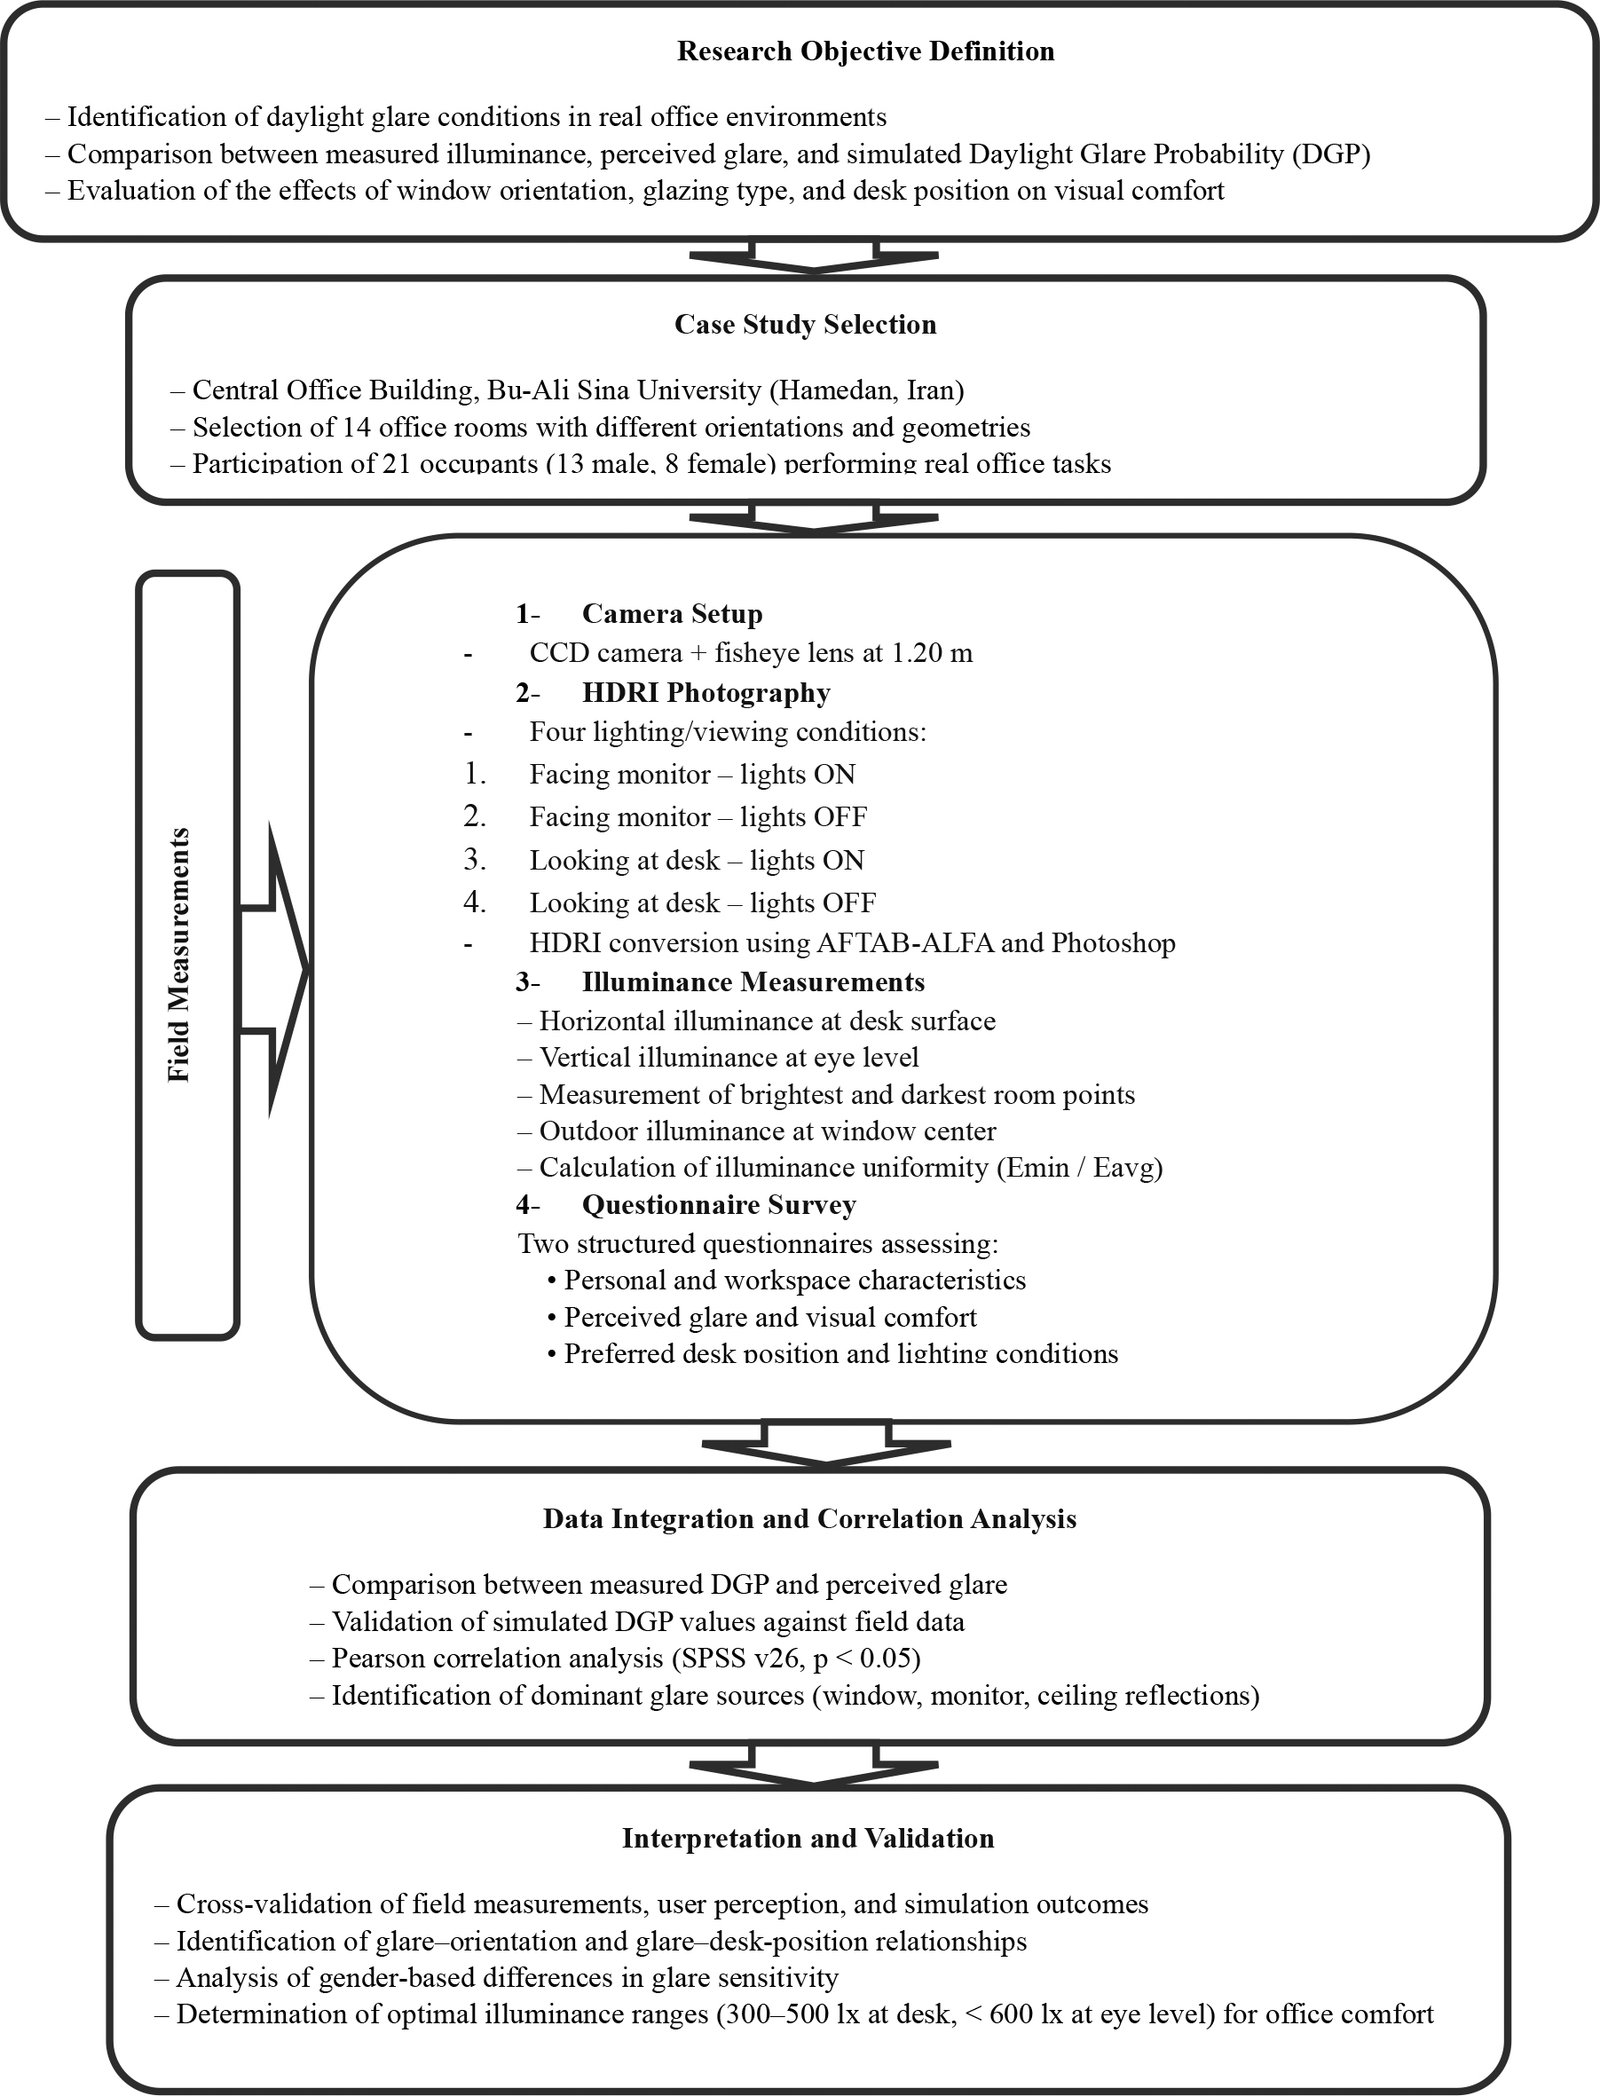 Figure 4
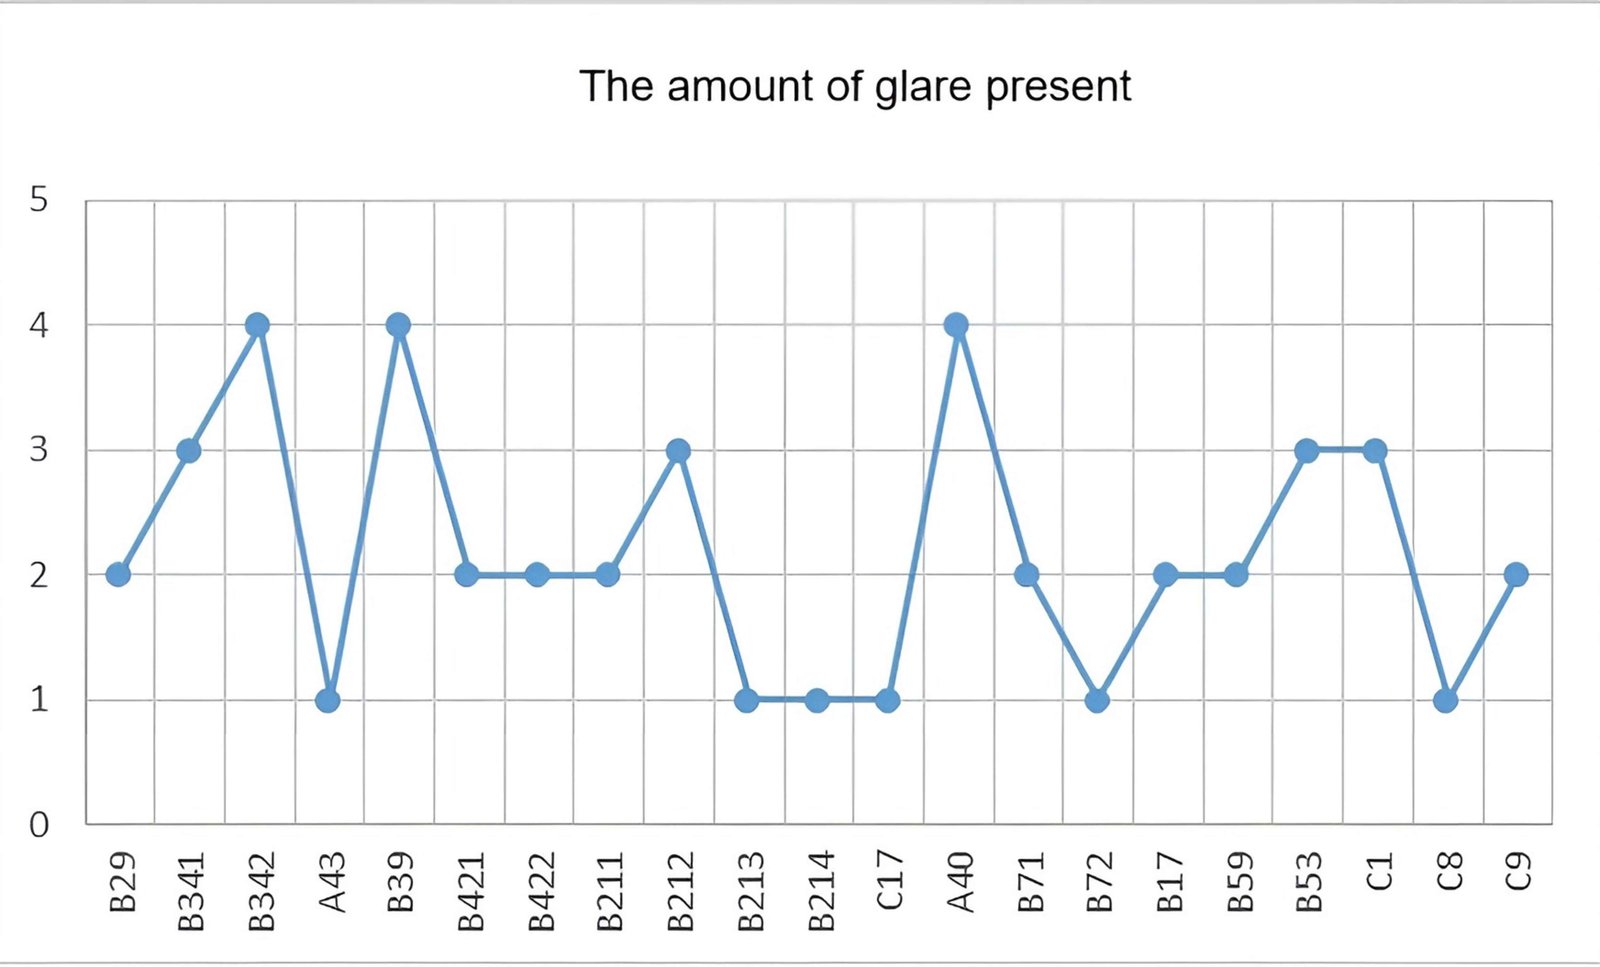 Figure 5
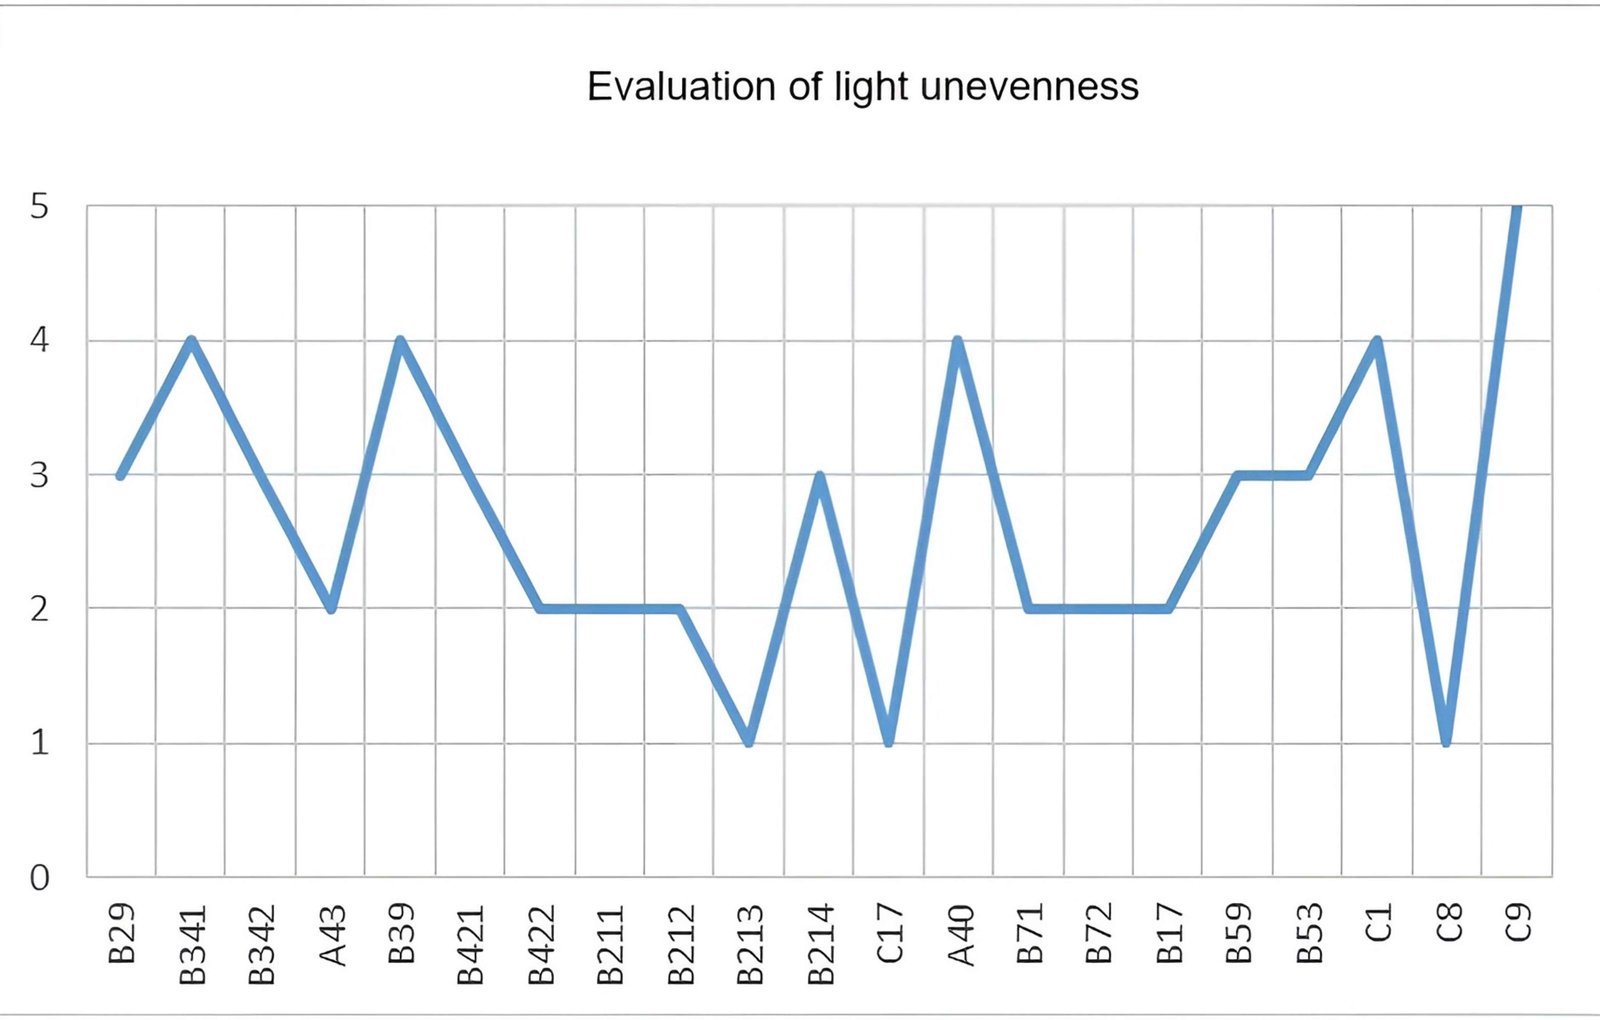 Figure 6
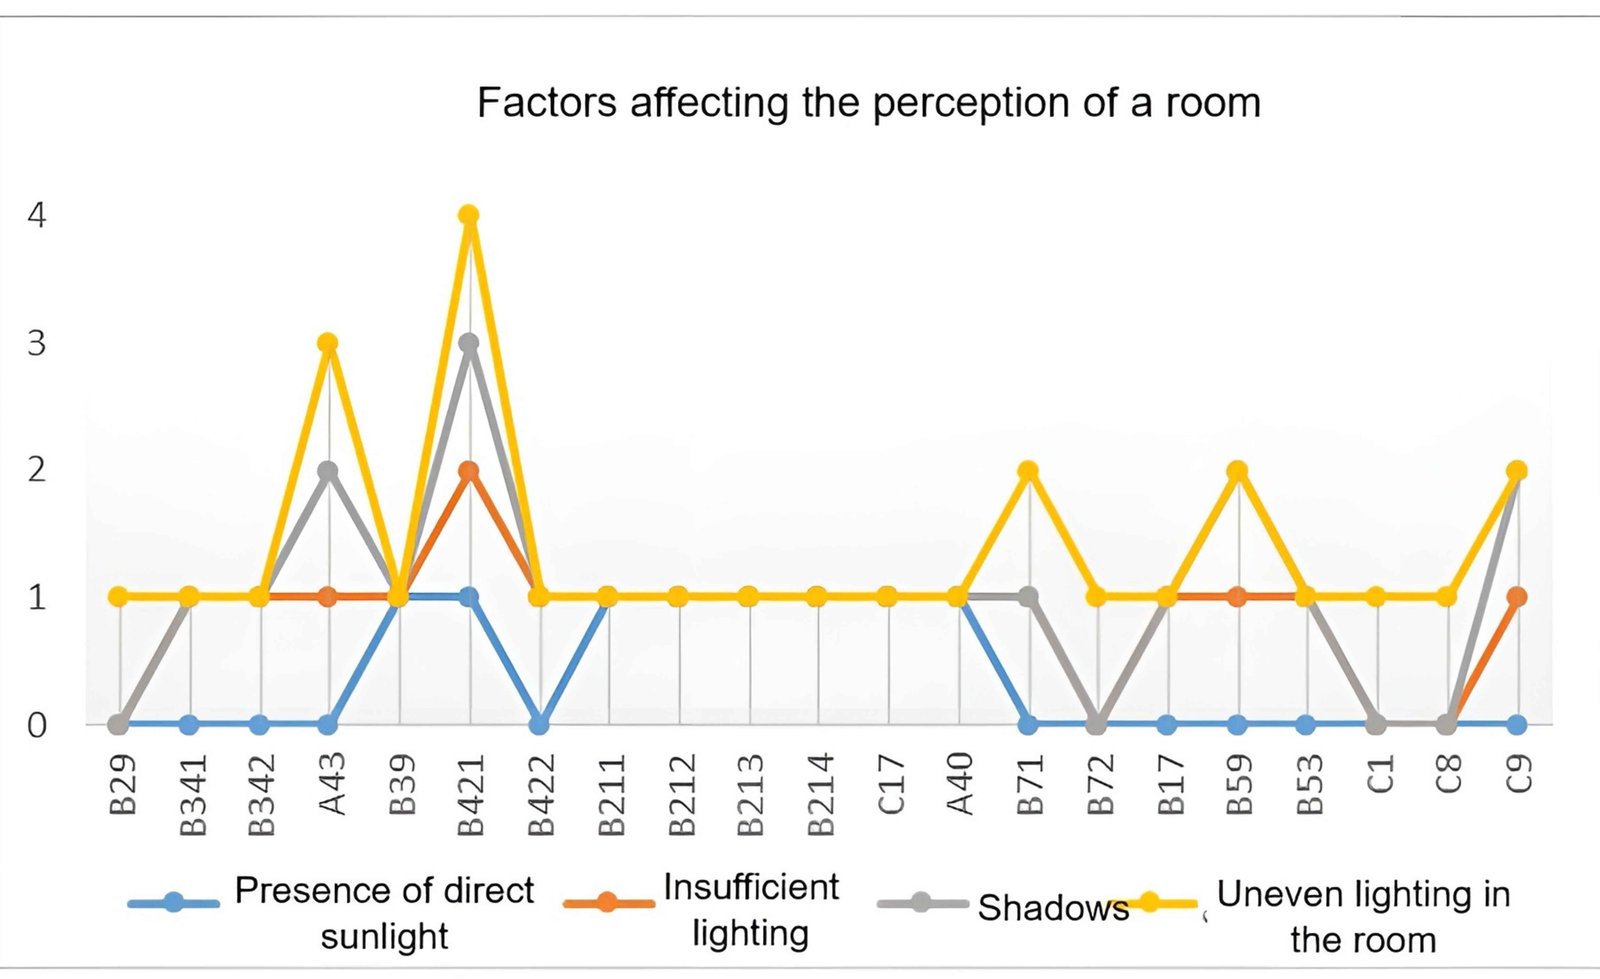 Figure 7
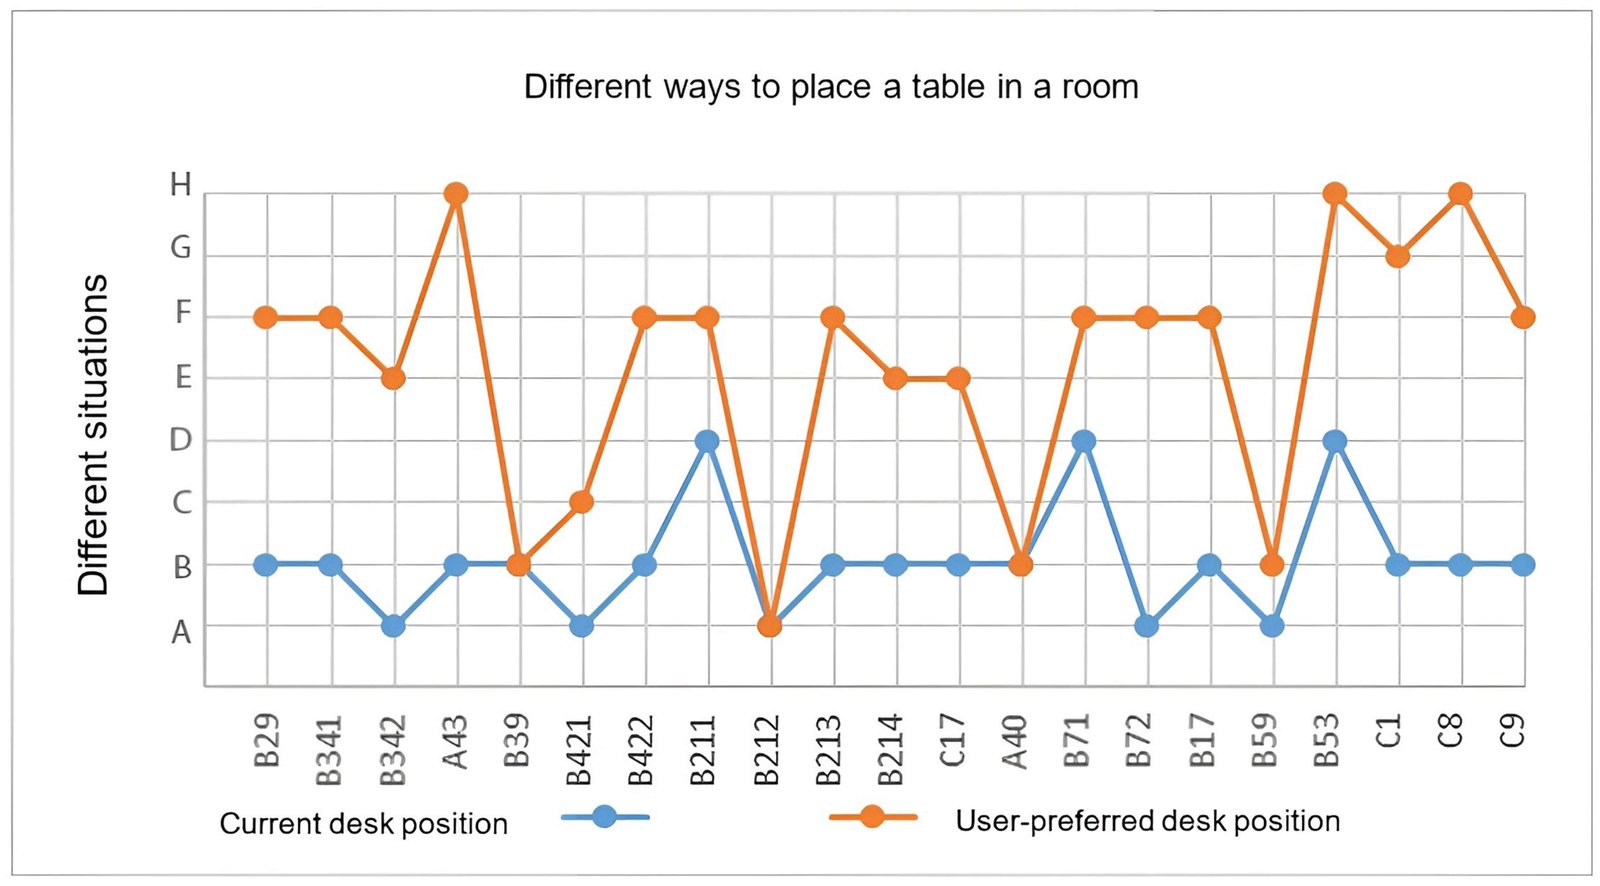 Figure 8
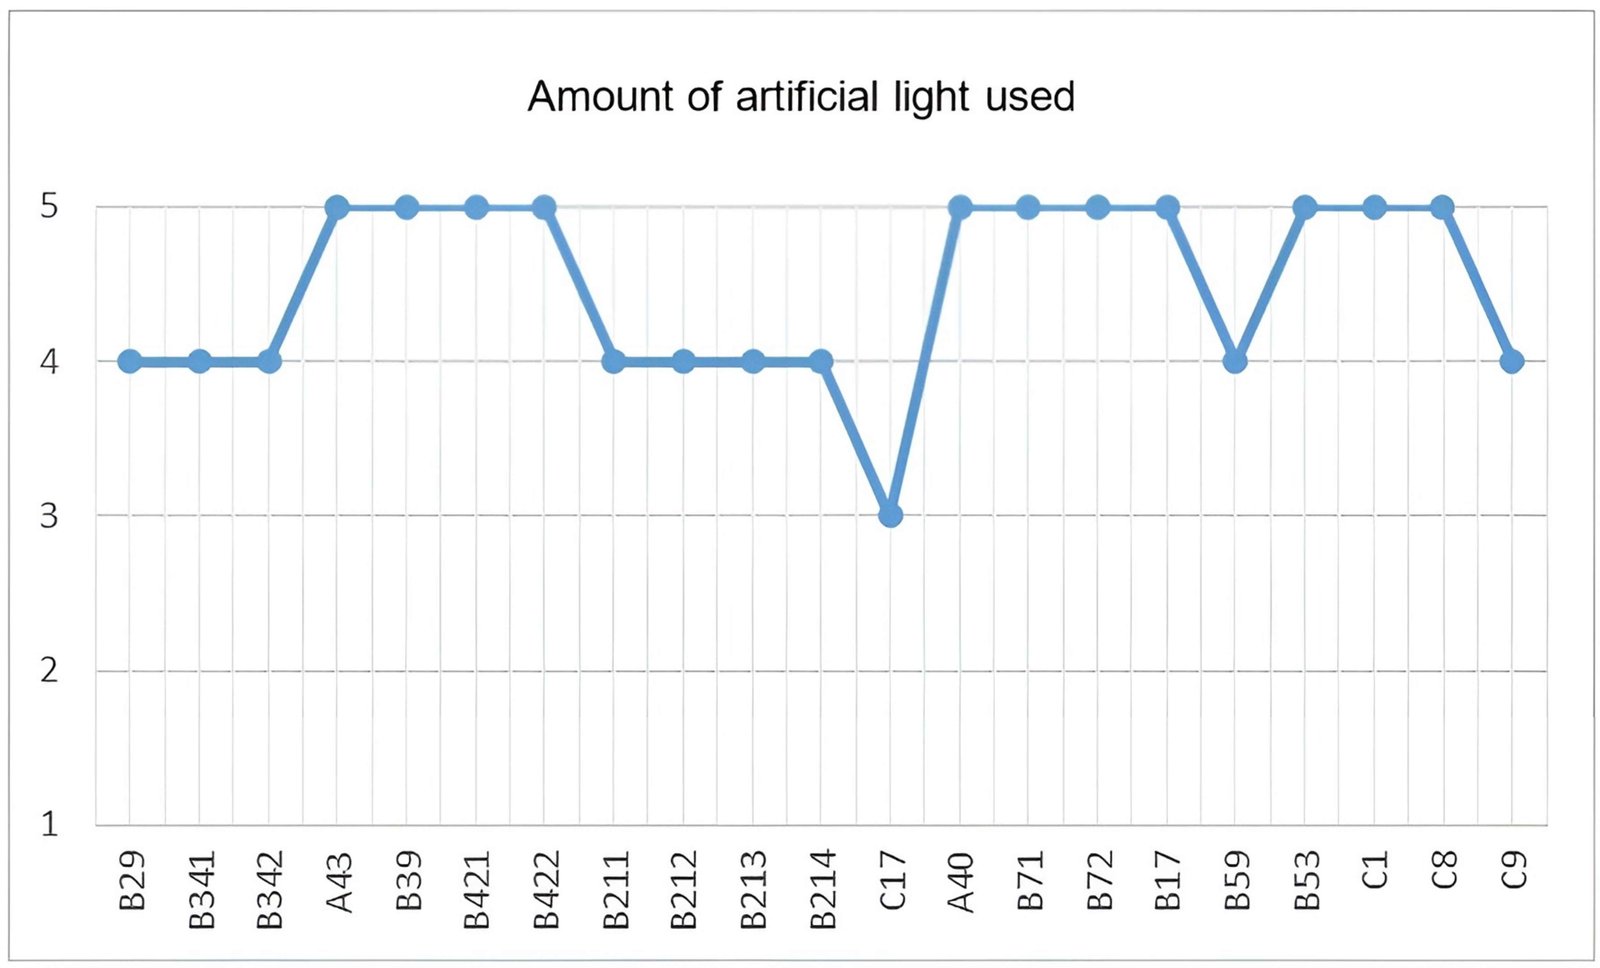 Figure 9
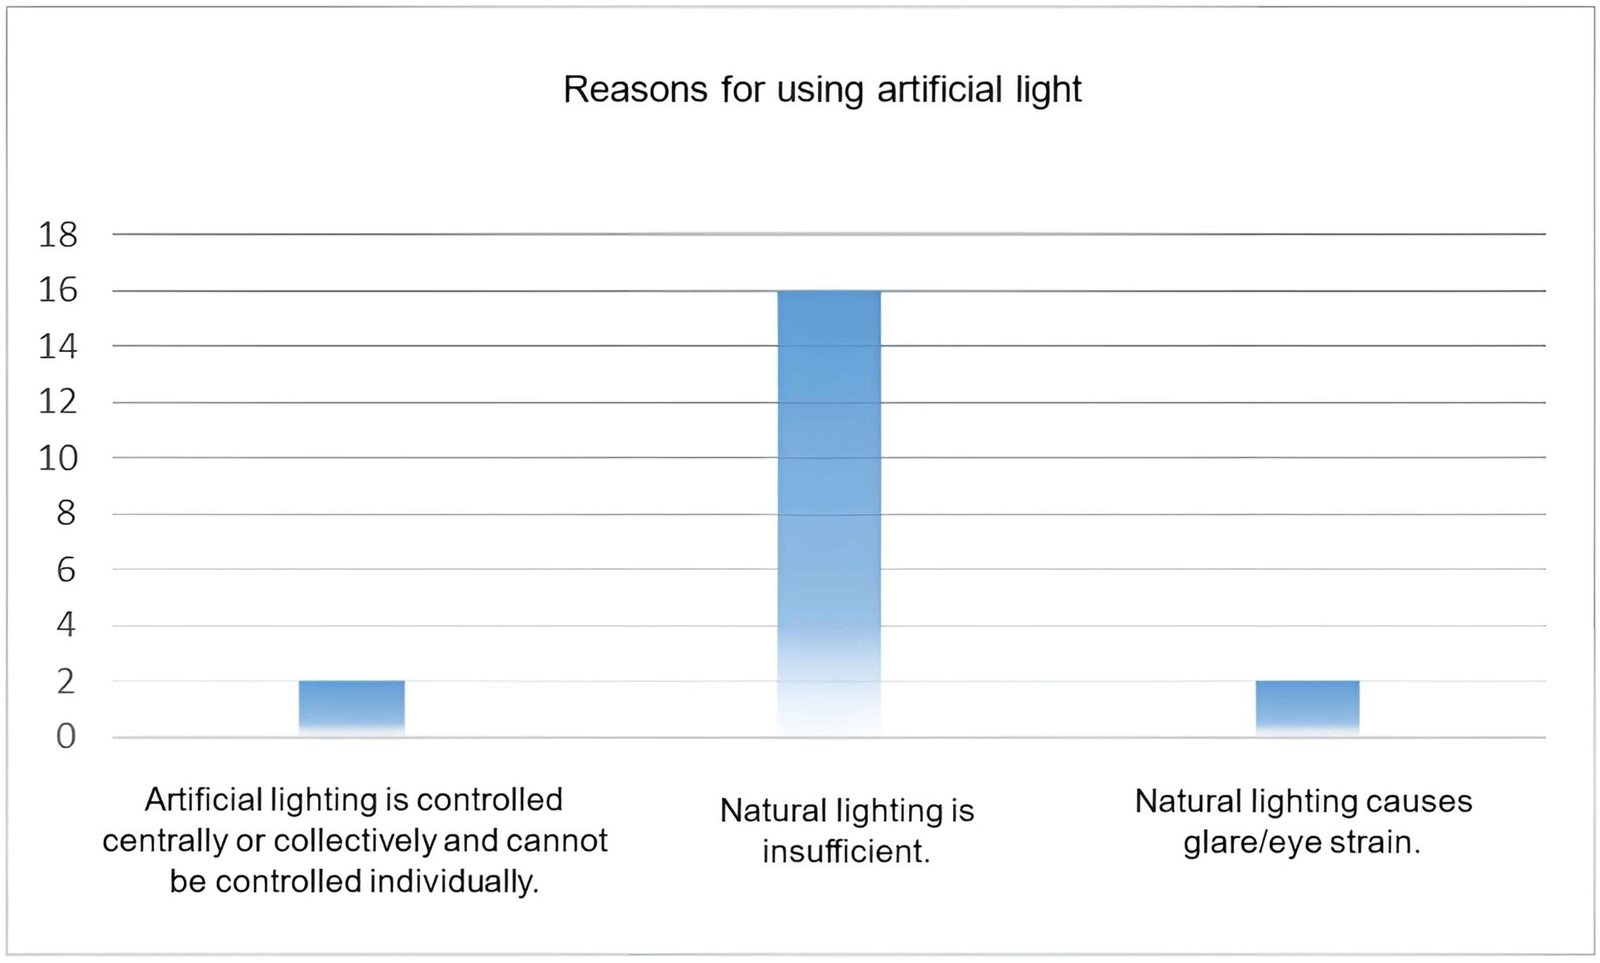 Figure 10
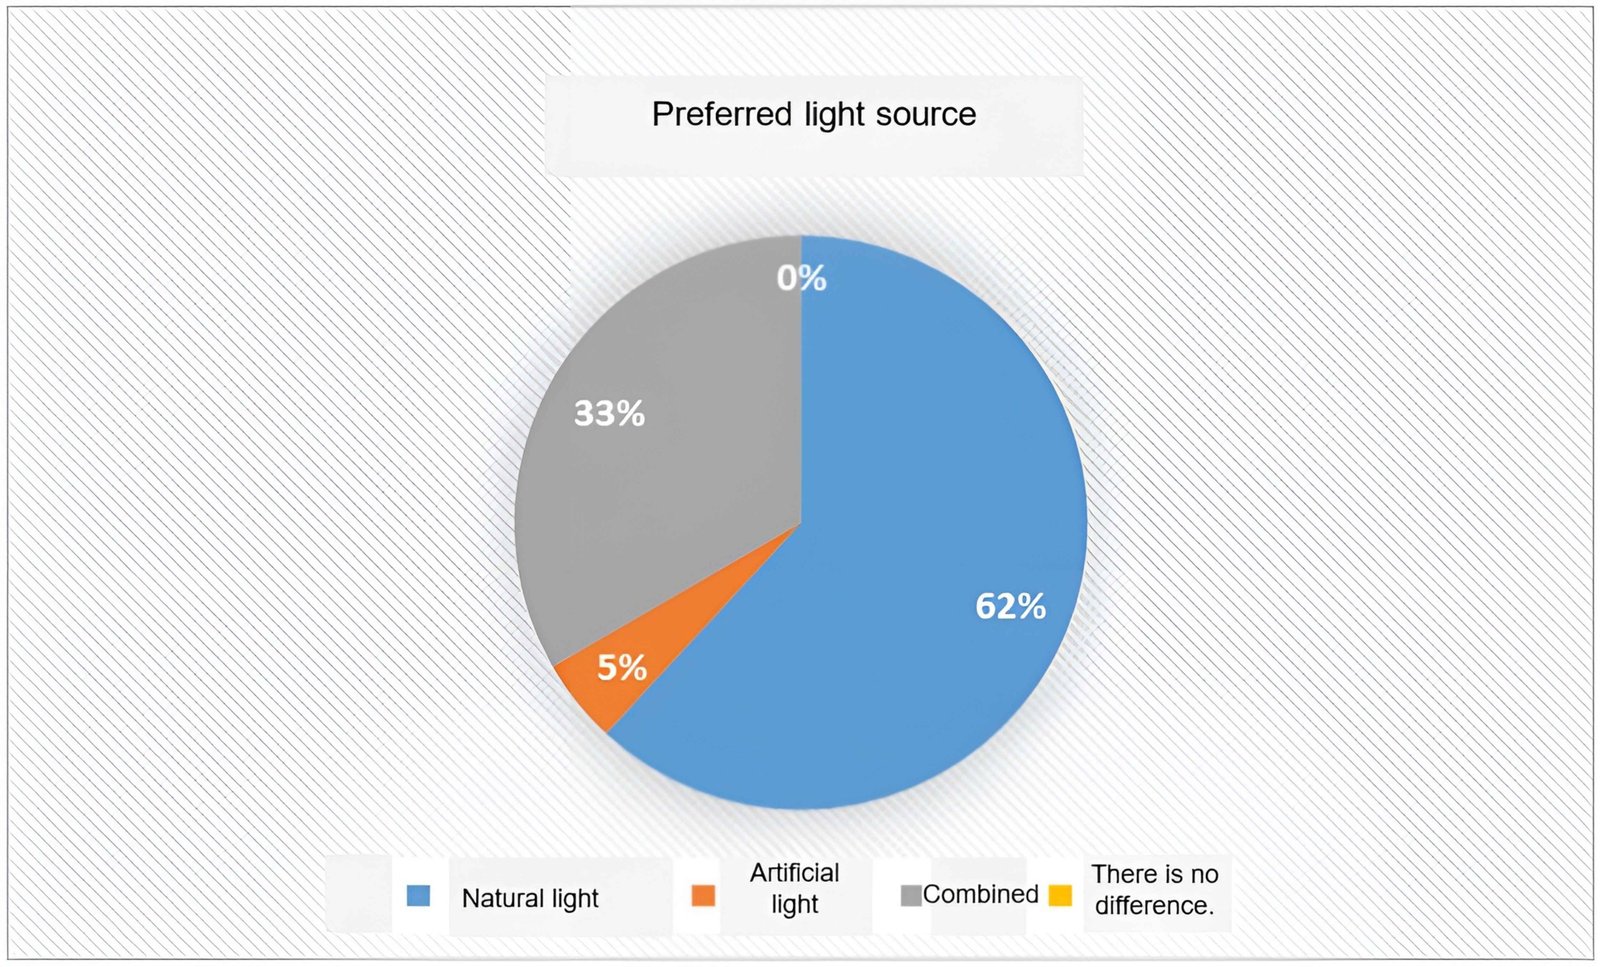 Figure 11
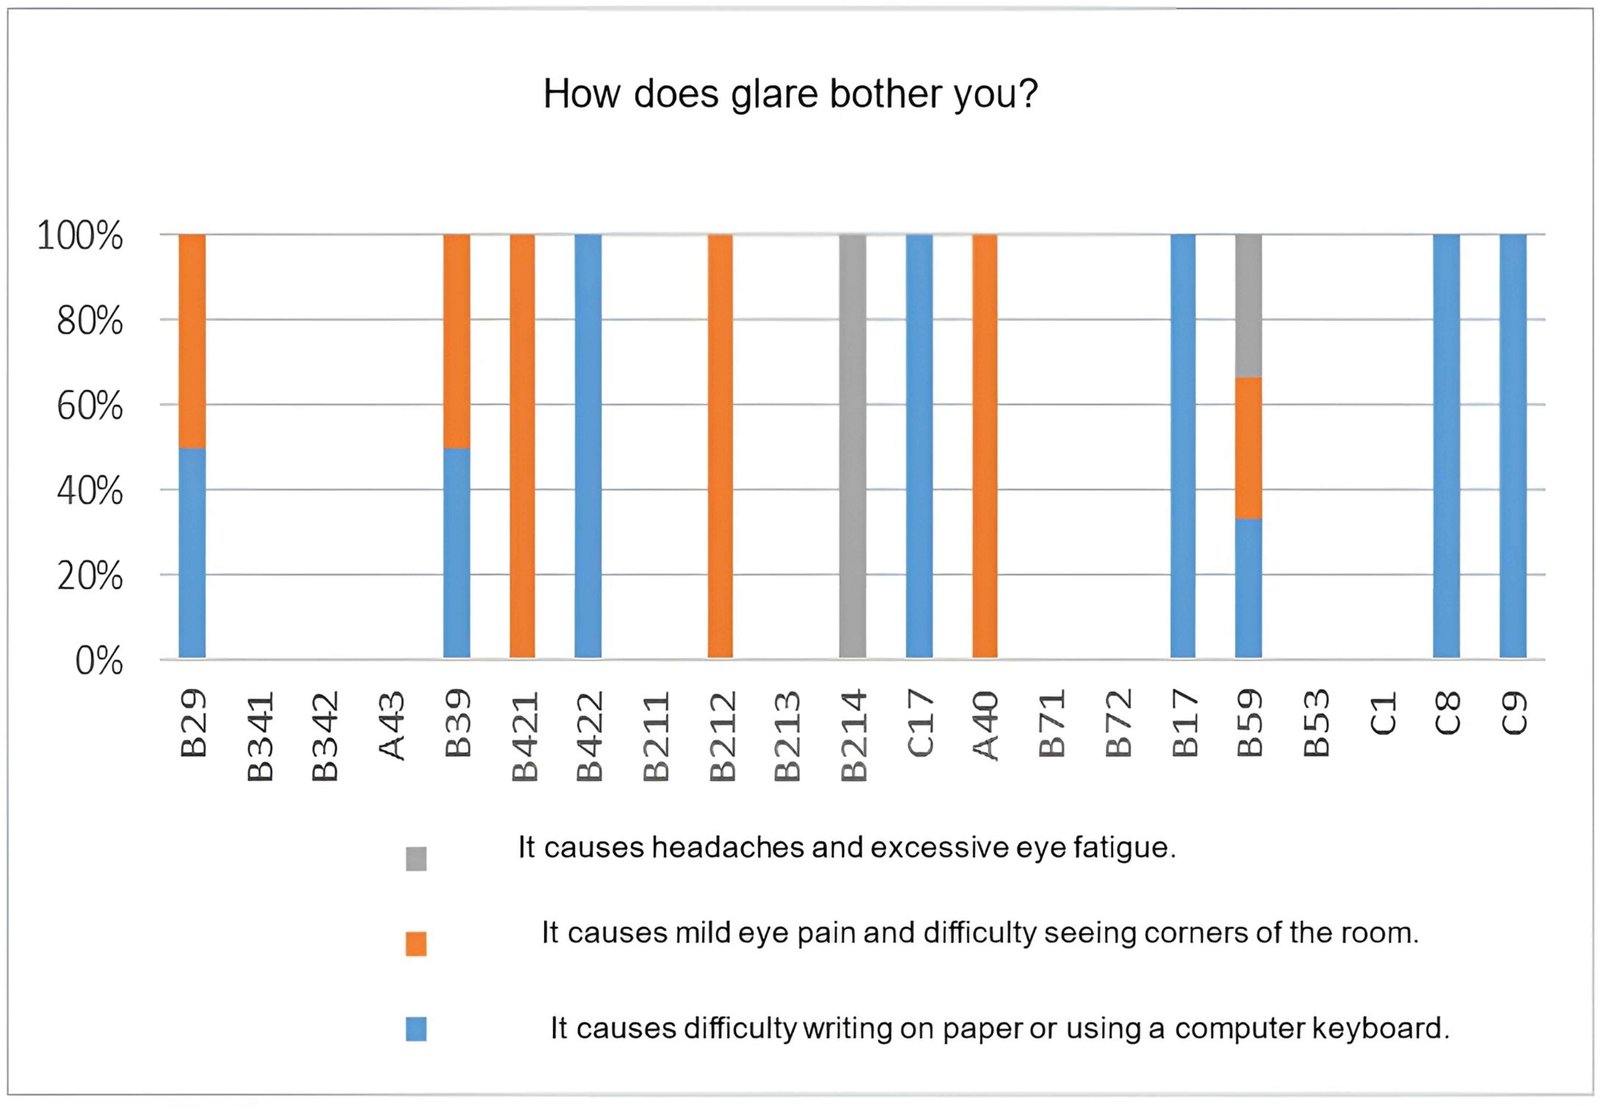 Figure 12
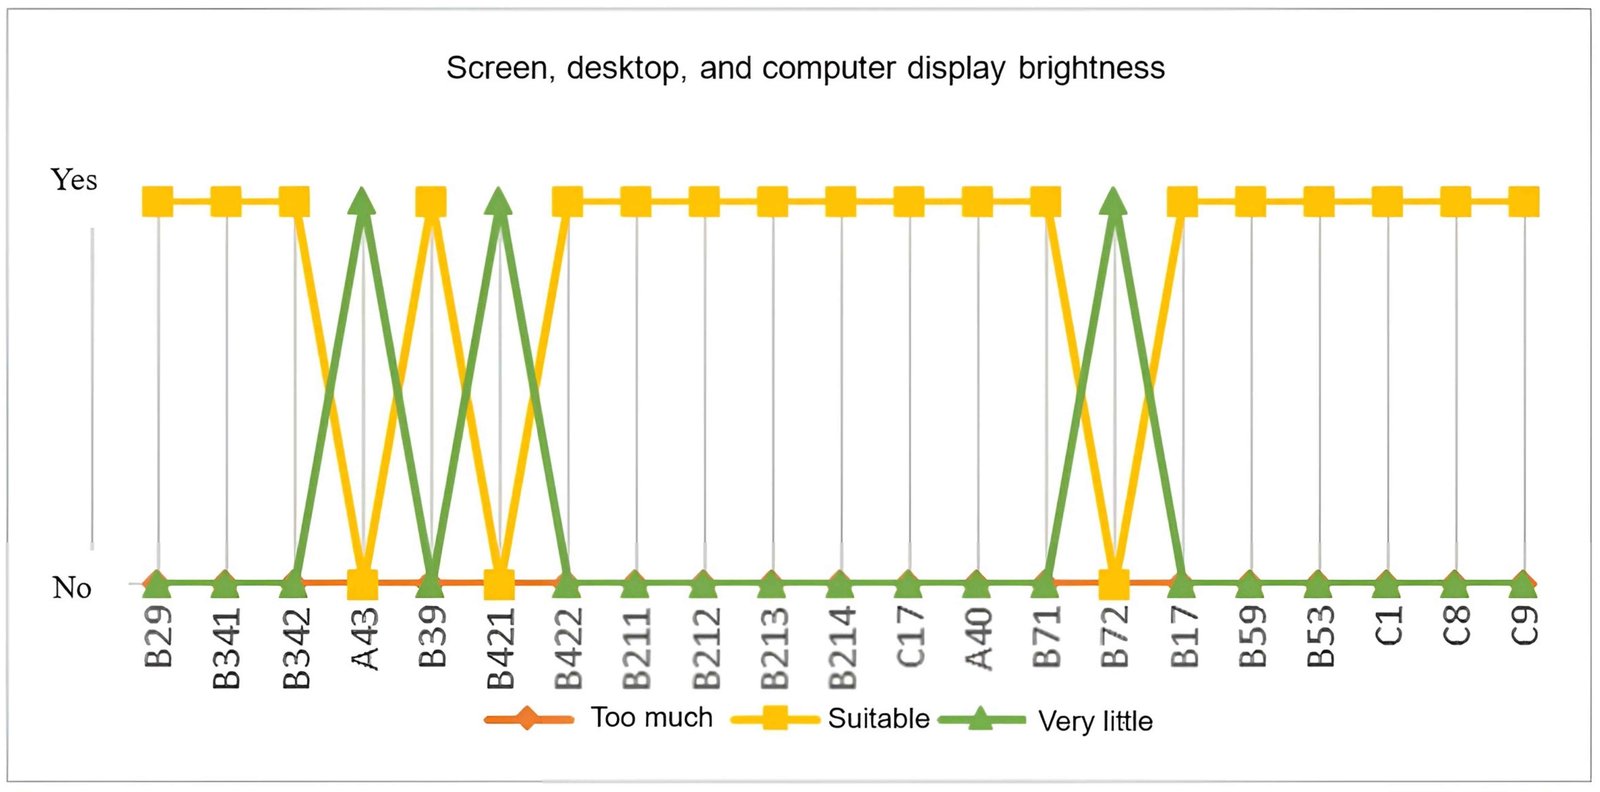 Figure 13
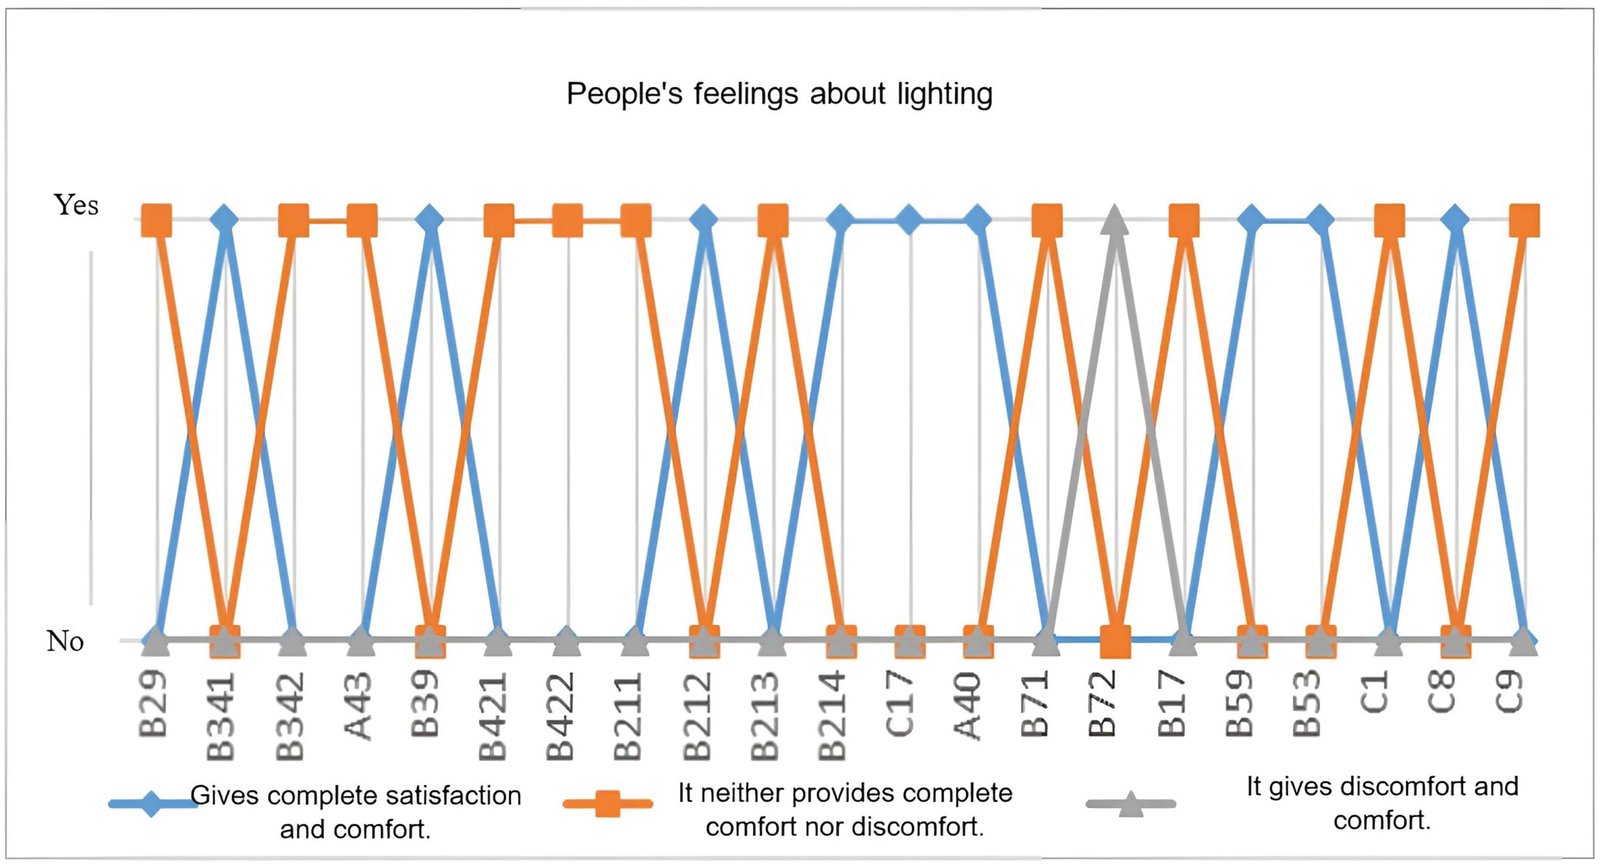 Figure 14
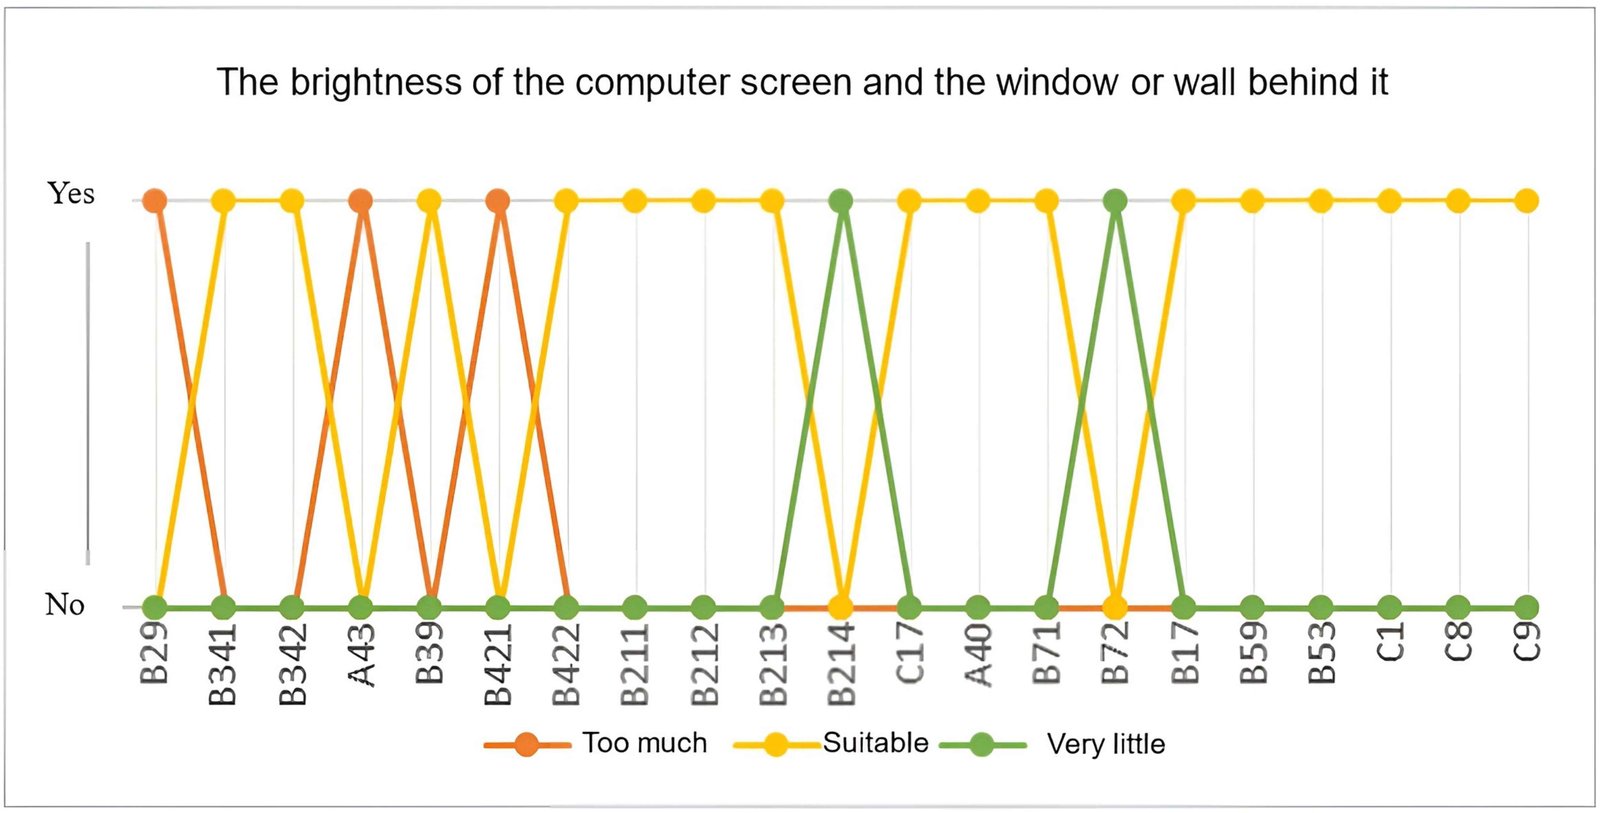 Figure 15
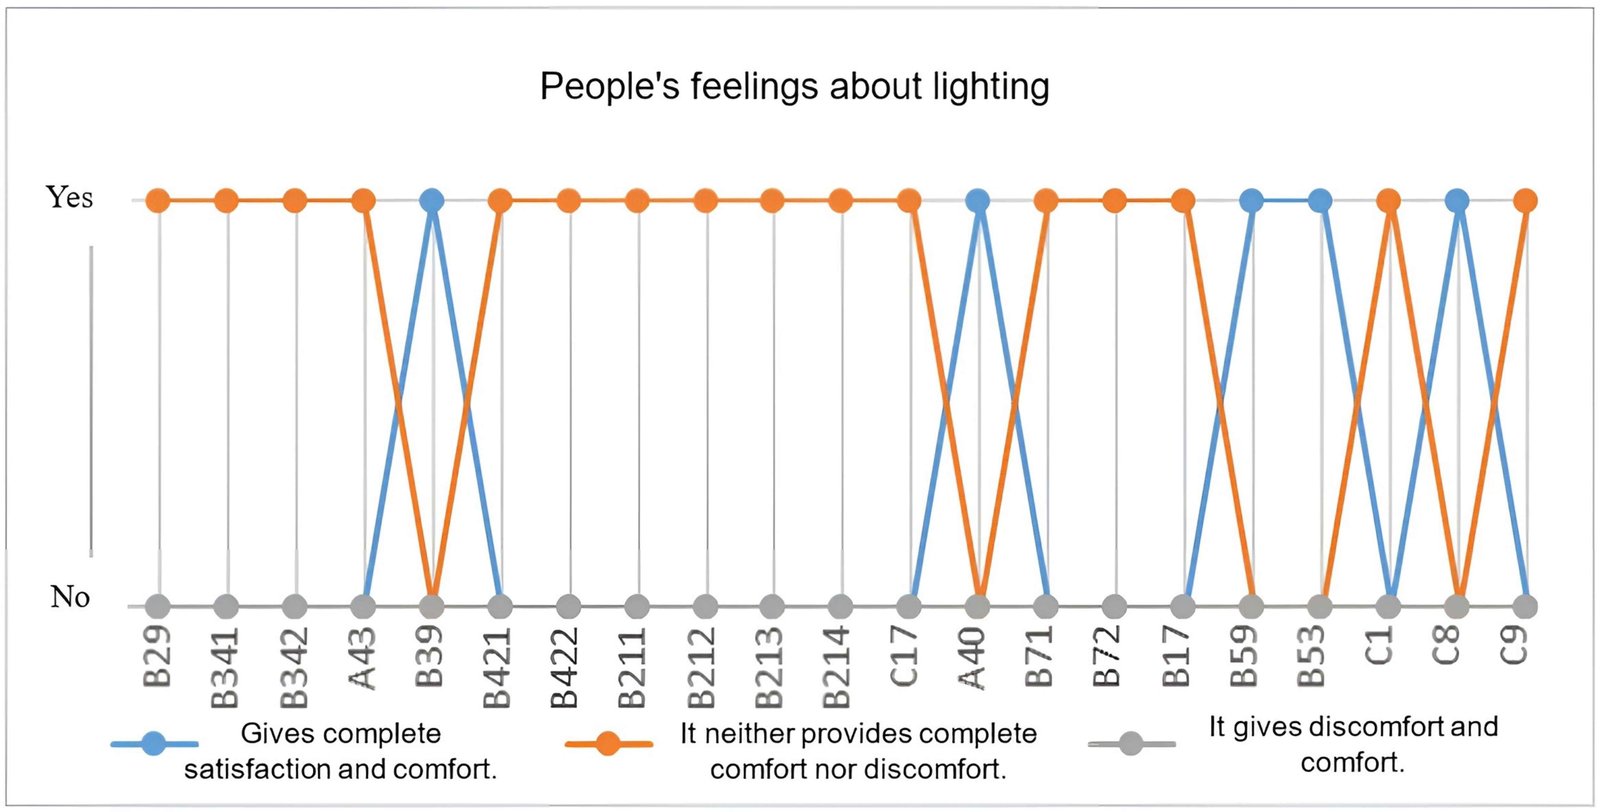 Figure 16
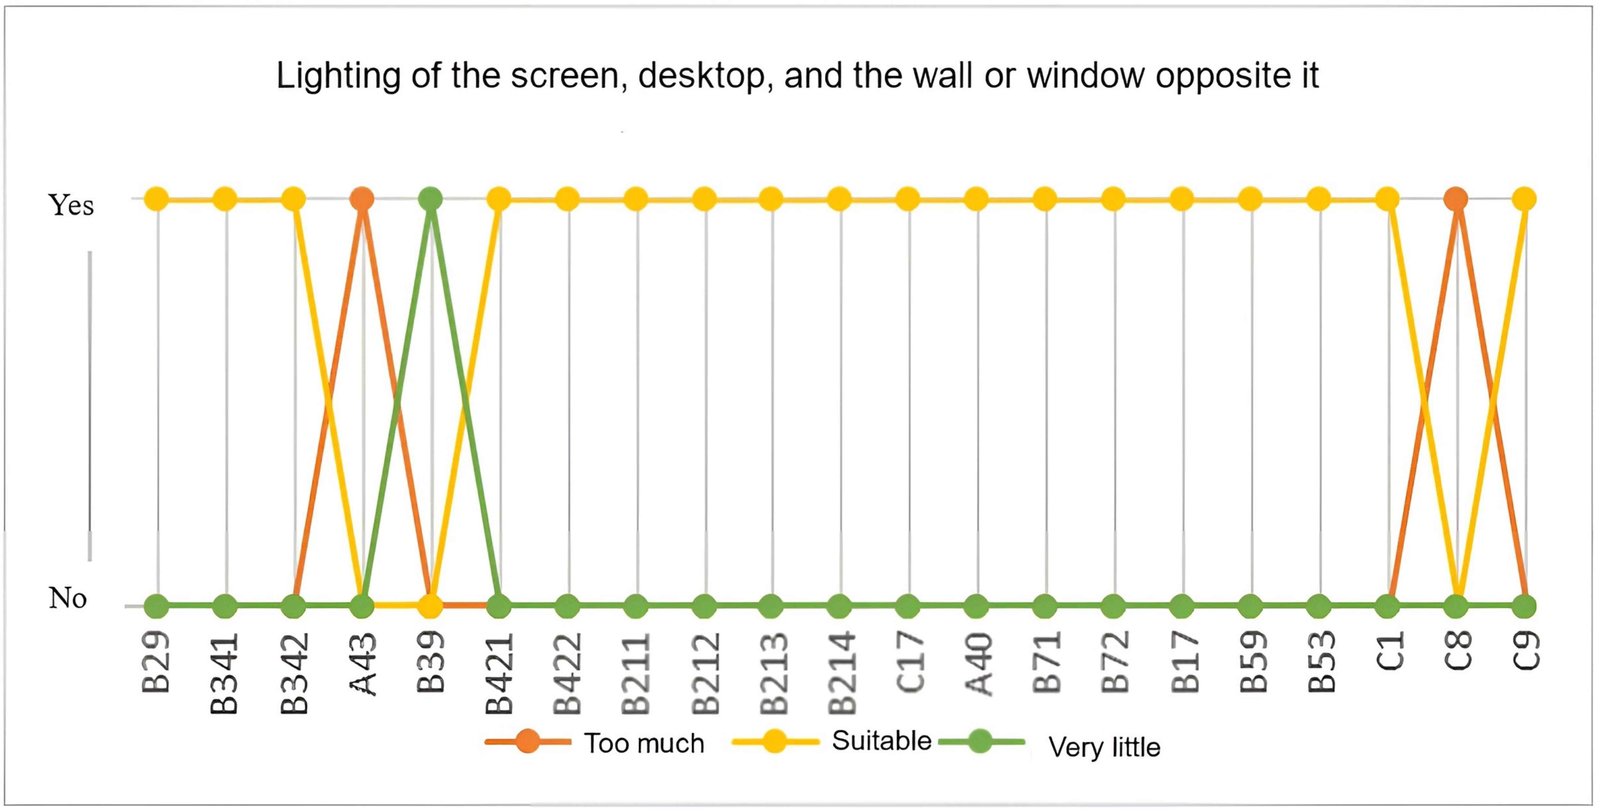 Figure 17
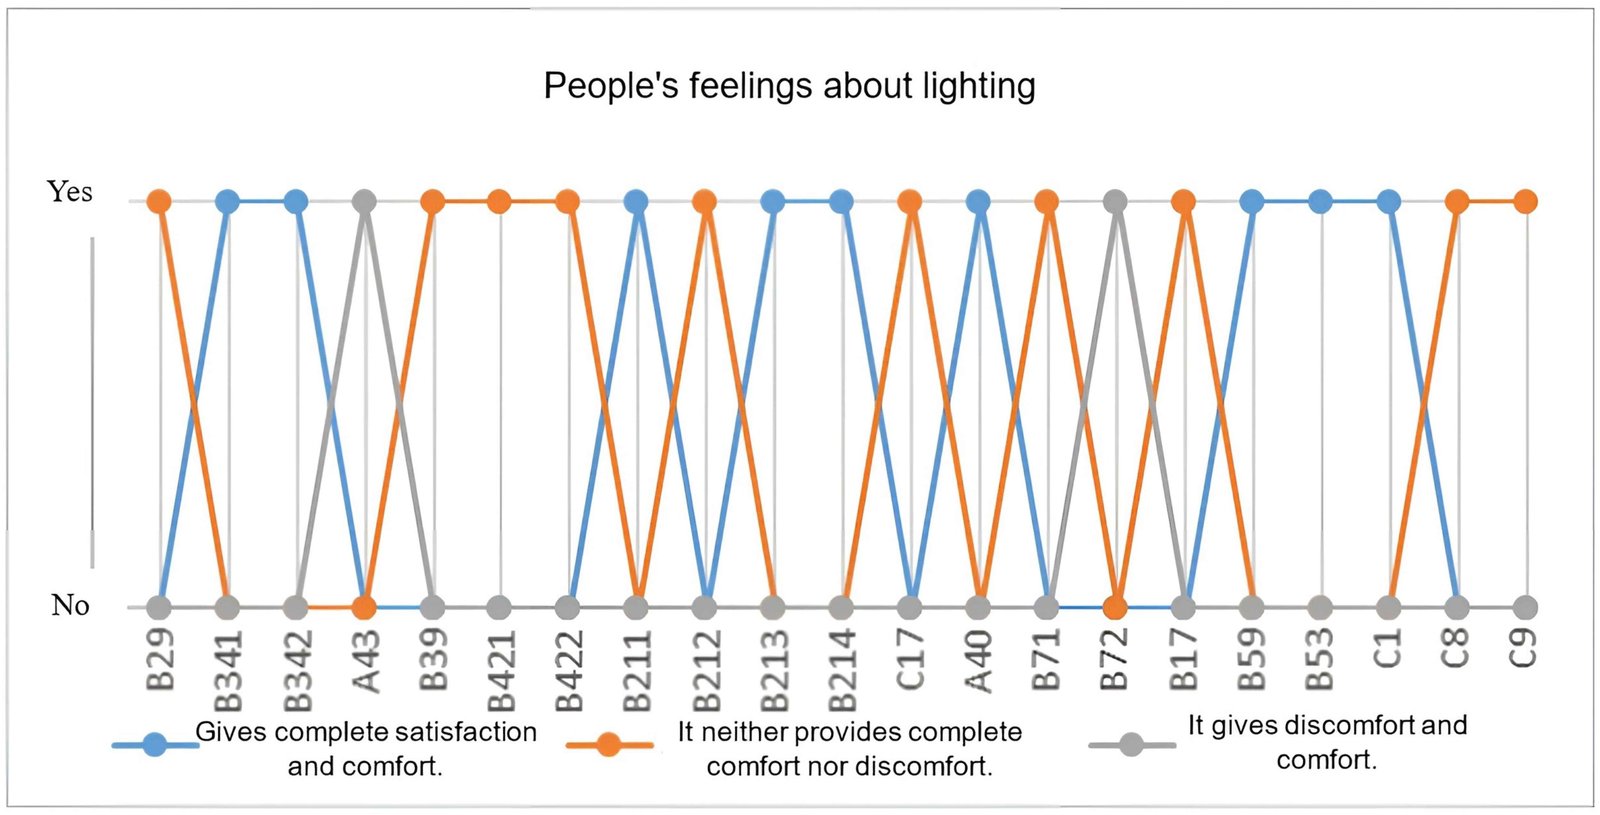 Figure 18
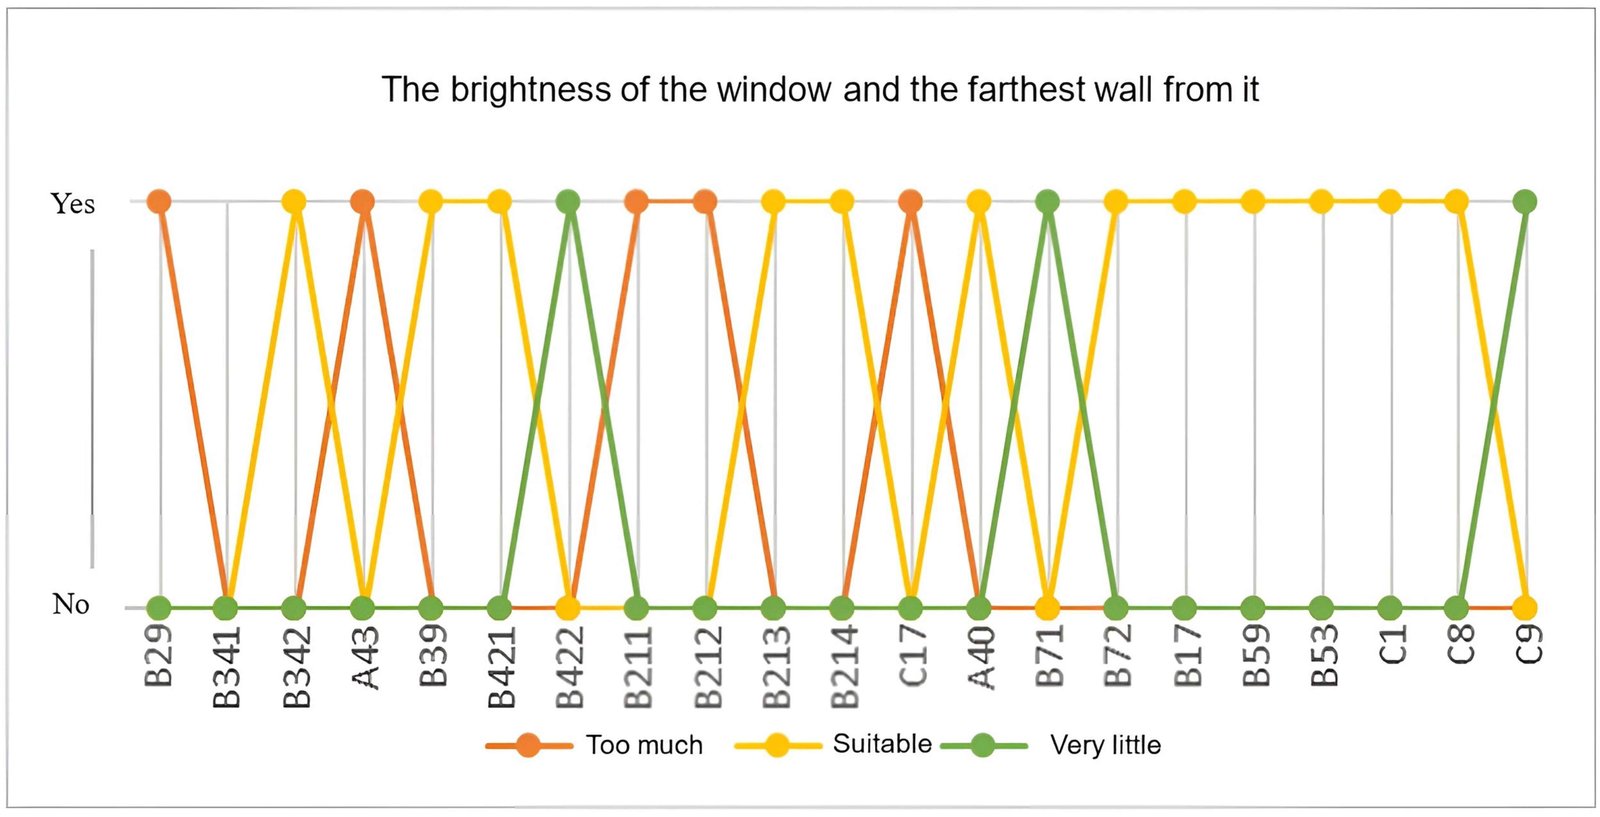 Figure 19
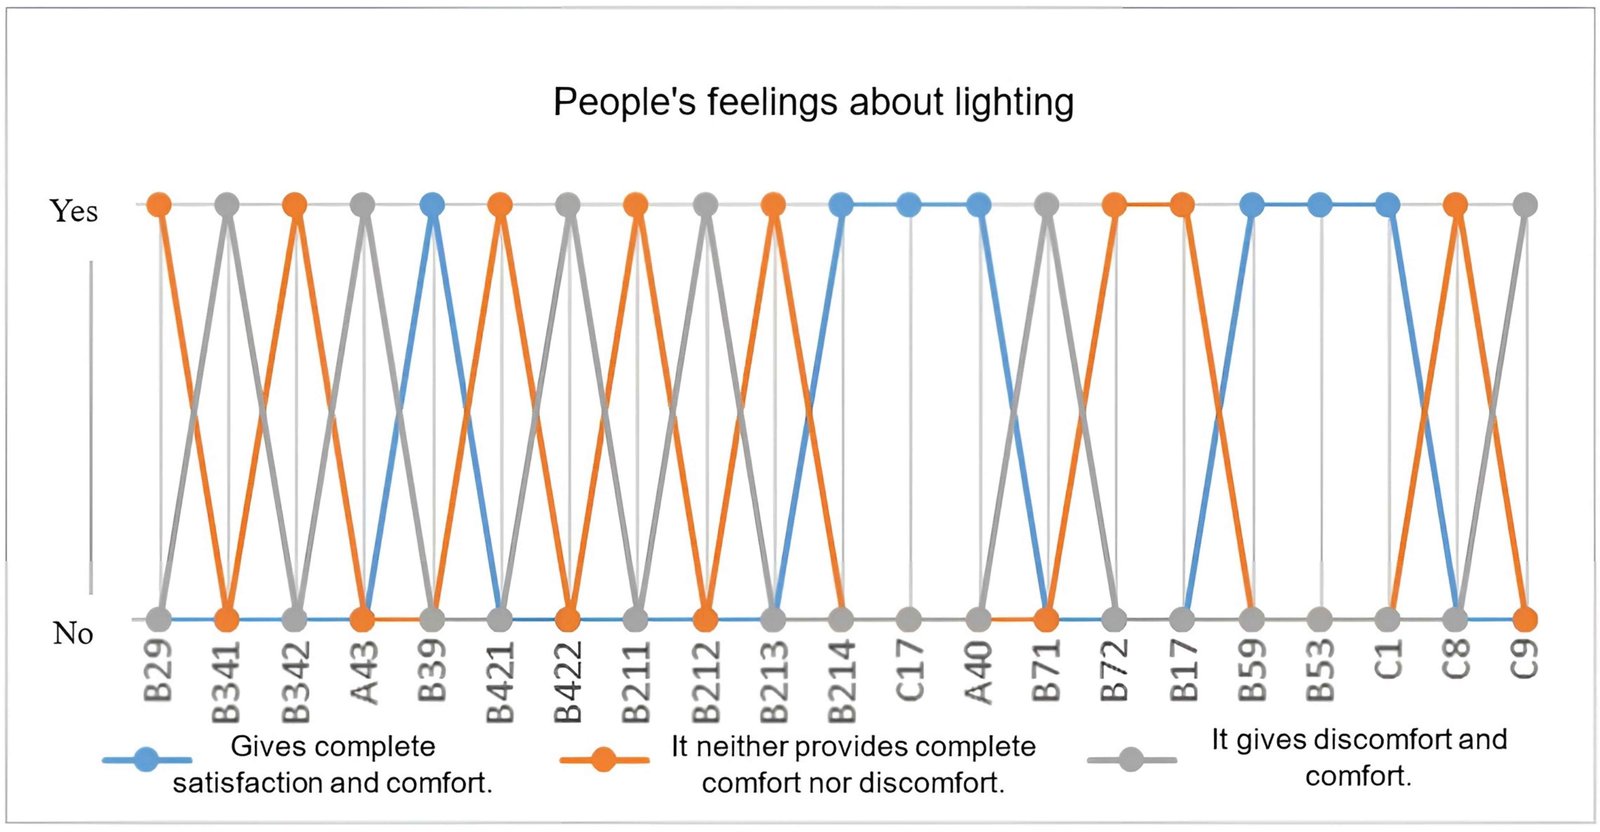 Figure 20
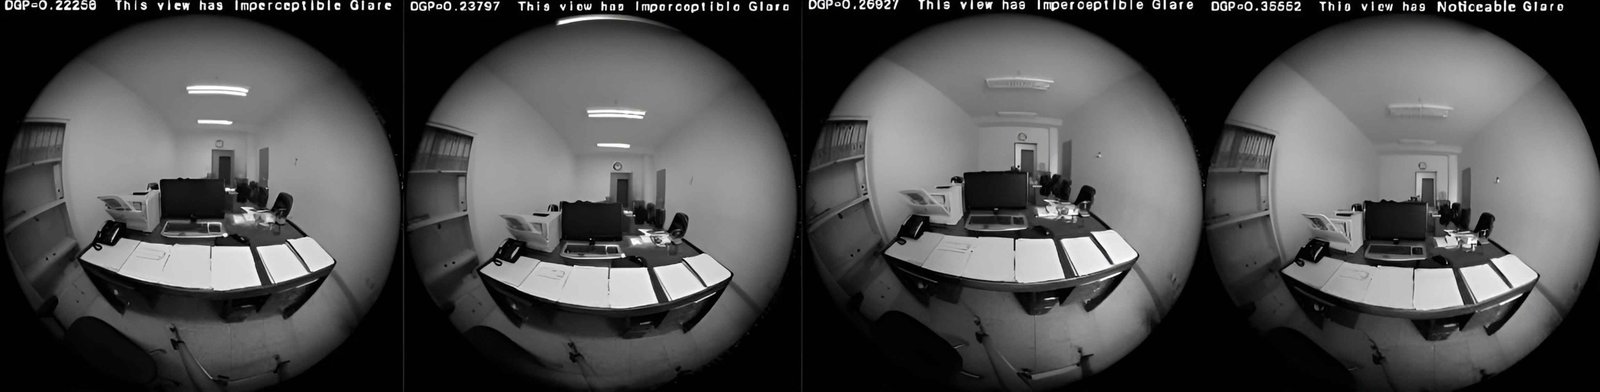 Figure 21
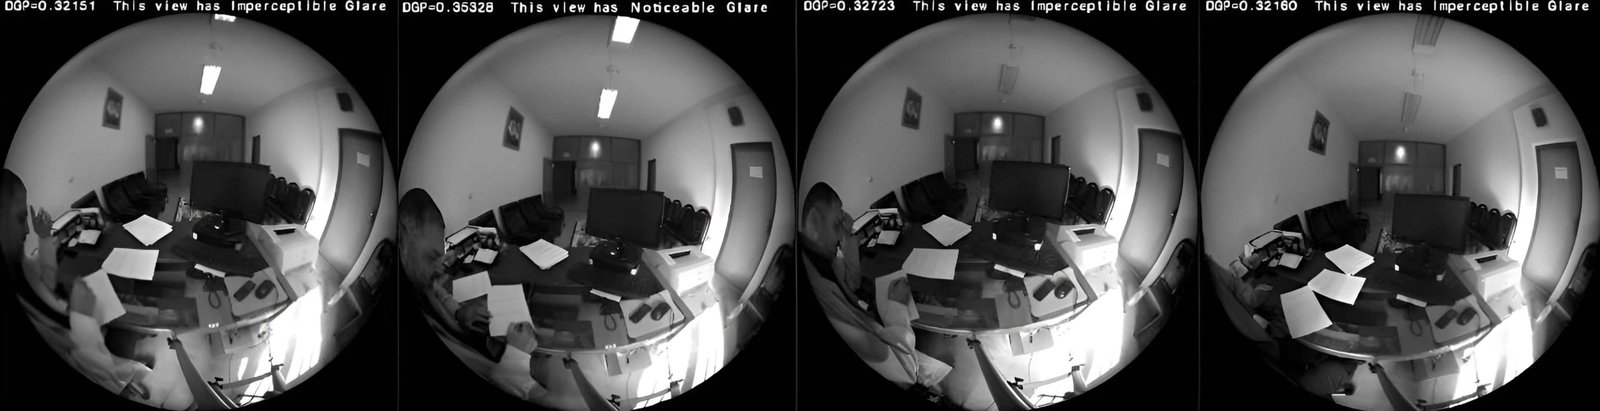 Figure 22
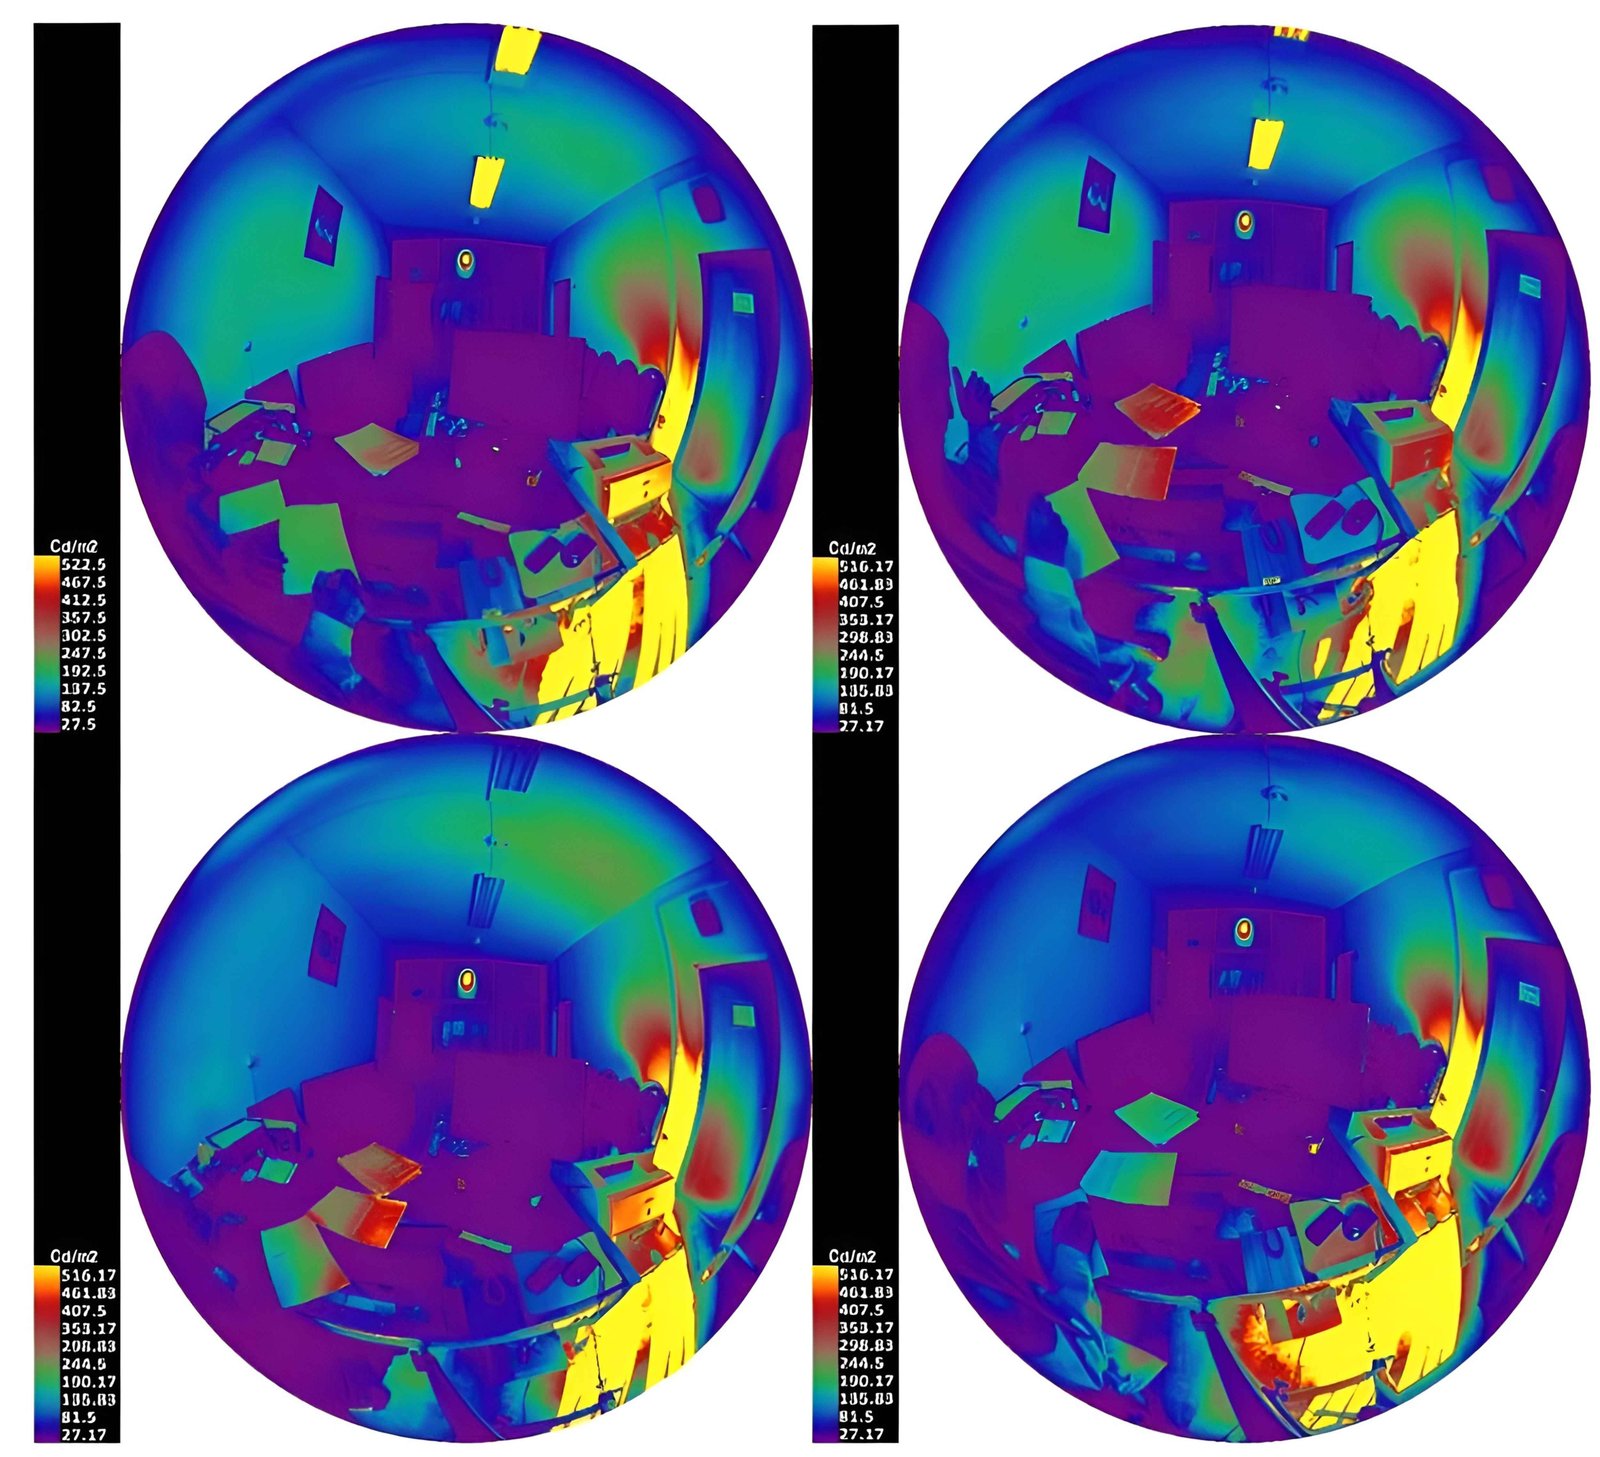 Figure 23
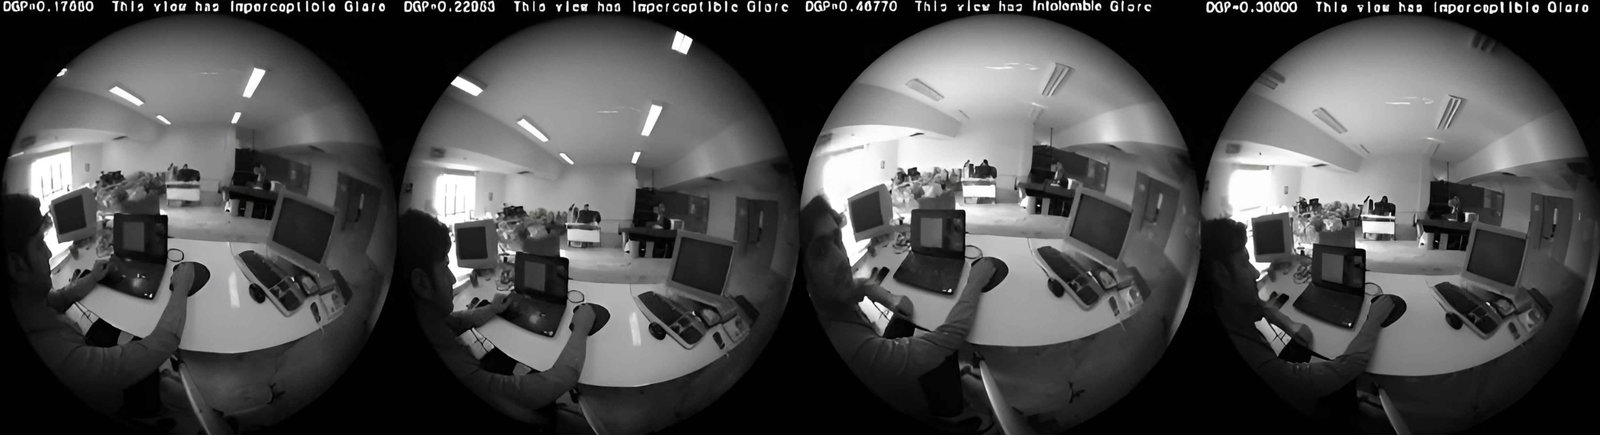 Figure 24
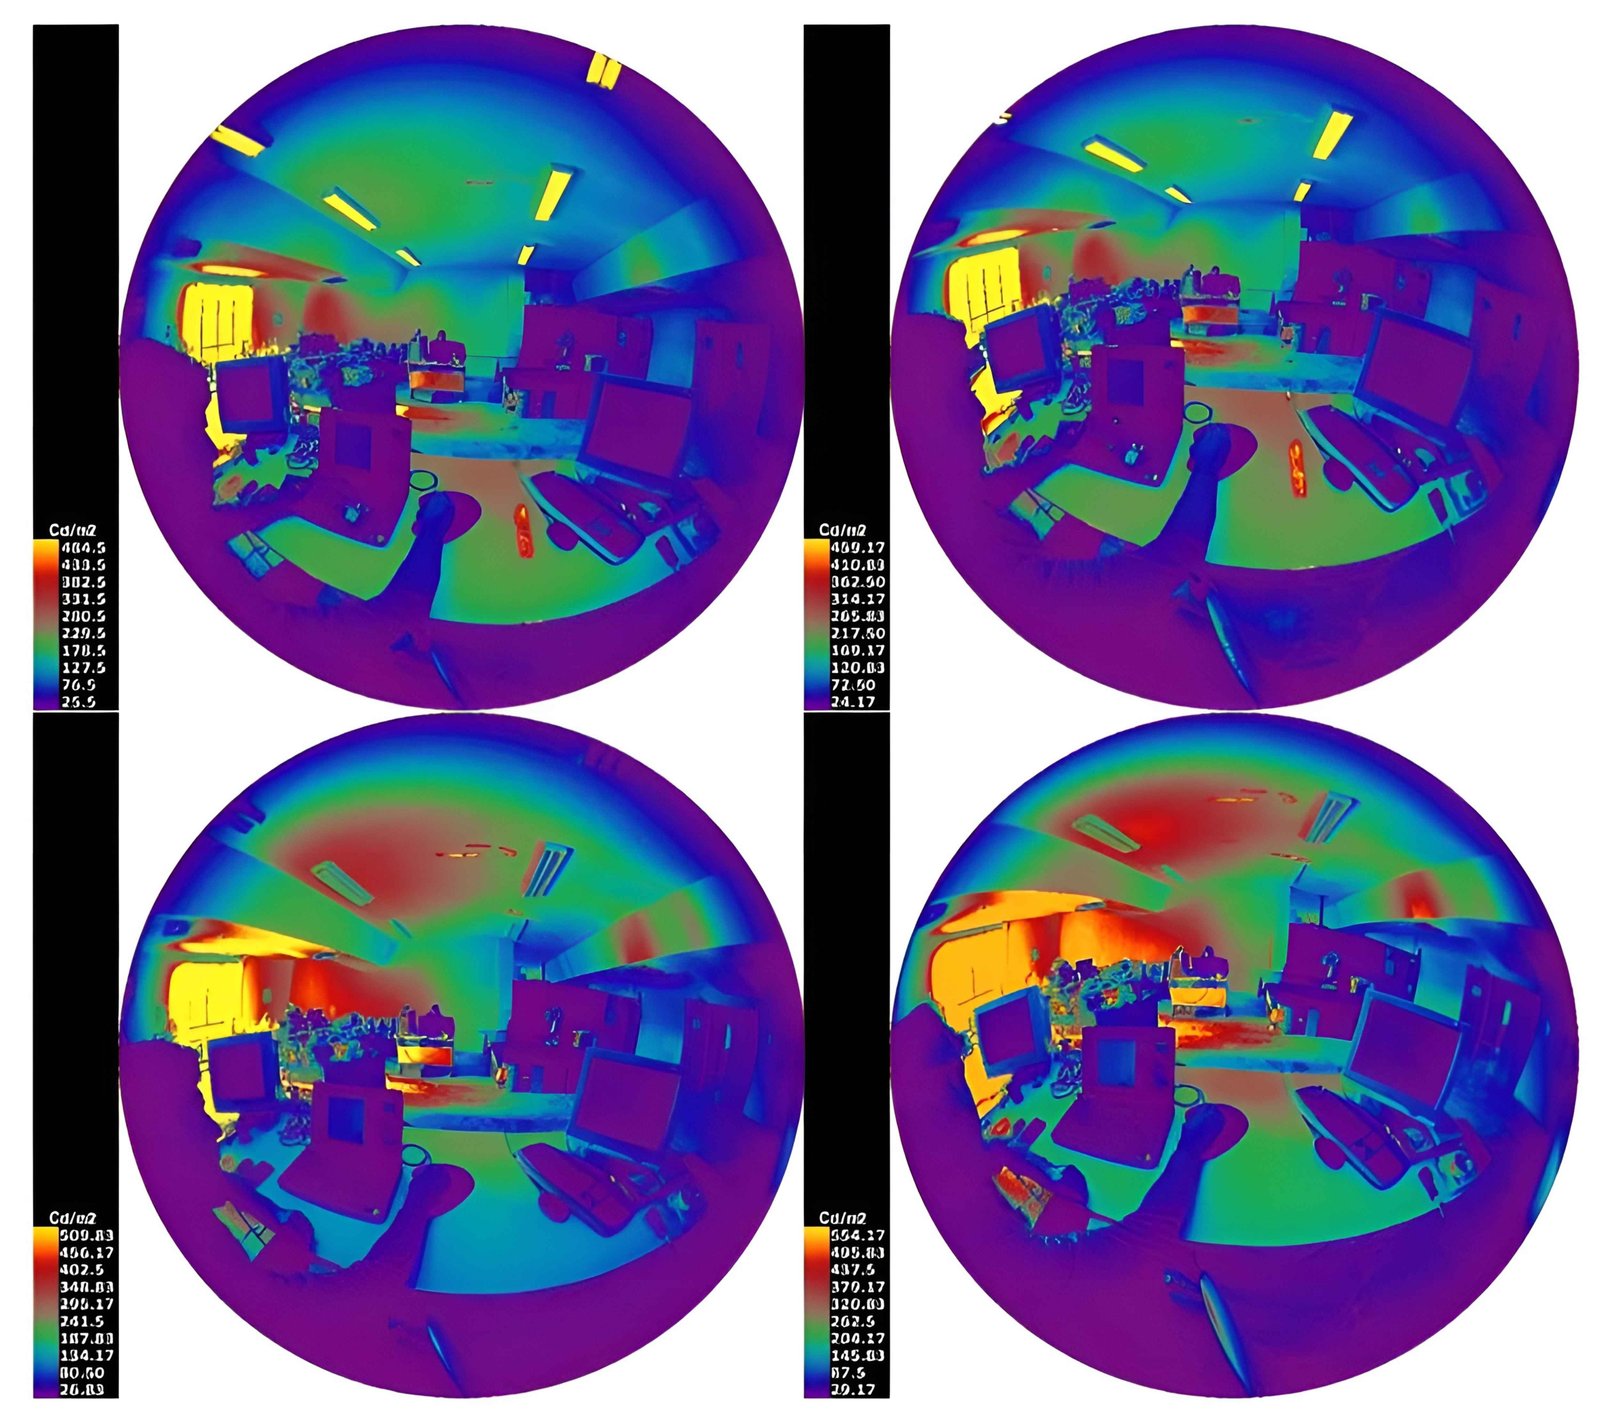 Figure 25
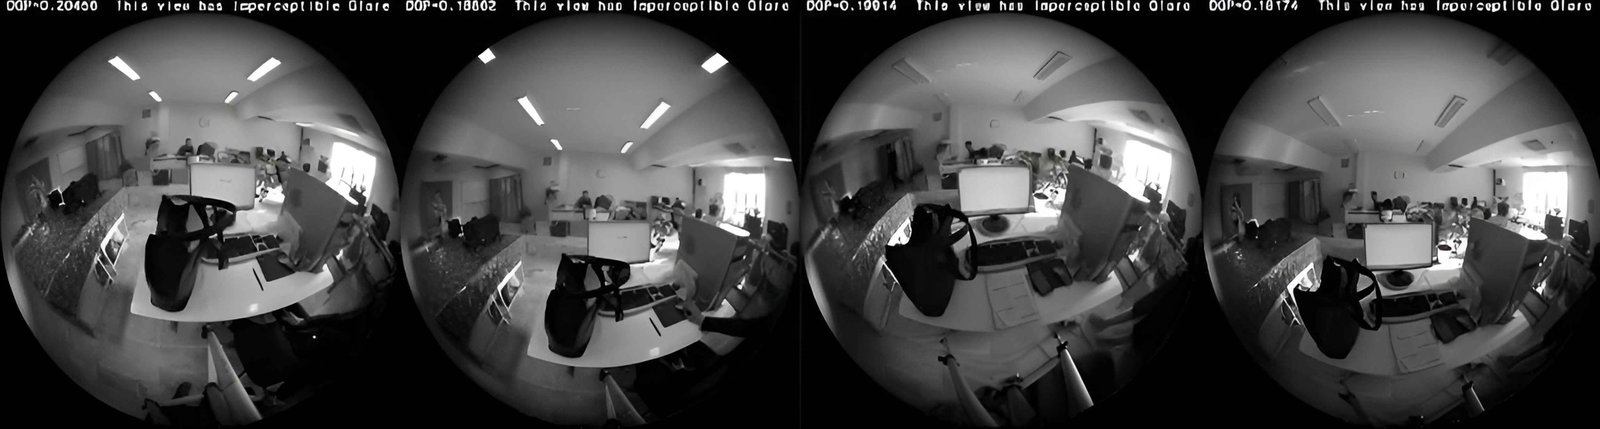 Figure 26
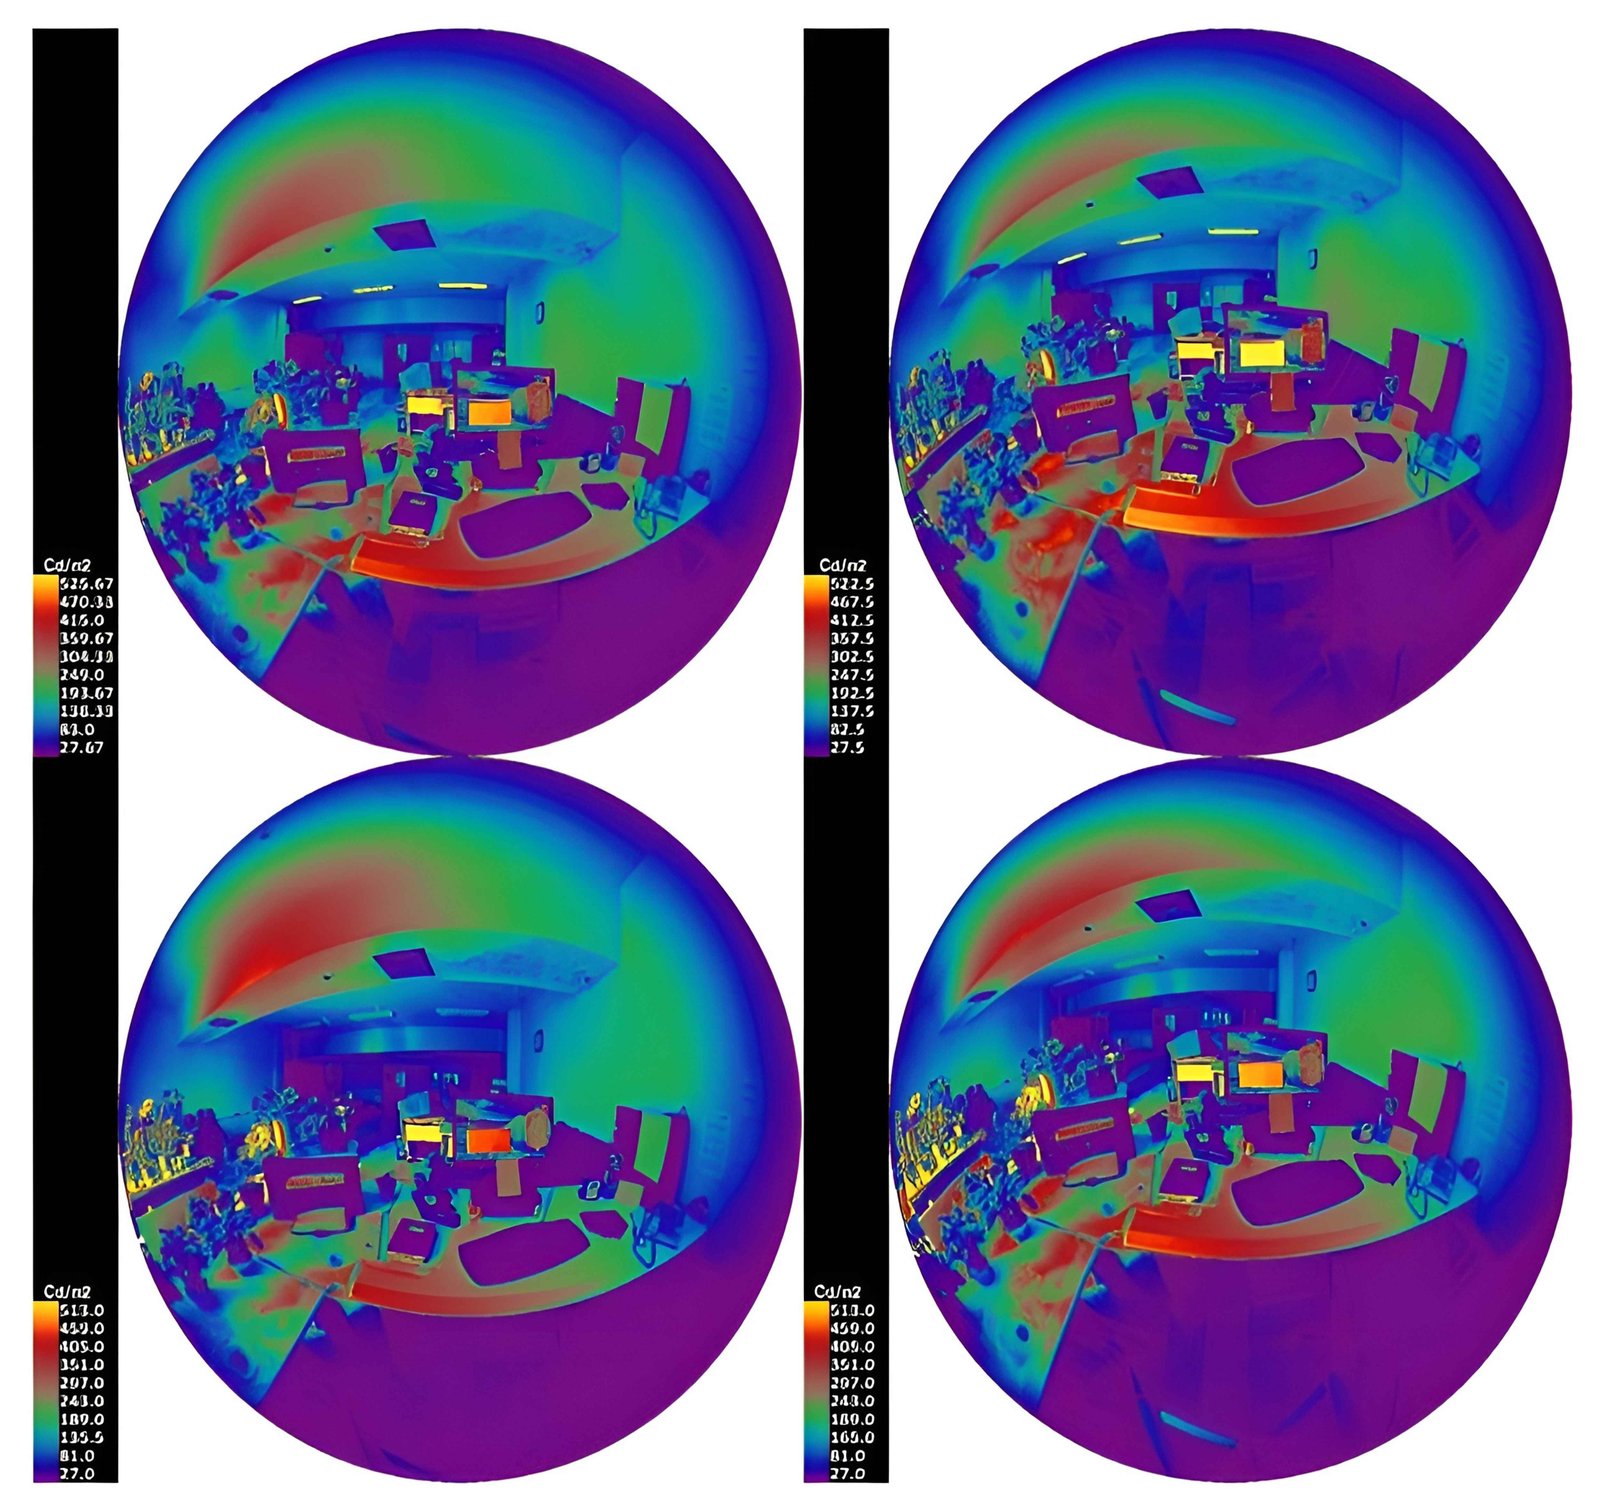 Figure 27
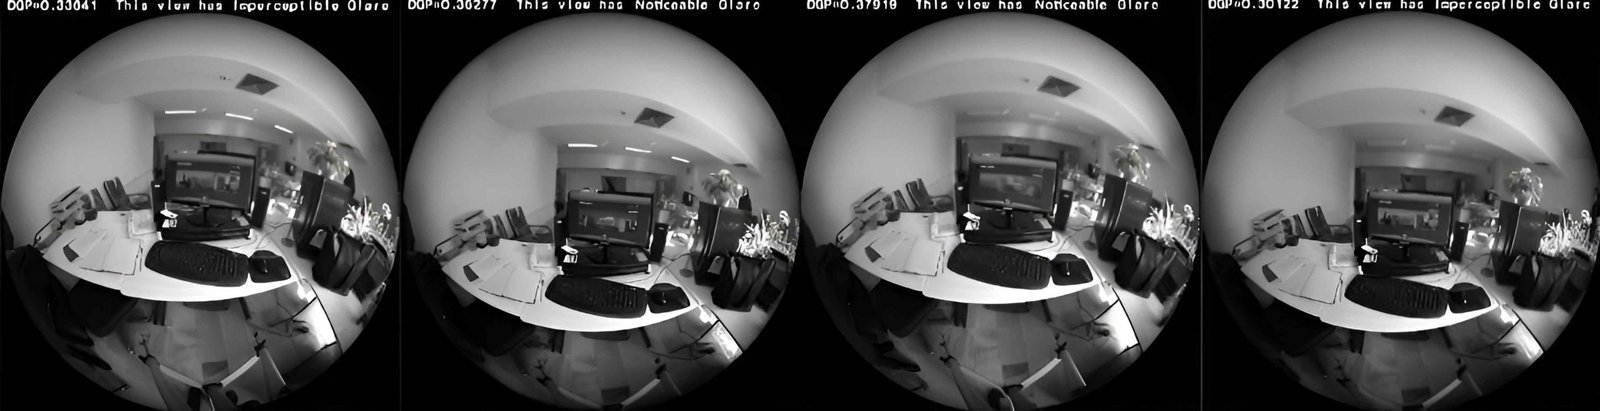 Figure 28
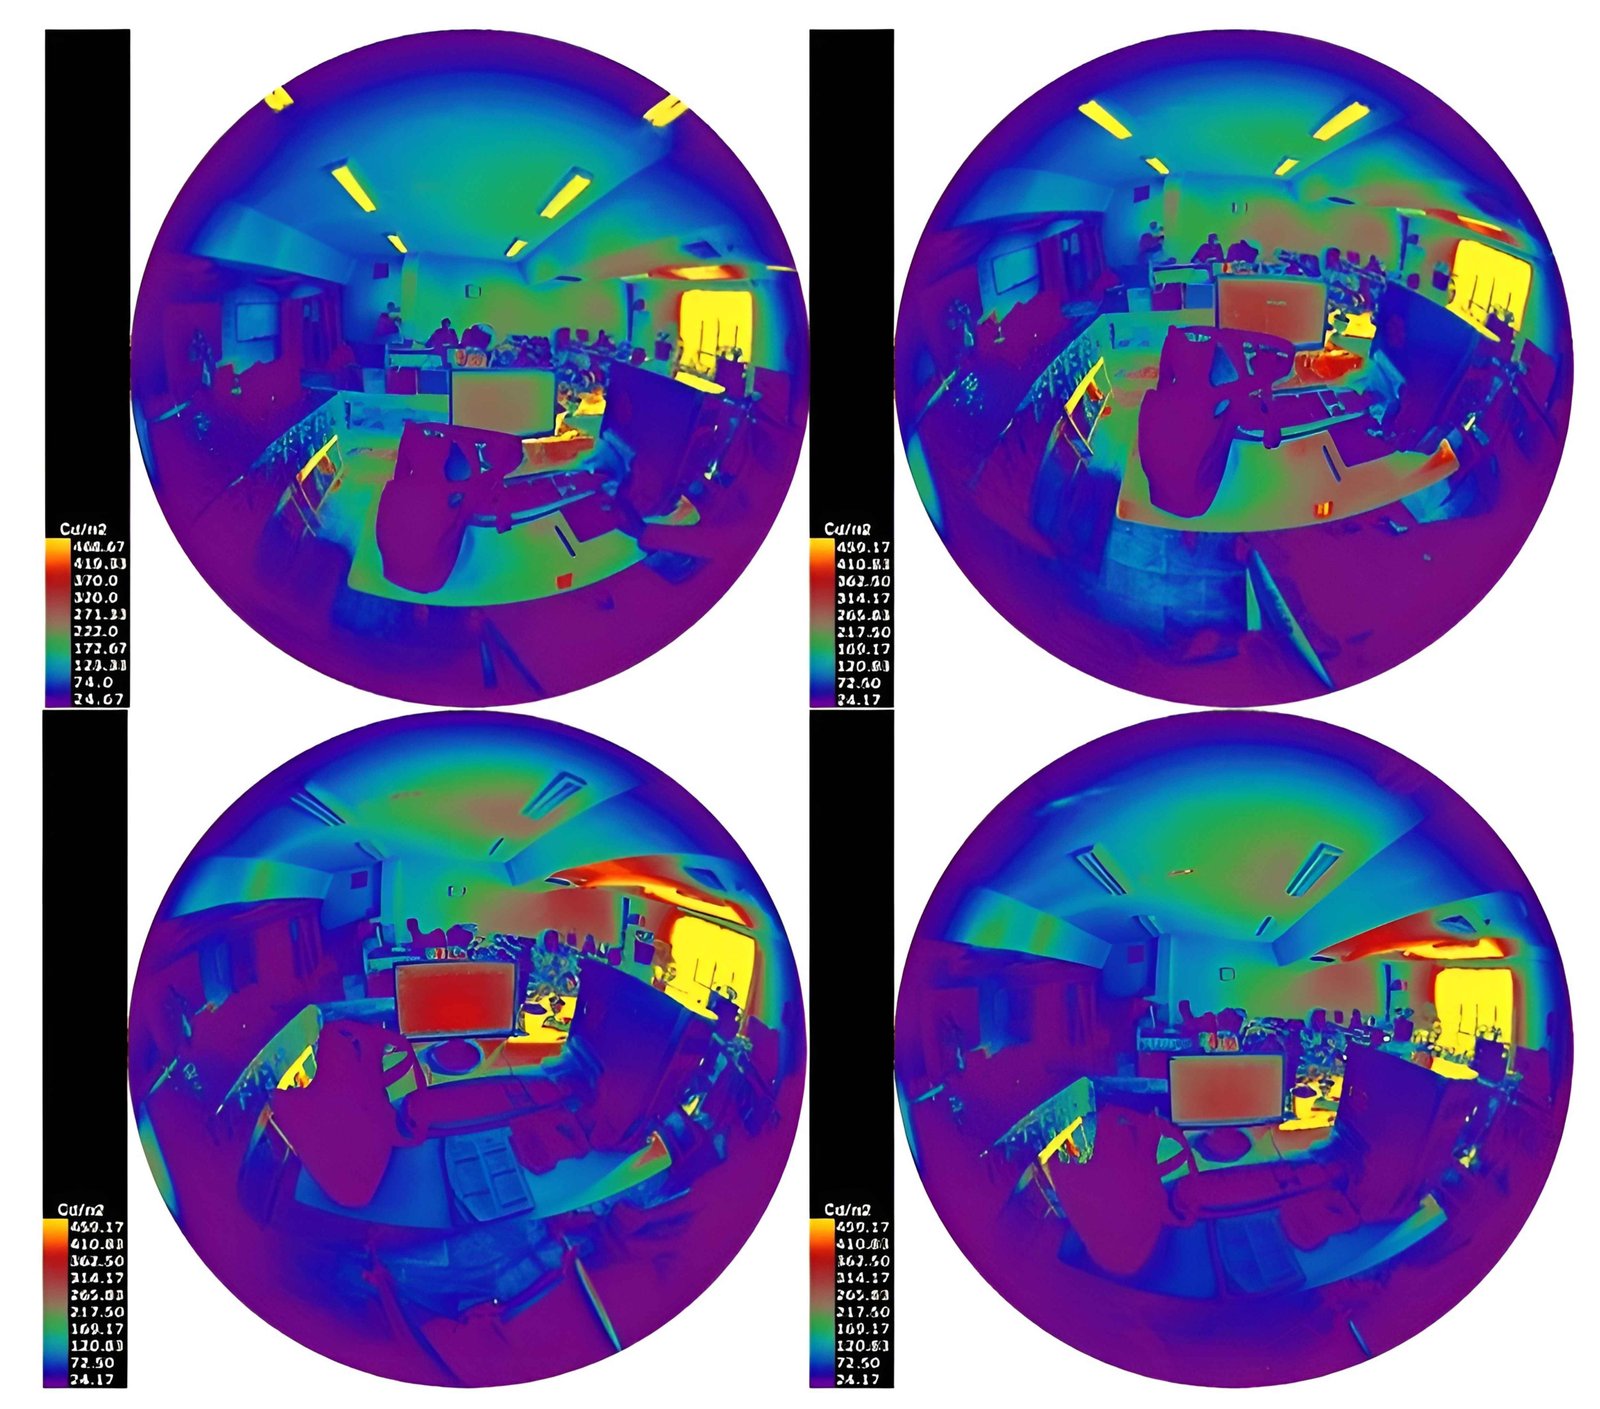 Figure 29
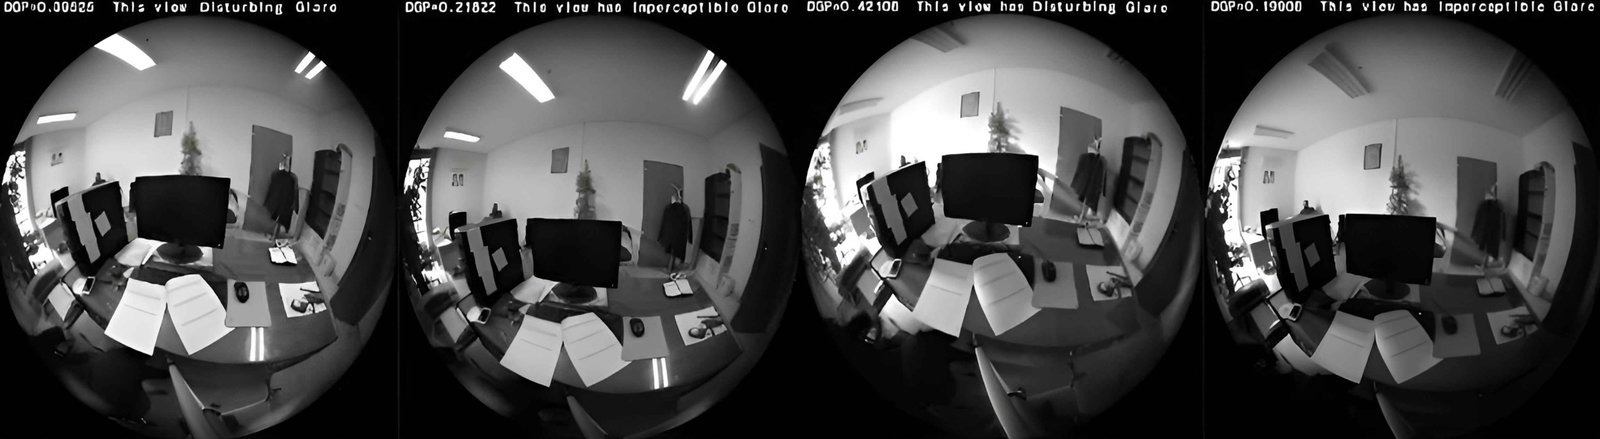 Figure 30
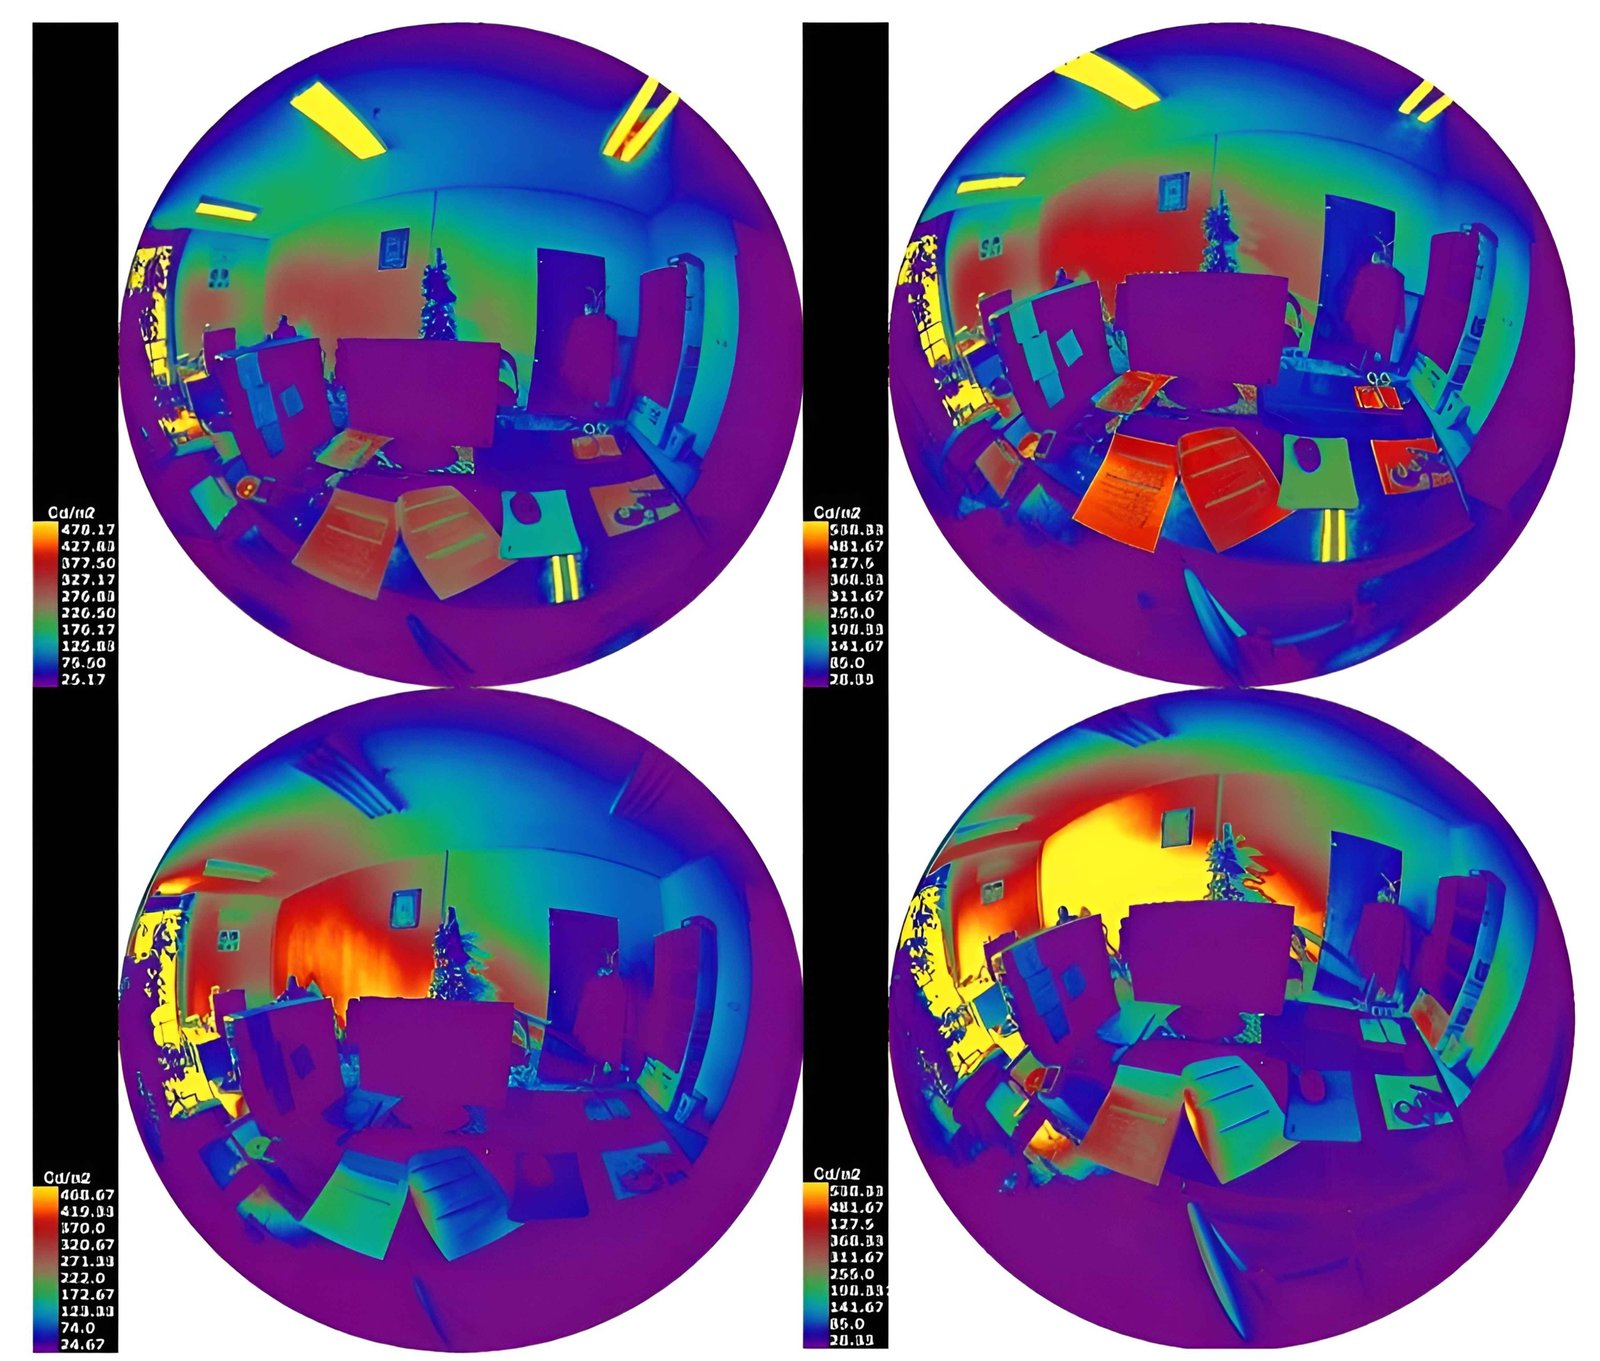 Figure 31
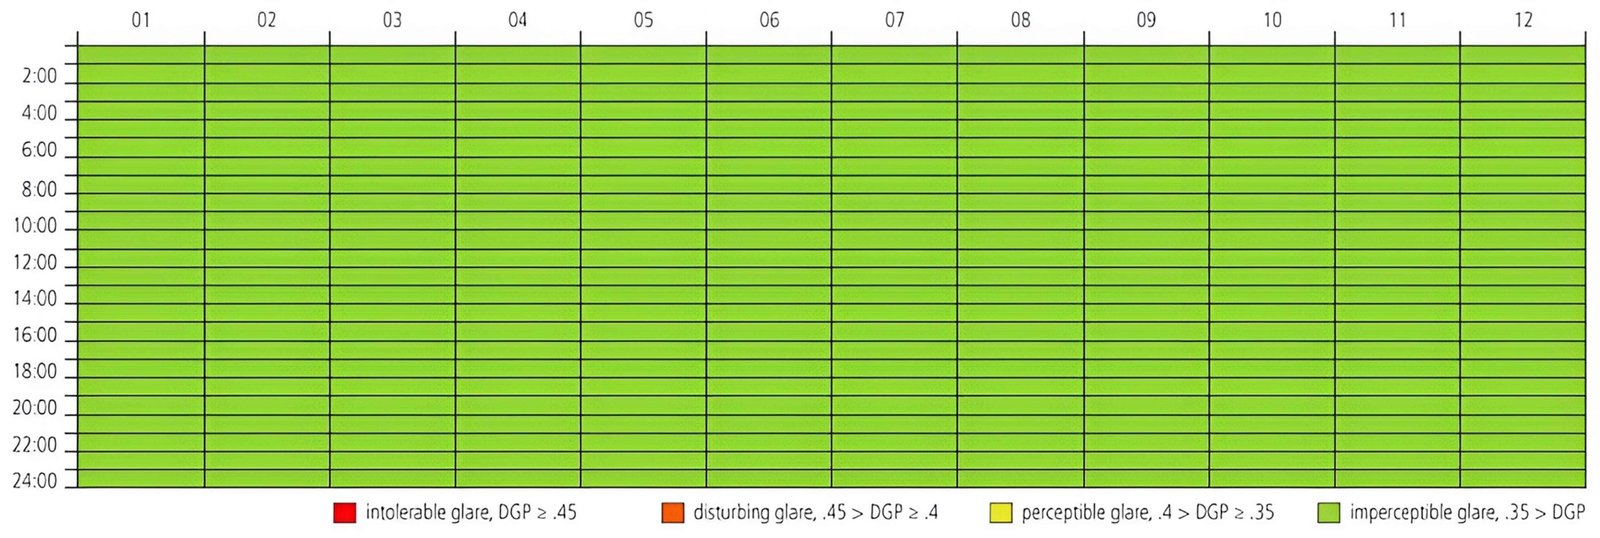 Figure 32
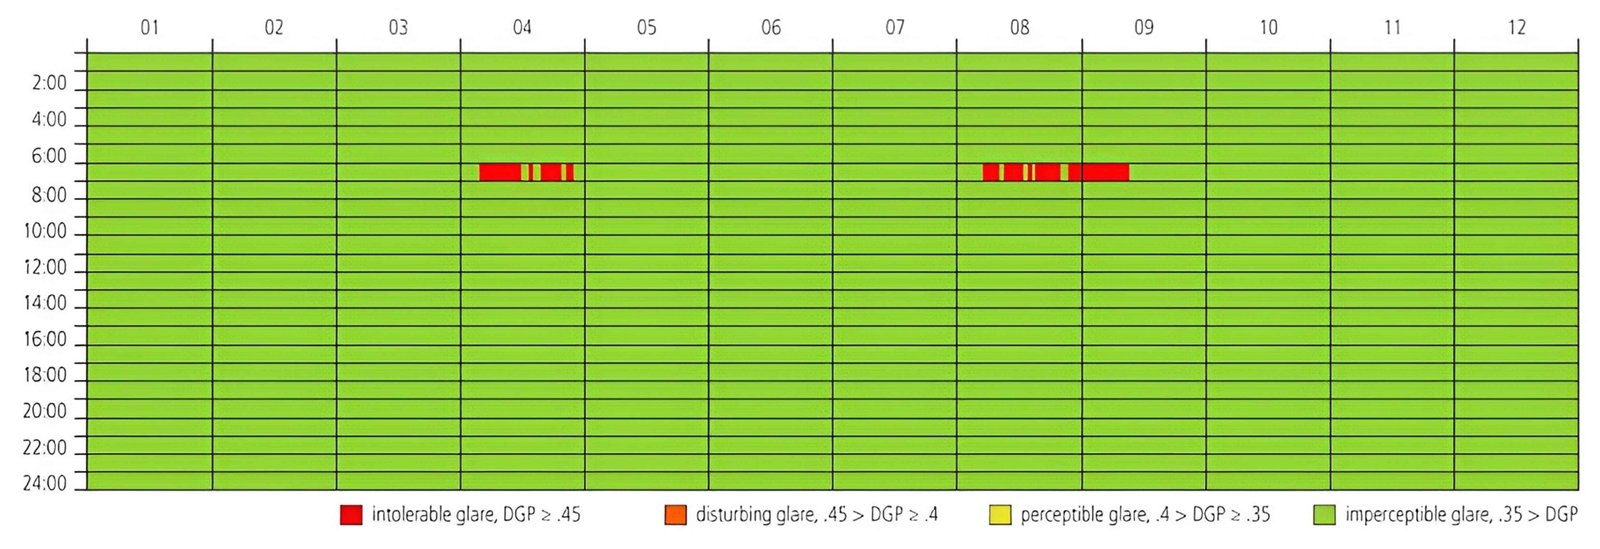 Figure 33
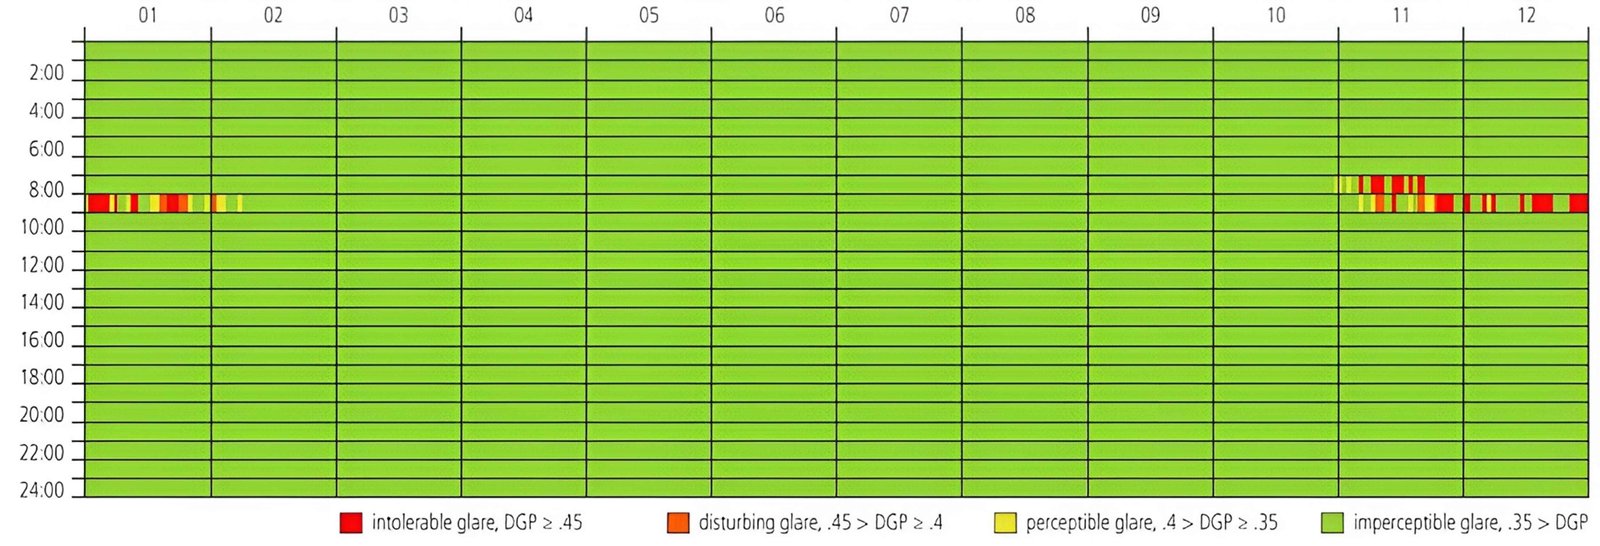 Figure 34
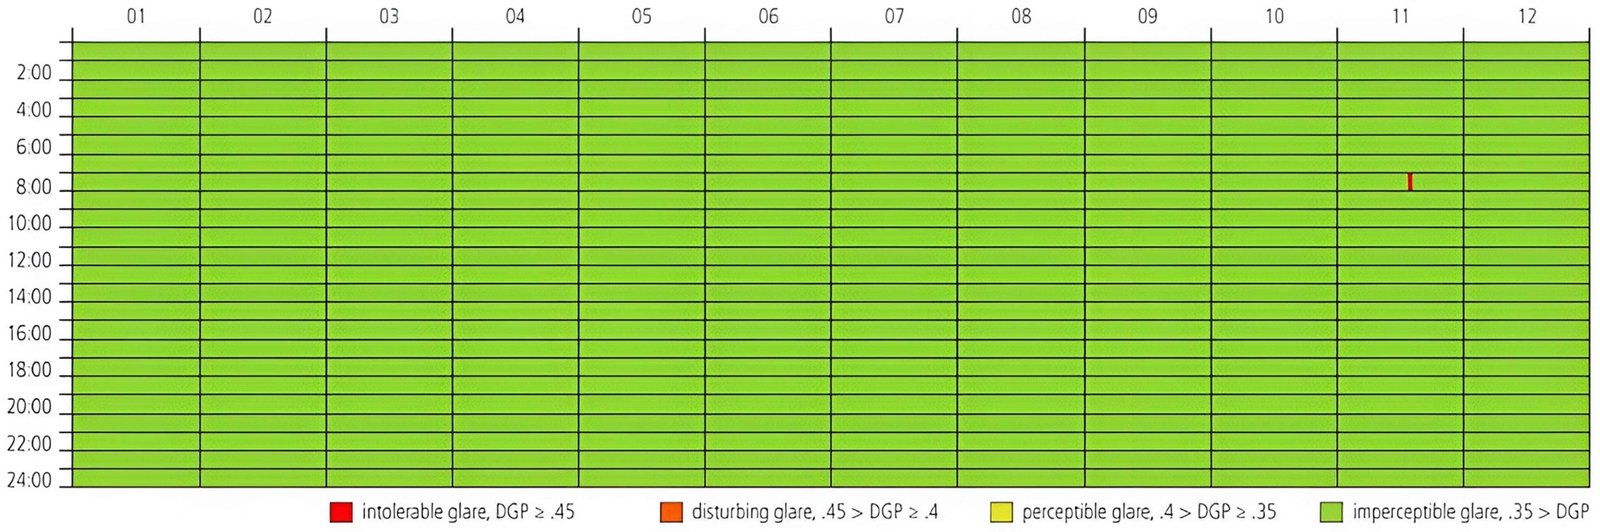 Figure 35
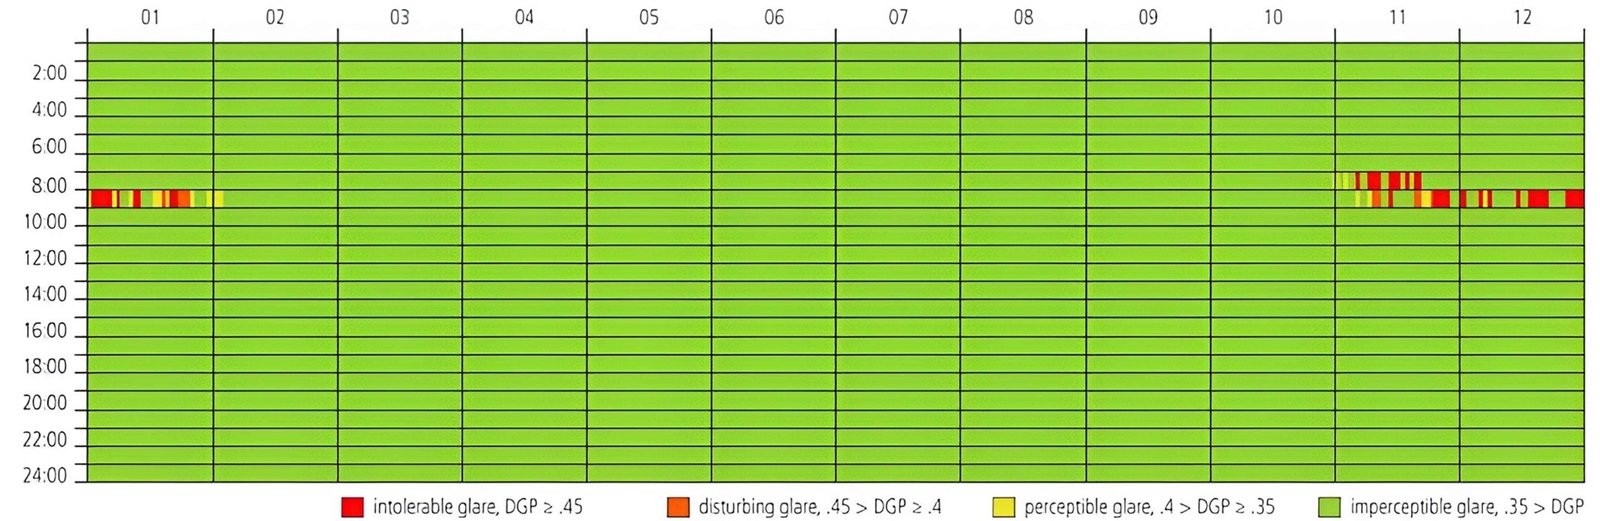 Figure 36
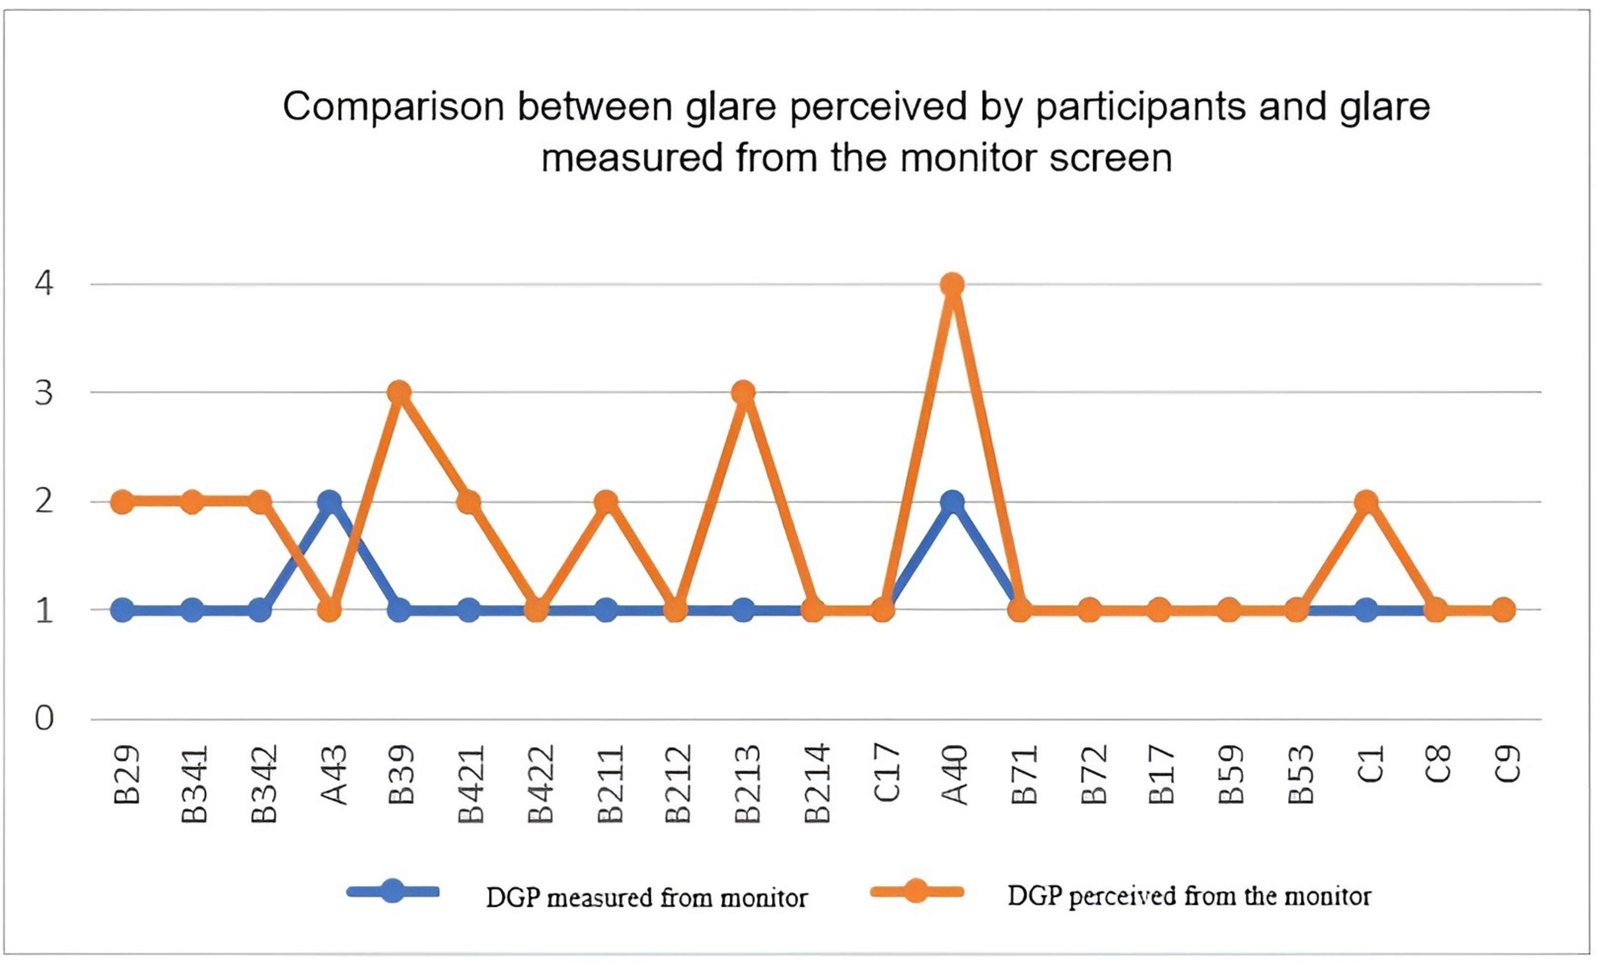 Figure 37
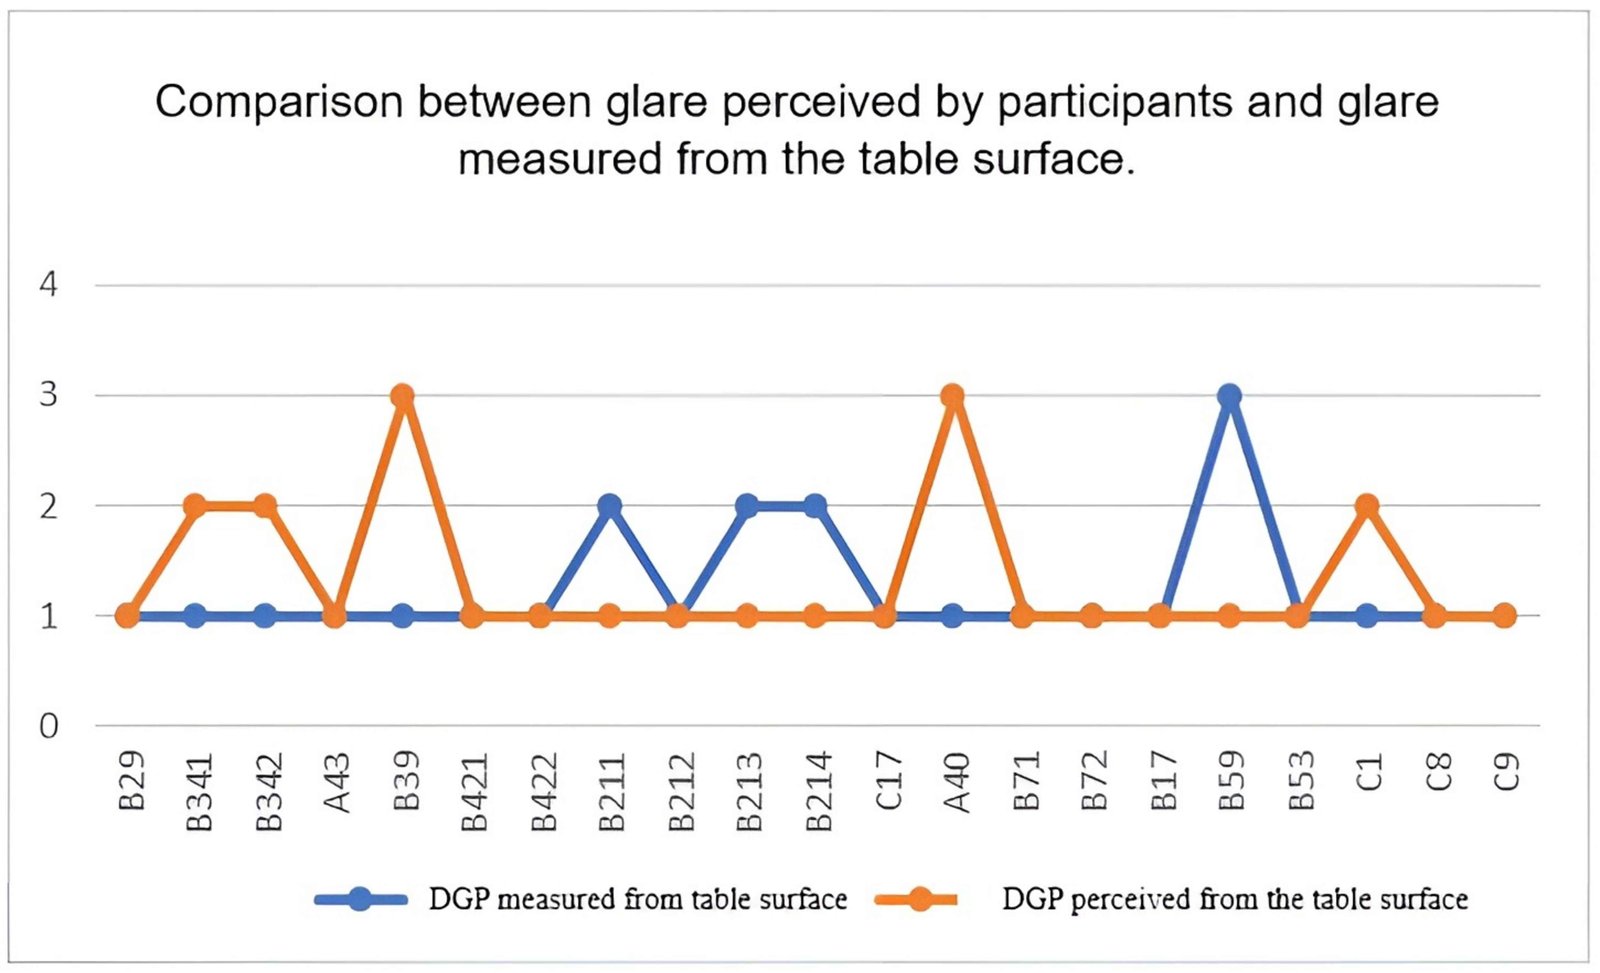 Figure 38
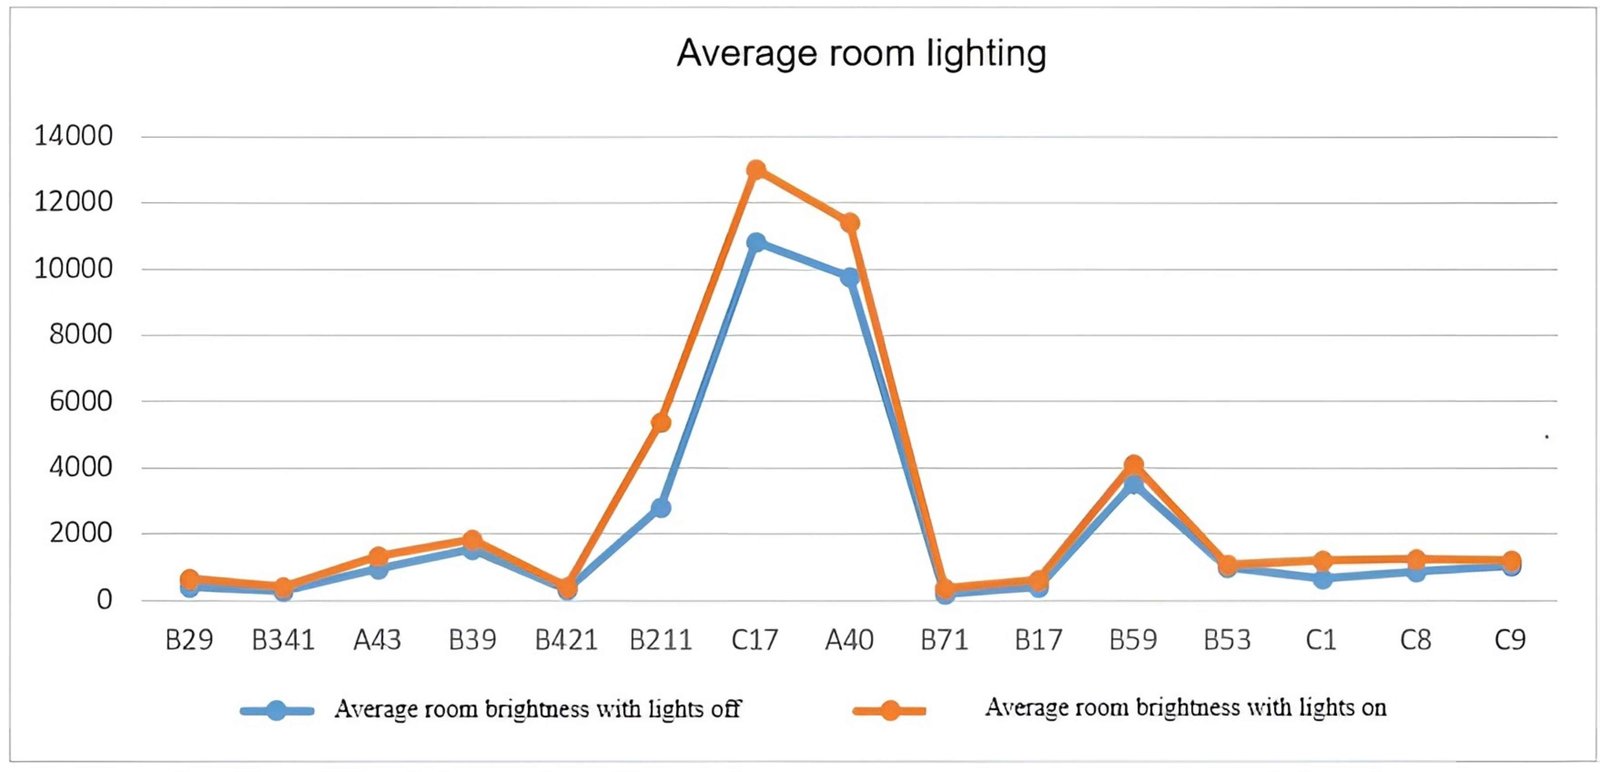 Figure 39
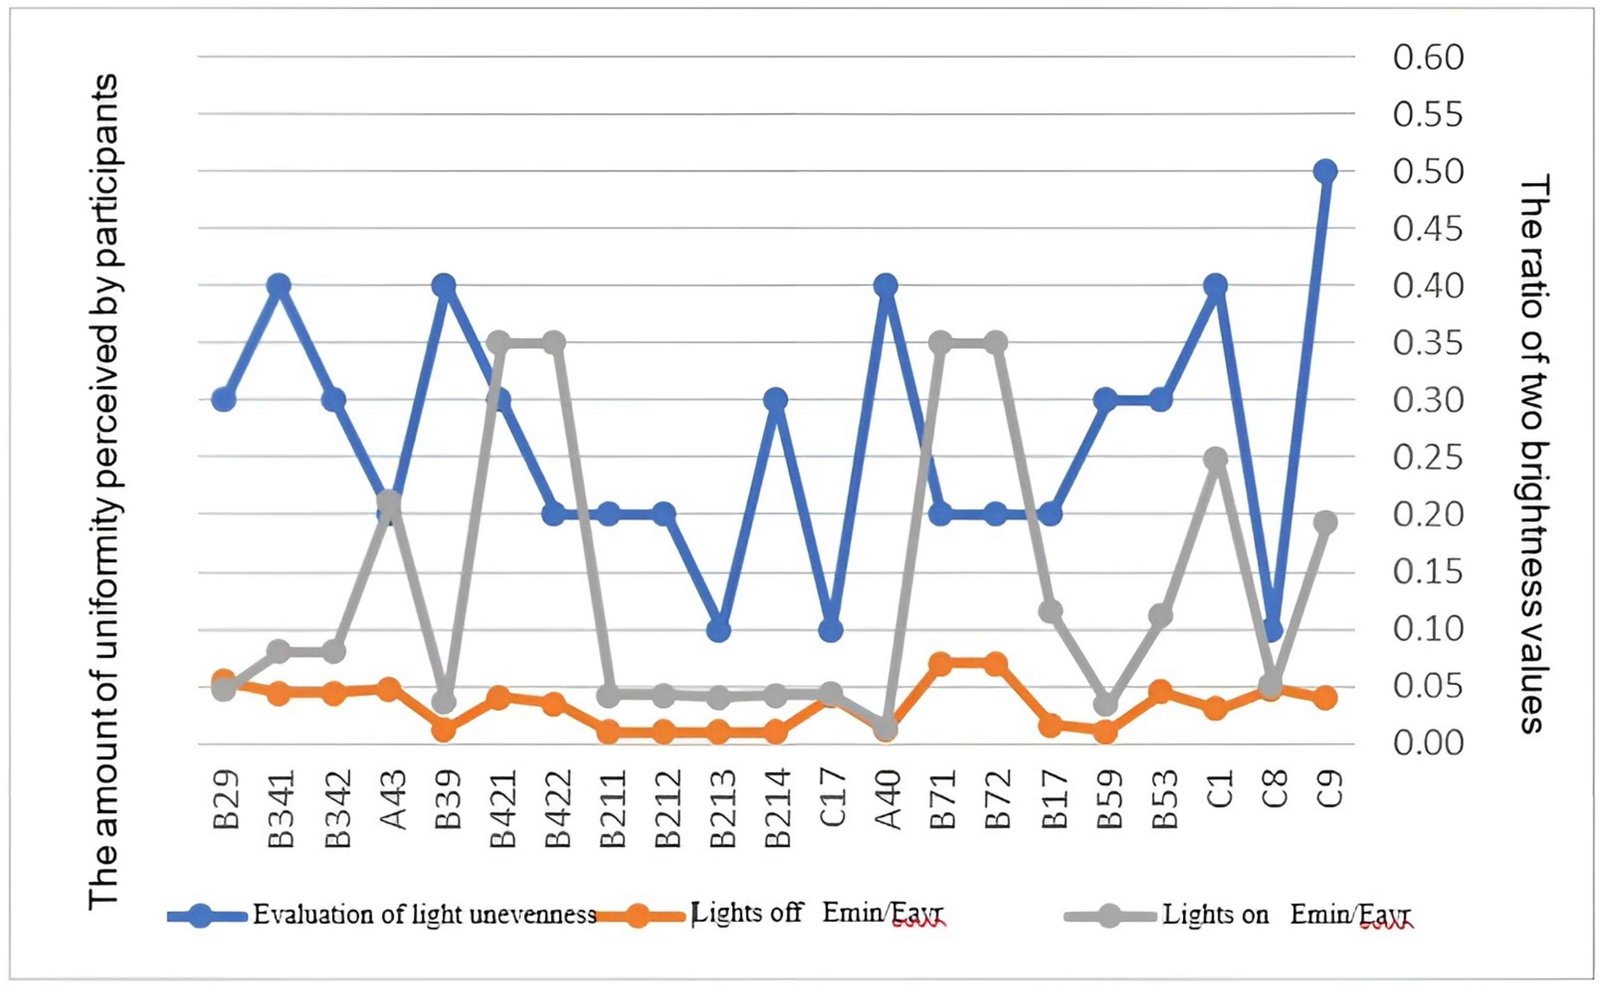 Figure 40
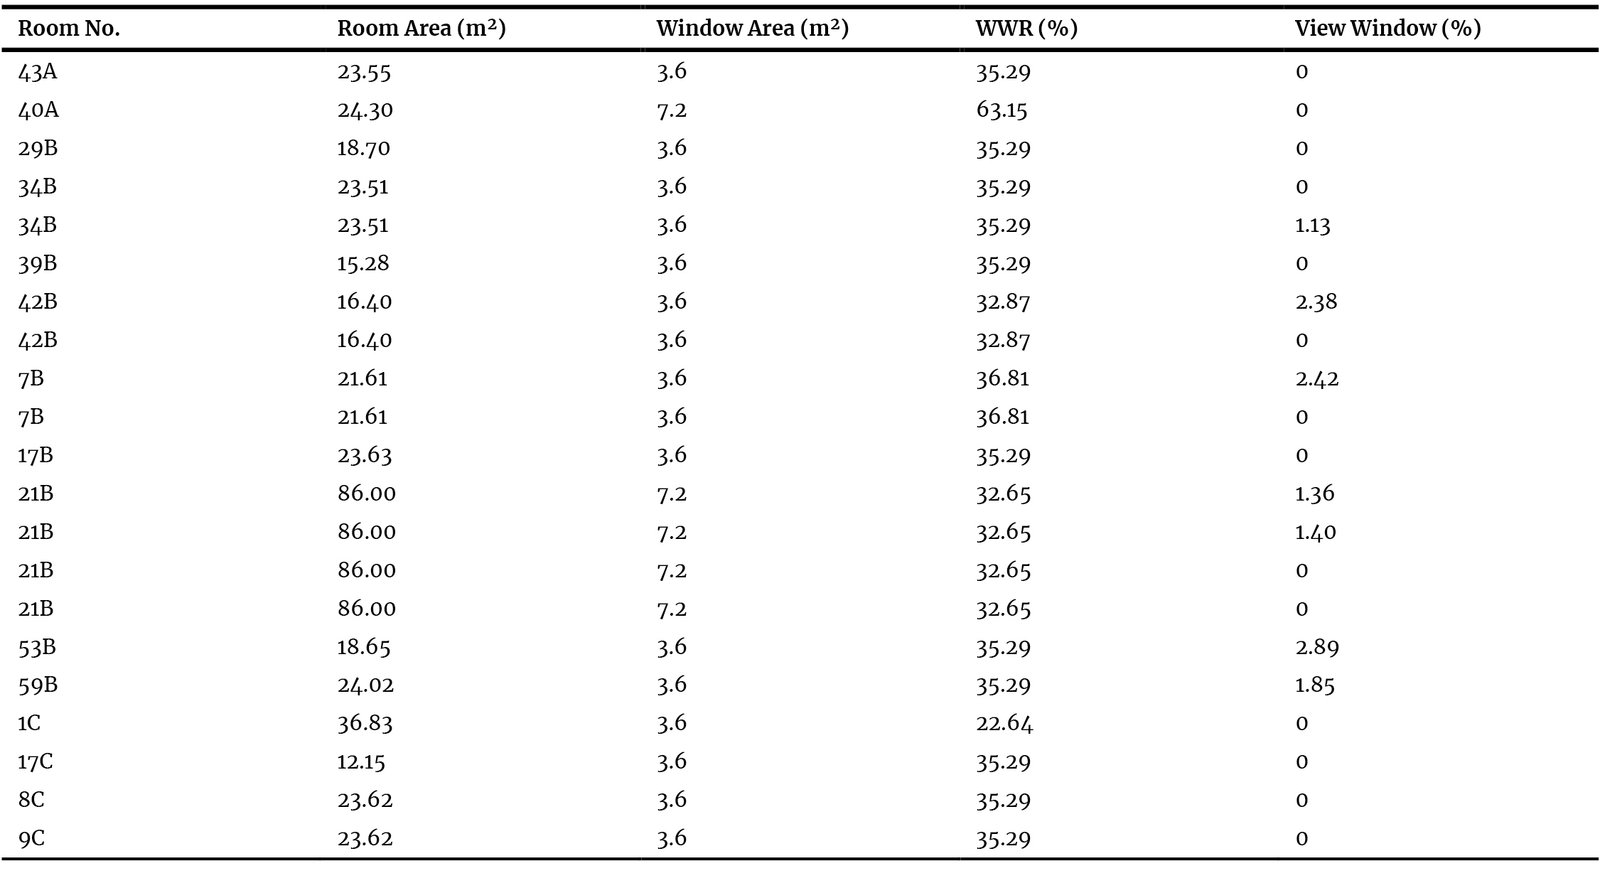 Table 1
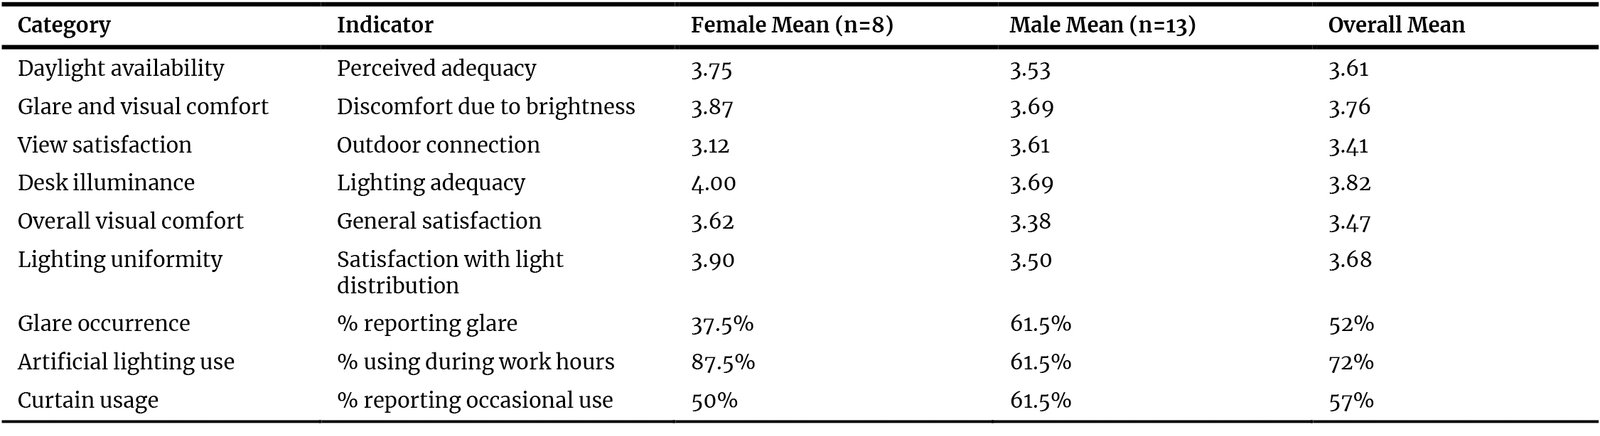 Table 2
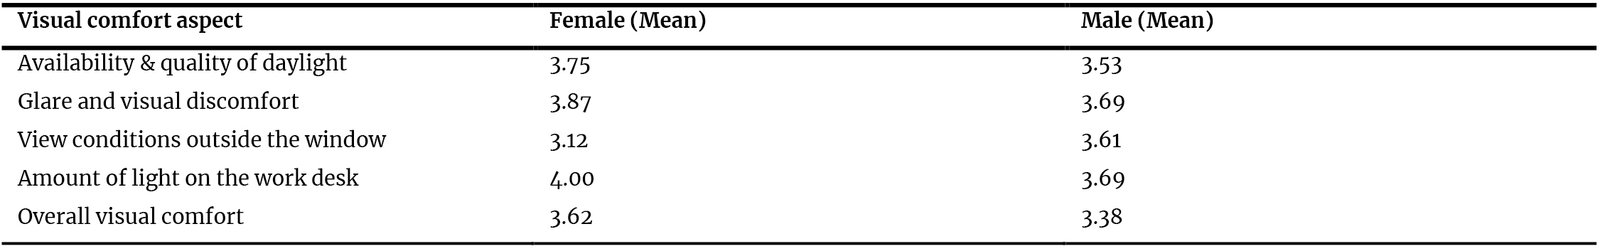 Table 3
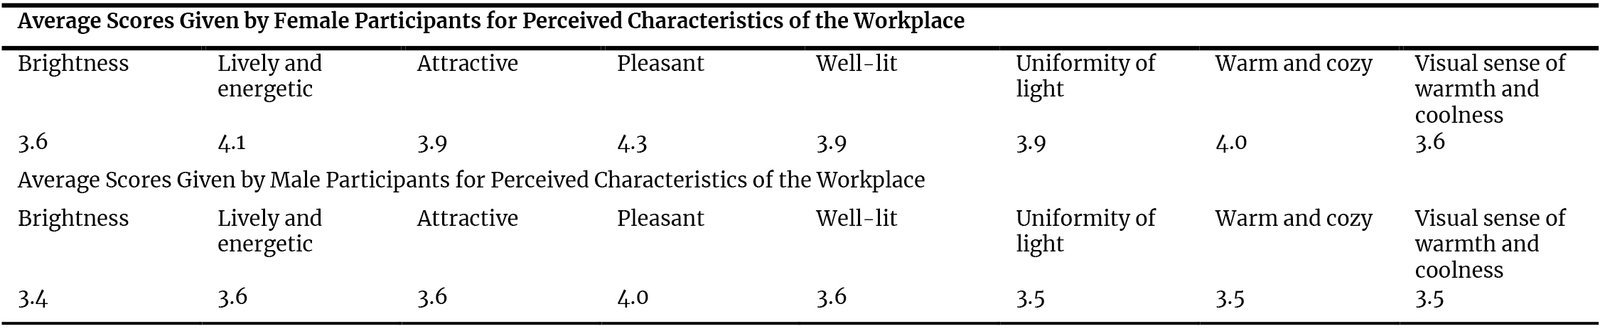 Table 4
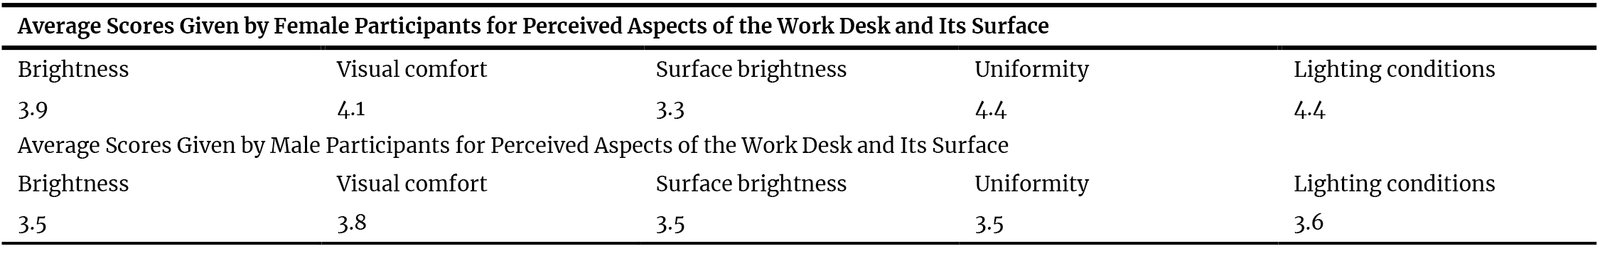 Table 5
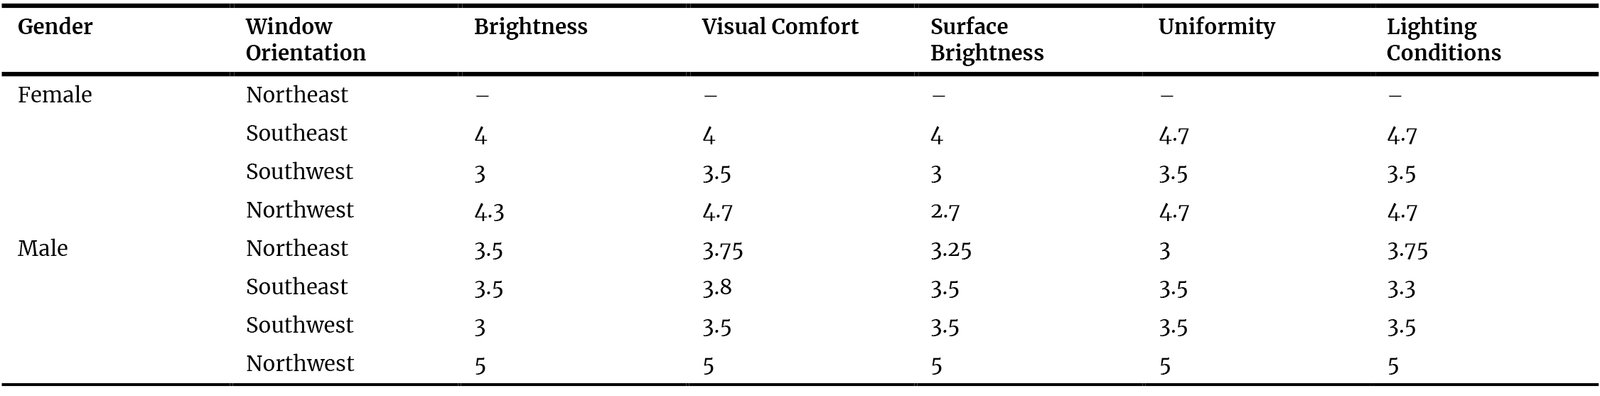 Table 6
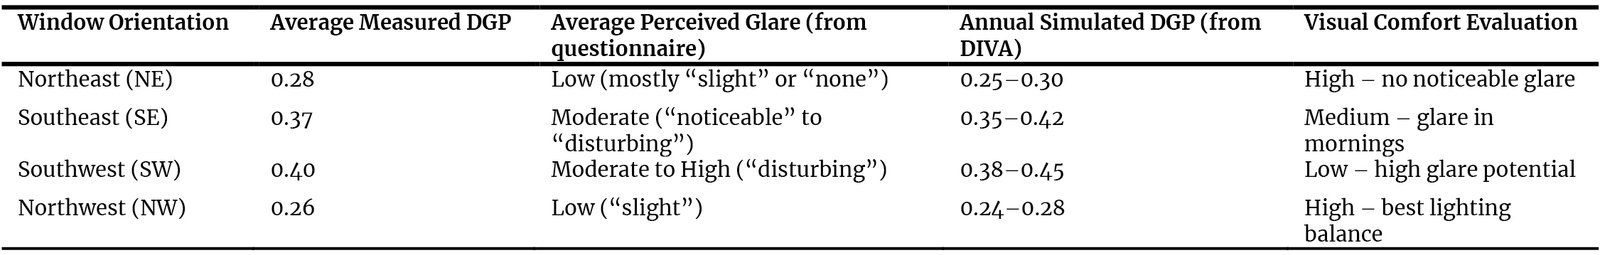 Table 7
Abstract
This study explores the relationship between glare and visual comfort in office environments in relation to daylight conditions in office spaces. The research combines three approaches: field measurements of illumination, user surveys to assess visual comfort, and 3D daylight simulations using Rhino and DIVA software, which studied 21 participants (13 men and 8 women) working in 14 office rooms with window orientations. The results show that users' perceptions of glare and satisfaction with lighting conditions are affected by the location of the desk relative to the windows and their orientation. Southeast and southwest-facing rooms had the highest levels of glare (DGP > 0.35), especially when desks were perpendicular to the windows. In contrast, northeast and northwest-facing rooms had better light balance and higher visual comfort. A statistically significant correlation was found between measured and perceived glare (r = 0.63, p < 0.05), confirming the alignment between objective and subjective evaluations. Gender differences were observed, with female participants showing a higher sensitivity to glare. The study found that full-height windows that occupy 20–40% of the facade provide the most daylight and maintain the visual connection to the outside when combined with appropriate desk placement and glare control. To increase workplace satisfaction, this study emphasizes the use of daylight simulation tools with user-based assessments during the design phase.
Keywords
daylight performance, glare, visual comfort, window orientation, user-based evaluation, office buildings
1. Introduction
Sunlight is recognized as one of the main natural factors in shaping the quality of architectural spaces [1]. This study aimed to investigate how these concepts - daylight access, glare, and visual comfort - are related in office environments, particularly in relation to window orientation and desk placement, which directly affect the user's perception of visual comfort. Daylight not only provides essential illumination but also enhances vitality, psychological well-being, and occupants’ sense of connection with the outdoor environment [2].
Daylight is generally regarded as the best lighting source for visual tasks and is essential for preserving both physical and mental well-being because of its full spectral composition and compatibility with human visual responses [3]. Daylighting, when properly integrated into interior design strategies, can improve user satisfaction and enhance the overall quality of the indoor environment [4,5]. Windows serve as the main architectural feature providing access to natural light. Their appropriate design contributes to optimal lighting, improved thermal and visual comfort, reduced electrical energy demand for lighting and ventilation, and ultimately, lower carbon emissions [6]. In office buildings, satisfaction with the environment is higher due to the visual connection to the outdoors provided by windows [7].
Many studies confirm that access to natural light and outdoor views increases occupants' productivity and environmental satisfaction, while windowless or dimly lit spaces are often associated with fatigue and decreased concentration [8]. Although visual contact with the outside is generally desired, openings can also introduce challenges such as glare and excessive variability in daylight [3,9]. From an energy perspective, daylight also plays an important role in reducing artificial light load. Effective use of daylight can reduce this demand by up to 40 , which significantly contributes to sustainable architecture by lowering operating costs and greenhouse gas emissions. Studies show that artificial lighting accounts for 30 to 50 of energy consumption in non-residential buildings [8,11].
Despite these advantages, glare is one of the major visual problems often associated with daylight entering buildings and occurs when the level of illumination in the field of view exceeds comfort thresholds, leading to eye fatigue, discomfort, and reduced visual function [12]. Previous research identifies several influencing factors, including window orientation, window-to-wall ratio (WWR), window height, glazing type, and shading systems [13,14]. Uneven distribution of natural light or excessive luminance often results in uncomfortable glare, even though daylight can increase visual comfort and save energy [12,15,16]. Additionally, user perspectives are often overlooked in architectural design processes, despite evidence that integrating occupant perception leads to solutions better aligned with human needs and environmental experience [17].
One of the most established glare assessment methods is the Daylight Glare Probability (DGP), which classifies values below 0.35 as comfortable and values above 0.40 as indicative of severe glare [18]. Controlling DGP through appropriate WWR selection and effective shading design can reduce glare occurrence by up to 50 [19,20]. This study examines how these physical parameters (daylight, glare, and sunlight) interact with user perceptions of comfort, specifically focusing on how window placement and desk orientation can reduce glare and increase visual comfort in office spaces. The Window-to-wall ratio (WWR) plays a critical role in lighting quality: increasing it improves daylight availability but can simultaneously increase glare risk and indoor temperature if not properly controlled [21]. Studies indicate an optimal WWR of 30–40 for hot-dry climates and up to 50 in colder regions [11,22].
Furthermore, users frequently evaluate visual comfort based on factors beyond illuminance alone, such as light distribution uniformity, controllability, and the availability of outdoor views [23]. Comprehensive daylight-responsive design therefore requires attention to orientation, glazing characteristics, opening size, and shading strategies [24]. Both insufficient light, which causes eye fatigue and decreased concentration, and excessive daylight, which causes glare and visual discomfort, can be problematic [25,26]. Previous studies on daylight glare in office environments have mainly relied on simulation-based approaches or controlled laboratory environments. For example, several works have focused on predicting glare indices such as DGP using annual or point-in-time simulations without direct validation through field measurements in occupied offices [12,27]. Other studies have investigated glare perception in laboratory or test room conditions, where user behavior and actual workplace adaptations have been limited [28]. In addition, many subjective assessments of visual comfort have been conducted using simplified questionnaires or short-term assessments, often without simultaneous physical measurements. Furthermore, a significant portion of the existing literature has been developed in European or North American climatic contexts that differ significantly from warm, arid regions in terms of solar radiation intensity, daylight availability, and occupant shading behavior [18].
This integrated, multi-method approach provides a more realistic understanding of glare perception and its relationship with physical light variables an area that remains understudied, particularly in the climatic and cultural context of Iran. Although this study focuses on the hot, dry climate of Iran, similar issues related to daylight and glare can be observed in other areas with high sunlight intensity. However, future research is needed to confirm whether these findings apply globally or are specific to this region. The Iranian hot–dry context, with high solar intensity, long sunshine hours, and limited use of dynamic shading, presents unique daylighting and glare conditions compared to European or East Asian office environments. Cultural working habits, such as the preference to keep curtains open, further distinguish the Iranian context, creating a genuine gap in glare-related research. Additionally, the study presents a prioritization framework for glare-related criteria that has not been previously discussed in the literature by investigating the effects of window height, light-source location, and WWR on both DGP and user-perceived discomfort. When taken as a whole, these contributions position the work as a and empirical contextual contribution in daylighting studies that can be used right away to improve visual comfort in work environments. Unlike most previous studies that examined glare only through simulation or laboratory setups, this research integrates field measurements, HDR-based luminance mapping, user perception data, and DGP simulations under the real climatic conditions of Hamedan, Iran.
However, it is important to note that the small sample size and inability to consistently monitor daylight conditions in all offices may limit the generalizability of the findings. This integrated, multi-method approach provides a comprehensive understanding of how physical and perceptual parameters interact—an area that has not been empirically explored in this regional or cultural context. This study differs from previous research for the following reasons: (1) conducting field measurements in real, occupied office environments rather than laboratory settings, (2) integrating on-site lighting measurements, HDR-based glare analysis, user perception questionnaires, and annual daylight simulations into a single framework, and (3) explicitly examining occupants' adaptive behaviors—such as desk orientation preferences and curtain use—and their impact on perceived visual comfort.
2. Research method
2.1. Research design and approach
In order to better understand the relationships between the recommended values and users’ perceptions and to analyze the current situation, three methods are needed to find a correct relationship between the obtained values.
In this study, a questionnaire was used to better understand how individuals perceive their work environment, field measurements were used to determine the current condition in the workplace, and 3D modeling software was employed for an overall analysis of these values.
2.2. Case study
In this research, 14 rooms and 21 individuals were randomly evaluated in the central building of Bu-Ali Sina University in the year 2022–2023. The sample size (21 participants across 14 rooms) was determined based on the availability of individual offices within the study site. Although not derived from statistical power analysis, it is consistent with similar field research on daylighting (e.g. [15,27] , which typically use 15–25 participants to capture real workplace changes). Given the exploratory nature of this field study and the practical limitations of working in occupied office environments, the sample size was not intended to support generalizations to the population level. Instead, statistical analyses were applied to identify indicative patterns and relationships between measured daylight metrics and perceived visual comfort. Therefore, gender-based comparisons and correlation analyses were interpreted as exploratory rather than confirmatory. Participants in this assessment were university graduates, consisting of 13 males and 8 females, with an unbalanced gender distribution due to the availability of participants from the study site. The study was conducted in a university setting where the gender ratio of employees is naturally unbalanced and more male participants were available for assessment. This gender imbalance does not introduce systematic bias, as the primary focus of the study was on perceived glare and visual comfort, both of which are influenced by environmental factors such as lighting conditions and desk orientation, rather than gender alone. Participants had a mean age of 40.1 years, with a range of 32 to 52 years. Most participants reported normal or corrected-to-normal vision. Only three participants used prescription glasses for routine visual tasks, mainly for mild refractive errors. None of the participants reported any diagnosed visual impairments or eye diseases that could significantly affect the perception of glare or visual comfort. Participants who wore prescription glasses were not excluded from the study, as corrected vision reflects typical real-world office conditions. Inclusion of these participants increases the ecological validity of the study and does not introduce systematic bias, as glare perception depends on brightness contrast and visual accommodation rather than partial refractive correction.
Then, the obtained data were compared with the opinions of the office employees and evaluated against some indicators such as DGP. This administrative center is located in the main campus area of Bu-Ali Sina University in Hamedan (latitude 34 47 27.6 N and longitude 48 29 22.5 E) (Fig. 1).
Figure 1
Fig. 1. Study area and building.
The rooms in this center are independent offices with different geometries, lighting characteristics, and orientations.
The 14 sample rooms were intentionally selected to represent a wide range of orientations and floor levels within the building. The differences in floor levels and orientations were taken to reflect the variety of daylight exposure conditions available in the building, as these factors can significantly affect the quantity and quality of daylight entering each office. Rooms on higher floors may experience different levels of sunlight access compared to rooms on lower floors due to potential shading effects from the building structure or surrounding environment.
In addition, variations in window orientation also contribute to different daylight conditions, with southeast and southwest-facing rooms receiving more direct sunlight in the morning and afternoon, while northeast and northwest-facing rooms benefit from more evenly distributed daylight. These differences in daylight exposure are important for understanding how office layout and room location affect visual comfort and glare perception in real-world office environments.
Most studies on glare are conducted in laboratories. The selection and collection of measurements in real offices were carried out with the aim of analyzing actual spaces and comparing the measurement results with the opinions of individuals who are usually present in these environments and have a clear understanding of the glare problems in their workplaces. However, this selection also involved some challenges. The measurements and photography interfered with the employees’ work activities; therefore, at times, the measurement process had to be suspended to allow the employee to perform their tasks. The measuring and imaging equipment had to be continuously and quickly moved so that the staff could continue their work. Fig. 2 shows the measured plans.
The reason for selecting these offices was their cooperation in conducting this research, as a number of other rooms did not provide the necessary collaboration at all. Within these constraints, the evaluated offices provide a representative range of spatial and daylighting conditions present in the building.
Figure 2
Fig. 2. Floor plans of the complex: figure A (ground floor plan), figure B (first floor plan), and figure C (second floor plan).
Although accessibility and occupant collaboration were necessary practical constraints in selecting the study offices, the spatial selection was not arbitrary. The 14 rooms were intentionally selected to represent all four cardinal directions of the building’s facade. Specifically, three offices (43A, 29B, and 34B) face northeast; five offices (40A, 21B, 39B, 42B, and 17C) face southeast; three offices (7B, 17B, and 59B) face southwest; and four offices (53B, 1C, 8C, and 9C) face northwest. In addition to orientation, the rooms share comparable functional use (separate academic offices), similar window types, and fixed interior shading systems (fabric blinds), while differing in window-to-wall ratio, floor area, and desk position relative to the window. This combination of common features and controlled variations allowed for systematic comparisons of daylight exposure and glare perception in different directions.
Some of the windows in these offices faced the central courtyard, while others faced the exterior façade. The only shading device in each room consisted of fabric curtains hanging on the interior side, and no other shading device was used on the windows. During the research process, all curtains were kept open to better identify the conditions of visual discomfort. Although accessibility and user collaboration were necessary practical constraints in selecting the study offices, the spatial selection was not arbitrary. The offices were deliberately selected to represent all four principal orientations (northeast, southeast, southwest, and northwest), different floor levels, and different window-to-wall ratios. This ensured that the dataset covered a wide range of daylight exposure conditions and glare scenarios, allowing for meaningful comparisons of visual comfort responses across orientations, rather than relying solely on convenience sampling.
2.3. Instruments and measurements
2.3.1. Camera setup
According to previous research, for the use of daylight analysis software, it was preferable to use a camera equipped with a CCD light-sensing sensor rather than a CMOS one. In this study, a Nikon Coolpix 995 camera was used. Another important factor for more accurate analysis of the amount of light reaching the eye in an environment is the use of a lens similar to the human eye. For this purpose, fisheye lenses, which provide the widest field of view among other lenses, should be used. The lens used in this study was the FC-E8 (Fisheye). The camera was positioned behind the participant’s desk at a height of 1.20 meters on a tripod, corresponding to the approximate eye level of a seated person (Fig. 3).
Figure 3
Fig. 3. Some pictures taken.
2.3.2. HDRI conversion
Various daylight analysis software programs that operate based on photographic data require HDRI (High Dynamic Range Imaging) photos. To create HDRI images, at least three photographs of a fixed area must be taken with a constant ISO and varying exposure values for the camera aperture. Photography within the rooms and behind the participants’ desks was conducted in four conditions:
- Facing forward (toward the monitor) with the light on,
- Facing forward (toward the monitor) with the light off,
- Looking at the desk while writing on paper with the light on, and
- Looking at the desk while writing on paper with the light off.
Each of these four conditions, photographed at least three times, was then converted into HDRI format using AFTAB-ALFA and Photoshop software.
2.3.3. Illuminance measurement
The illuminance values were measured using a Kimo Luxmeter LX200 device equipped with a light intensity detection sensor capable of measuring within the range of 0.1 to 200,000 lux. Vertical illuminance was measured at eye level, and horizontal illuminance was measured on the desk surface at points on the work desk, at the darkest point in the room, at the brightest point in the room, and again on the desk surface. To describe the outdoor daylight conditions for each room, the horizontal illuminance outside was also measured at the center of each window.
Table 1 presents information about the windows in each room. The last column indicates the percentage of the window area within the field of view of a seated person looking straight ahead. Due to existing limitations, this experiment was conducted on the 26th of November between 8 a.m. and 12 p.m. The measurement date was deliberately chosen to represent critical daylight conditions, not an average scenario. Late autumn was chosen because low sun elevation angles increase the likelihood of direct sunlight penetration and glare into office interiors, especially in east- and south-facing spaces. Previous studies on daylight and glare have identified periods of low sun angle as critical reference conditions for assessing visual discomfort [1,2]. Measurements were taken during standard working hours (8:00–12:00) to capture the actual exposure conditions of occupants during peak visual work periods. All field measurements and HDR photography were performed under mostly clear sky conditions. The measurement day was characterized by stable weather and availability of direct sunlight, with no significant cloud cover during the data collection period. Clear sky conditions were intentionally chosen because they represent critical scenarios for glare occurrence and allow for the assessment of worst-case visual discomfort conditions in office environments.
Table 1
Table 1. Information related to room windows.
Field measurements and HDR-based glare assessments were conducted over a limited time frame during a typical working day. These measurements were not intended to characterize annual daylight or glare behavior. Instead, they were used as short-term reference data to support interpretation of user perception and validation of the simulation model under real-world operating conditions.
One of the characteristics of this month is the low angle of the sun relative to the horizon, which allows sunlight to penetrate more deeply into indoor spaces. Consequently, the potential for visual discomfort increases during this period due to the excessive presence of sunlight.
Simultaneously with photographing and measuring the illuminance levels of certain points in the room, a questionnaire was given to individuals in order to obtain their opinions about their working environment. Rather than being designed as a fully standardized or clinically validated instrument, this questionnaire was adapted from previously published post-occupancy and visual comfort assessment studies. Its aim was to capture specific perceptions of glare levels and daylight quality in real-world work situations, consistent with the exploratory nature of this field study. In this questionnaire, users were asked about the position of their desks relative to the window and which desk location they preferred in relation to the window. Other questions were also asked, such as the characteristics of their workspace, their visual comfort, and their level of satisfaction with the work environment. Additionally, questions were asked regarding the perceived level of glare.
Participants were required to rate the perceived glare from the paper surface and the monitor surface using four levels: slight / noticeable / disturbing / intolerable. In order to simulate the interior environment for analyzing the annual glare level of the examined rooms, each room was modeled in the Rhino software in 3D, and then, using the Diva plugin after completing required steps such as material assignment and setting the height of the light sensors the annual glare analysis was carried out based on occupancy schedules and user positions in each space. While moderation-based measurements are often used to represent average daylight conditions, the present study prioritized a worst-case glare scenario approach to better reveal potential risks of visual discomfort in real-world office environments.
To ensure the validity of the annual daylight simulation results, a short-term validation phase was conducted. The simulated DGP values in DIVA for the exact date and time of the field measurements (November 26, between 8:00 and 12:00) were directly compared with HDR-based glare indices obtained in situ. Both datasets were generated under clear sky conditions and identical observer positions. This temporal and conditional alignment allowed for validation of the simulation model before extending the analysis to annual glare behavior. The research process is shown in Figure 4.
Figure 4
Fig. 4. Research methodology flowchart.
3. Results
3.1. Questionnaire-Based Assessment of Visual Comfort
Two structured questionnaires were distributed to 21 employees (13 men and 8 women) in 14 offices of Bu-Ali Sina University. The offices had different orientations and geometries. The aim was to assess participants' perceptions of daylight quality, glare, and overall visual comfort. To assess the internal consistency of the questionnaire responses, reliability analysis was conducted using Cronbach's alpha. The results indicated acceptable internal consistency for exploratory research, which supports the use of the questionnaire for comparative and correlational analysis rather than predictive or diagnostic purposes. The first questionnaire assessed personal characteristics, workspace configuration, daylight preferences, and satisfaction with visual comfort, while the second examined glare perception and lighting-related discomfort under real working conditions.
The participants consisted of 62 men and 38 women, with mean ages of 41 and 37 years, respectively. Among the participants, three wore prescription glasses for mild refractive errors, while the rest did not require corrective lenses. A comparison between the results of those who wore glasses and those who did not showed any significant differences in perceived glare or visual comfort, indicating that the presence of prescription glasses did not introduce any bias into the study. This inclusion of participants who wear corrective lenses increases the ecological validity of the study, as it reflects typical real-world office environments.
Most respondents (over 90 ) worked indoors full-time, primarily performing computer-based tasks. More than 70 held postgraduate degrees, indicating a relatively experienced and homogeneous sample of office users. Spatially, 48 of offices faced southeast, 19 northeast, 19 northwest, and 14% southwest. Only 14 of participants expressed satisfaction with their current desk location, while most preferred positions closer to the window to benefit from natural light and outdoor views. However, many participants also reported discomfort when their desks were directly perpendicular to the window due to reflections on screens and uneven brightness. Clear, colorless glazing was predominant in 90 of offices and was preferred by 85.7 of occupants, both male and female, mainly because it allowed adequate daylight and visibility to the outdoors. A small proportion (14.3 ) favored reflective glazing—primarily in southeast-facing rooms—citing thermal discomfort and glare from direct sunlight as the main reasons.
Artificial lighting was used by almost all participants (95 ) during working hours, regardless of daylight presence. The main reasons included insufficient natural light and lack of individual control over central lighting systems. In most rooms, occupants stated that daylight alone was inadequate for daily visual tasks, especially in the morning and late afternoon. About 50 of women and 61 of men reported occasional use, mainly in rooms with southeast and southwest orientations where direct solar exposure caused excessive brightness. The most common reasons for curtain use were to reduce glare, balance the brightness contrast between indoors and outdoors, and prevent overheating. Regular curtain use was highest in room 40A (southeast-facing, full-height glazing), where continuous sunlight exposure led to discomfort. Glare sources included direct sunlight through the window, reflections from desks, and computer screens. About 60 of respondents indicated that glare interfered with their work, causing visual fatigue, headaches, and reduced concentration. For instance, in southeast-facing rooms, perpendicular desk arrangements led to higher reported discomfort levels, while side-facing setups were preferred for minimizing reflections.
Figure 5 illustrates the overall distribution of perceived glare intensity among participants, showing that southeast- and southwest-facing rooms produced the highest reported discomfort levels. Satisfaction with visual comfort varied among participants. As summarized in Table 2, daylight availability and desk illuminance received relatively high scores, while satisfaction with glare control and lighting uniformity was lower. Figure 6 shows the average perceived lighting uniformity for each room, revealing that northwest-facing offices achieved the highest perceived balance of brightness, while southeast-facing rooms were rated lowest.
Figure 5
Fig. 5. The overall perceived glare from the environment.
Figure 6
Fig. 6. Valuing the uniformity of light perceived by each person in the room.
Table 2
Table 2. Summary of questionnaire results.
In addition, participants were asked to identify key factors influencing their perception of the office lighting environment. As shown in Fig. 7, the most influential factors were daylight uniformity, glare intensity, desk brightness, and access to outdoor views. These variables demonstrate the complex interaction between physical light parameters and subjective comfort perception.
Although participants valued daylight and exterior views, excessive brightness and reflections led to behavioral responses such as frequent curtain use and reliance on artificial lighting. The consistency between users’ subjective feedback and the measured glare data is reported.
Figure 7
Fig. 7. Lighting factors that affect people's perception of their work space.
In order to analyze the users’ preferences and the existing desk placement conditions, eight separate desk positioning scenarios A to H were defined and coded (Fig. 8). These scenarios represent different relative positions of the desk with respect to the window and the room geometry: A: Desk placed with its back to the window. / B: Desk placed parallel to the window on the right. / C: Desk placed parallel to the window on the left. / D: Desk placed perpendicular to the window on the right. / E: Desk placed perpendicular to the window on the left. / F: Desk placed facing the window. / G: Desk placed in a corner position near the window. / H: Desk placed in a position preferred by the user and selected from the above configurations. The labels shown on the horizontal axis of Fig. 8 (e.g. B29, B34, A43) correspond to the individual office rooms evaluated in this study, as defined in the case study section (Section 2.2). Each code represents a unique office space with a specific orientation, geometry, and window configuration.
Figure 8
Fig. 8. Comparison between current and preferred desk placement in the studied office rooms. (The vertical axis (A-H) shows predefined scenarios of desk position relative to the window, while the horizontal axis shows the evaluated office rooms. The blue line indicates the current desk position and the orange line indicates the preferred position reported by the users.).
Only 14.3 of participants were satisfied with their current desk position. It should be noted that the measured glare results represent specific observation periods and are not directly generalized to annual conditions, but rather addressed through simulation-based analysis.
Differences in desk position and height were also analyzed in relation to visual comfort. Participants whose desks were perpendicular to windows, particularly those in rooms with a southeast and southwest orientation, reported higher levels of discomfort from glare. In contrast, those whose desks were parallel to or facing the windows generally reported lower levels of discomfort. Desk height relative to the window also affected comfort, with participants reporting greater discomfort when desks were too high or too low relative to the window, which affects the distribution of daylight across the desk surface.
Regarding the use of artificial lighting, among the rooms where women were located, 62.5 always and 37.5 often used artificial lighting. Among the rooms where men were located, 61.5 always, 30.77 often, and 7.7 sometimes used artificial lighting. Among the female participants, 75 believed that daylight was insufficient, and one person used artificial lighting because it was centrally installed, while another used it because natural light caused glare. Among the male participants, 84.61 believed that natural lighting was inadequate, and one person used artificial lighting because it was centrally installed, while another used it because natural light caused glare. In total, 95.23 of the participants used artificial lighting throughout the entire working hours (Fig. 9).
Figure 9
Fig. 9. Amount of artificial lighting used during the day in each room.
The gender distribution was unbalanced, with 13 male and 8 female participants. Although this difference is significant, it reflects the number of participants in the study setting, where the gender ratio is skewed more towards male employees. Despite this imbalance, gender did not have a significant impact on perceived glare or visual comfort, as these factors were primarily influenced by office environment, window orientation, and desk layout rather than gender. However, small differences were observed, with female participants reporting slightly greater sensitivity to glare, particularly in rooms facing southeast and southwest. These findings are considered trends due to the small sample size and are not statistically significant.
Among the female participants, 87.5 of them, and among the male participants, 46.15 of them turned on the lamps regardless of the presence of sunlight or natural light.
Based on this question, a difference in lighting usage behavior was observed between male and female participants in the study sample; however, given the limited number of participants, this finding should be interpreted as a sample-specific trend, rather than a general behavioral conclusion (Figure 10).
Figure 10
Fig. 10. Reasons for using artificial lighting during the day.
Regarding the preferred light source in the room, 87.5 of the female participants preferred natural light, and one person preferred a combination of natural and artificial light.
Among the male participants, 46.15 preferred natural light, another 46.15 preferred a combination of natural and artificial light, and one person preferred artificial light (Fig. 11). In the section where participants were asked about glare discomfort, 62.5 of the female participants stated that glare interfered with their work and caused fatigue, headaches, mild eye pain, and difficulty in perceiving room angles, as well as disturbances when writing on paper or using the computer keyboard. Among the male participants, 53.84 reported that glare disturbed their work and caused mild eye pain, difficulty in perceiving room angles, and problems when writing on paper or using the computer keyboard (Figure 12).
Figure 11
Fig. 11. People's preferred light source.
Figure 12
Fig. 12. Type of nuisance caused by glare.
Based on the results of Table 3, the average scores given by female and male participants to various visual comfort indicators show that both groups expressed relatively good satisfaction with the amount of daylight and the view outside. However, perceptions of glare and visual discomfort were reported to be slightly higher among female participants; these differences were small and not statistically significant and are therefore reported only as indicative trends. The highest level of satisfaction was related to the “amount of light on the work desk,” while the lowest level was associated with the “view conditions outside the window.”
Table 3
Table 3. Comparison of mean visual comfort scores between female and male participants.
According to Table 4, in the workplace, the overall perception of environmental characteristics was more positive among female participants compared to male participants. The highest average scores in both groups were related to ‘pleasantness’ and ‘vibrancy of space’ .
Table 4
Table 4. Average Scores Given by Female and Male Participants for Perceived Characteristics of the Workplace.
According to the results of Table 5, female participants gave higher evaluations for “visual comfort” and “uniformity of brightness” on the desk surface (with averages of 4.1 and 4.4, respectively). Male participants assigned lower scores across all indicators, particularly for surface brightness.
Table 5
Table 5. Average Scores Given by Female and Male Participants for Perceived Aspects of the Work Desk and Its Surface.
Table 6 shows the lighting conditions of the offices based on the window orientation and the gender of the occupants. For both groups, northwest-facing rooms received the highest scores for brightness, visual comfort, and uniformity.
Table 6
Table 6. Final Classification of Windows and Their Lighting Conditions.
In comparing the brightness levels of the work desk surface and the computer screen: For 100 of the female participants, the brightness difference was appropriate; among them, 37.5 reported feeling neither completely comfortable nor uncomfortable, while 62.5 reported full satisfaction and visual comfort. For 76.9 of the male participants, the brightness difference was suitable, while 23.1 found it too low. Additionally, 61.5 reported feeling neither complete comfort nor discomfort, 30.7 experienced full satisfaction and comfort, and one participant reported feeling visual discomfort (Figs. 13 and 14).
Figure 13
Fig. 13. People's perception of the difference between desktop and computer screen lighting.
Figure 14
Fig. 14. Feeling the difference in brightness between the desktop and the computer screen.
In the comparison between the brightness of the computer screen and the window or wall behind it: The brightness difference was suitable for 87.5 of women; for 62.5 of them, it provided neither complete comfort nor discomfort, and for 37.5 of them, it provided complete satisfaction and comfort. The brightness difference was suitable for 61.53 of men; for 30.7 of them, it was too much, and for one person, it was too little. Among these, 84.6 felt neither complete comfort nor discomfort, and 15.38 felt complete satisfaction and comfort (Figures 15 and 16).
Figure 15
Fig. 15. People's perception of the difference in brightness between a computer screen and the window or wall behind it.
Figure 16
Fig. 16. People's perception of the difference in brightness between a computer screen and the window or wall behind it.
In the comparison between the brightness of the screen desk and the window or wall in front of you. The brightness difference was suitable for 87.5 of women; for 50 of them, it provided neither complete comfort nor discomfort, and for 50 of them, it provided complete satisfaction and comfort. The brightness difference was suitable for 84.61 of men; for one of them, it was too much, and for another, it was too little. Among these, 46.2 felt neither complete comfort nor discomfort, 38.4 felt complete satisfaction and comfort, and two people felt discomfort and uneasiness (Figures 17 and 18).
Figure 17
Fig. 17. People's perception of the difference in brightness between a screen/desk and the window or wall opposite it.
Figure 18
Fig. 18. People's perception of the difference in brightness between the screen/desk and the window or wall opposite it.
In the comparison between the brightness of the window and the farthest wall from it:
The brightness difference was suitable for 62.5 of women; for 25 of them, it was too little, and for one person, it was too much. The participants’ feelings toward this brightness difference showed that 37.5 experienced complete satisfaction and comfort, another 37.5 felt discomfort and uneasiness, and two people felt neither complete comfort nor discomfort. The brightness difference was suitable for 61.53 of men; for 30.77 of them, it was too much, and for one person, it was too little. Among these, 46.2 felt neither complete comfort nor discomfort, 30.77 felt complete satisfaction and comfort, and three people felt discomfort and uneasiness (Figs. 19 and 20).
Figure 19
Fig. 19. People's perception of the difference in brightness between a window and the farthest wall.
Figure 20
Fig. 20. People's perception of the difference in brightness between a window and the farthest wall.
3.2. Field Measurement Results
According to the software analysis, except for the following cases, all other instances of glare are minor. In the northeast-facing rooms: in room 40A, with the lights off and when viewing the monitor screen, the glare is significant (Fig. 21).
In the southeast-facing rooms: in room 43A, with the lights on and when viewing the monitor screen, the amount of glare is considerable (Figs. 22 and 23).
Figure 21
Fig. 21. Room 40A.
Figure 22
Fig. 22. Room 43A.
Figure 23
Fig. 23. The false color image of Room 43A shows the position of the desk, with its back to the window.
In room 21B, in the first position, when sitting to the right of the window and perpendicular to it with the lights off and when viewing the work desk, the glare is disturbing (Figs. 24 and 25).
Figure 24
Fig. 24. Room 21B, first mode.
Figure 25
Fig. 25. The false color image of Room 21B shows the position of the table perpendicular to the window and to the right of the window.
In the same room, when sitting to the right of the window and parallel to it, with the lights on and when viewing the monitor screen, the glare is considerable (Figs. 26 and 27).
Figure 26
Fig. 26. Room 21B, second mode.
Figure 27
Fig. 27. The false color image of Room 21B shows the table being positioned parallel to the window and to the right of the window.
Again, in the same room, on the left side of the window and parallel to it, when the lights are off and when looking at the work desk, the amount of glare is considerable (Figs. 28 and 29).
Figure 28
Fig. 28. Room 21B, fourth mode.
Figure 29
Fig. 29. The false color image of room 21B shows the position of the table perpendicular to the window and to the left of the window.
In the southwest-facing rooms: in room 59B, when viewing the work desk, the amount of glare is disturbing both when the lights are on and when they are off (Figs. 30 and 31).
Figure 30
Fig. 30. Room 59B.
Figure 31
Fig. 31. The false color image of room 59B shows the position of the table perpendicular to the window.
It should be noted that the values mentioned are only valid for a specific day of the year and a specific time of day. Due to the dynamic movement of the sun throughout the day and across the months of the year, both the location and intensity of glare may vary. Therefore, using only one photo to calculate glare levels for the entire year is ineffective. To calculate the uniformity of light in a room, the illuminance at various points in the room must be measured at a constant height. Then, the illuminance of the darkest point is divided by the average illuminance. This value ranges up to a maximum of 1, representing the highest possible light uniformity. For office spaces, this value is ideally between 0.6 and 0.65. In this office, the uniformity of lighting in none of the measured rooms approached 0.6 or 0.65, with the highest uniformity measured at 0.35 in rooms 42B and 7B. Among the measured parameters, the highest Pearson correlation coefficients were found between the measured DGP (Daylight Glare Probability) and the perceived DGP by individuals from the monitor, as well as between the horizontal illuminance of the desk surface with the lights off and the perceived DGP from the desk surface. Glare sources varied across rooms with different desk orientations. directions where the window is within the person’s field of view, the sources of glare are, in order: the window, the monitor, the ceiling lights, and the reflection of these lights on the desk. If the window is not directly within the field of view, the main sources of glare are the monitor, reflections of sunlight on interior surfaces, the ceiling lights, and their reflections on the desk.
Field measurements represent specific moments in time and were used to identify critical glare situations rather than annual performance.
3.3. Annual Simulation Results
To better understand the glare conditions in each room throughout the year, it is not possible to conduct experiments or take photographs continuously. Therefore, the annual radiation behavior was evaluated exclusively through climate-based daylight simulations, while field measurements were limited to specific dates and times and used only for calibration and validation purposes. Simulations were performed in DIVA for Rhino using the Radiance-based daylight coefficients method. The Perez all-weather sky model was applied. Material reflectances were set as follows: ceiling 0.8, walls 0.7, floor 0.3, and glazing transmittance 0.65. Sensor grids were spaced at 0.5 m intervals at 0.8 m height above the floor. These parameters ensured consistency with real-world field conditions. Therefore, to evaluate the existing glare in relation to daylight within the rooms, the rooms were modeled in 3D using Rhino software, and then an annual analysis of the rooms was carried out using the DIVA for Rhino plugin. However, since this analysis is highly time-consuming, only a few selected rooms were analyzed. Figure 32 shows the analysis of the annual glare probability for room 29B, where the desk is positioned with its back to the window. The window of this room faces northeast. As the analysis results indicate, with this desk arrangement, the room does not experience noticeable glare from the window throughout the year. This result can also be applied to rooms 43A and 34B, where the desks are similarly positioned with their backs to the window
Figure 32
Fig. 32. Diva's annual analysis of Room 29B (Table position with back to window).
Figure 33 presents the analysis for room 43B, with the window oriented to the northeast and the desk positioned perpendicular to it. The analysis shows that during the months of April and May and August and September, between 7 and 8 a.m., there is a probability of intolerable glare. During the rest of the day and year, the DGP remains below 0.35.
Figure 33
Fig. 33. Diva's annual analysis of Room 43B With the window facing northeast and the table positioned perpendicular to the window.
Figure 34 shows the analysis for room 21B, with the window facing southeast and the desk located to the left of the window and perpendicular to it. According to this analysis, the highest glare probability occurs during the months of November to February. However, since the duration of this glare is short, it can be disregarded.
Figure 34
Fig. 34. Diva's annual analysis of room 21B with the window facing southeast and the desk positioned to the left of the window and perpendicular to it.
Figure 35 shows the analysis for room 21B, with the window facing southeast and the desk positioned to the right of the window and perpendicular to it. In this analysis, intolerable glare occurs only once during the year, in the second half of November, between 7 and 8 a.m. Again, due to the short duration, this glare can be overlooked.
Figure 35
Fig. 35. Diva's annual analysis of room 21B facing southeast and the position of the table to the right of the window and perpendicular to it.
Figure 36 presents the analysis for room 59B, with the window facing southwest and the desk positioned to the right of the window and perpendicular to it. The analysis indicates that during the months of November to February, the highest probability of glare occurs in November between 7 and 9 a.m., and in February between 8 and 9 a.m., where the glare is noticeable, disturbing, and sometimes intolerable. However, as the duration of glare is limited, it can be ignored.
Figure 36
Fig. 36. Diva's annual analysis of room 59B with the window facing southwest and the desk positioned to the right of the window and perpendicular to it.
It should be noted that to compare and verify the accuracy of this software in detecting DGP, photo analyses were first compared with the results from the software before proceeding with the full analysis. Simulated DGP results for the field measurement date (November 26) were directly compared with HDR-derived glare indices. The differences between measured and simulated DGP values were within ±0.04, validating the accuracy of the simulation model. Measured data and simulations were both conducted under clear-sky conditions on November 26 (8:00–12:00). In DIVA-based simulations, DGP was calculated considering daylight contributions only, while HDR-based glare analyses included both daylight and electric lighting conditions (‘lights on’ and ‘off’ scenarios). Electric luminance levels from ceiling fixtures were included in HDR images but excluded from annual daylight simulations to isolate the impact of daylight glare. Simulation parameters were validated against field-measured illuminance data to ensure model reliability and consistency between real and simulated conditions.
Following this validation, the simulation framework was extended to the annual scale to investigate long-term glare patterns that could not be captured solely through short-term field measurements.
Therefore, the annual simulations were not intended to replicate the measured conditions, but rather to complement them by identifying seasonal and orientation-dependent glare hazards.
3.4. Integrated Analysis of Field, Questionnaire, and Simulation Results
This integration was not limited to parallel analyses. Field measurements informed simulation calibration (e.g., material reflectance and illuminance levels), while user perception data validated glare predictions from DGP simulation. This methodological loop ensured consistency between physical, perceptual, and simulated datasets, achieving a synergistic integration rarely applied in previous glare studies. All results were collectively compared and examined to gain a complete understanding of the relationship between measured values, user perceptions, and simulated glare data. Comparisons between field measurements and subjective assessments showed strong agreement in identifying critical glare sources. Participants’ glare complaints were primarily related to workstations facing southeast and southwest windows, directions identified in both measurements and simulations as directions with higher daylight glare probability (DGP). According to field data, the highest DGP values were associated with horizontal illuminance levels above 1200 lux and vertical illuminance levels above 800 lux at eye level. Field results indicated that discomfort increased noticeably above 800 lux, while maintaining vertical illuminance levels below approximately 600 lux generally ensured visual comfort. In these conditions, participants often reported ‘noticeable’ to ‘discomforting’ glare, especially when viewing a monitor or writing on reflective paper surfaces. These results verify that the discomfort threshold for DGP values greater than 0.35, as established in earlier studies [1,2], also applies to the areas under investigation. Pearson correlation analysis was conducted using SPSS version 26. The statistical significance level was set at p 0.05, and 95 confidence intervals were calculated for all correlation coefficients. Overall correlation between measured and perceived glare was statistically significant (r = 0.63, p 0.05); sub-variable correlations are detailed below. Independent t-tests were performed to examine potential gender-related differences in gaze perception. Given the limited and unbalanced sample size (13 men and 8 women), these results are interpreted with caution and are considered informative rather than statistically definitive. No statistically significant differences in overall visual comfort scores were observed between male and female participants (p = 0.18), indicating that the observed changes should be interpreted as trends, not strong gender effects. Nonetheless, some qualitative variations were noted, particularly in spaces where users were used to extended exposure to glare. Even when the objective DGP was high, these subjects reported less discomfort. The annual DGP simulation results also verified that the majority of "unbearable" glare incidents happened in rooms facing southeast and southwest in the early morning hours of the winter season (November to February).
In addition to the qualitative agreement between the field measurements, user surveys, and simulation results, a quantitative comparison was conducted to evaluate the consistency between measured illuminance values and participants perceived visual comfort.
In explaining Figures 37, 38, 39, and 40, it is worth mentioning that one of the factors affecting visual comfort is the uniformity of lighting in the room, in order to prevent the creation of disturbing shadows and also reduce the feeling of fatigue and depression in people. To calculate the uniformity of lighting in a room, the level of illumination or illuminance should be measured at different points in the room at a fixed height, then the darkest point in the room is divided by the average brightness, and this value is a maximum of 1, which is the maximum level of light uniformity. For office space, it is better to consider this value between 0.6 and 0.65. In this office, the uniformity of lighting in none of the measured rooms was close to 0.6 or 0.65, and the maximum level of uniformity was measured in two rooms, 42B and 7B, with a value of 0.35. The blue line in the graph is the result of collecting opinions from people in the room about the uniformity of lighting in their room.
Figure 37
Fig. 37. Comparison between perceived and measured glare from a monitor screen.
Figure 38
Fig. 38. Comparison between perceived and measured glare from a desk.
Figure 39
Fig. 39. Average measured brightness in each room.
Figure 40
Fig. 40. Comparison of room lighting uniformity in two modes measured and perceived by individuals.
Further statistical analysis was conducted to assess the correlations between the main study variables:
- A direct correlation (r = 0.33) was observed between the measured DGP and perceived DGP from the monitor surface.
- An inverse correlation (r = 0.23) existed between the measured DGP and perceived DGP from the desk surface.
- Measured and perceived light uniformity (lights off) showed an inverse correlation (r = −0.10).
- Measured and perceived light uniformity (lights on) showed an inverse correlation (r = −0.01).
- Vertical illuminance at eye level (lights off) and perceived DGP from the monitor showed an inverse correlation (r = −0.07).
- Vertical illuminance at eye level (lights on) and perceived DGP from the monitor showed an inverse correlation (r = −0.07).
- Horizontal illuminance at the desk (lights off) and perceived DGP from the desk surface had a direct correlation (r = 0.31).
- Horizontal illuminance at the desk (lights on) and perceived DGP from the desk surface had a direct correlation (r = 0.27).
Among these, the strongest correlations were observed between measured DGP and perceived DGP from the monitor, and between horizontal illuminance (lights off) and perceived DGP from the desk surface, confirming that users’ subjective impressions align closely with objective measurements of glare.
The combined analysis shows that the main factors affecting the perception of glare and visual comfort are the orientation of the windows, the location of the workstation relative to them, and the presence of reflective surfaces. Although female participants reported slightly higher sensitivity to glare in some conditions, these differences were not statistically significant and should be interpreted with caution given the limited and uneven sample size. Therefore, the results indicate possible perceptual biases, not definitive gender-based differences. Lastly, the integration of all data sources demonstrates that, in the office environments under study, maintaining a vertical illuminance level below 600 lux at eye level and a horizontal illuminance level between 300 and 500 lux at the desk can offer the best possible balance between energy efficiency and visual comfort.
The lowest measured and simulated DGP values (below 0.30) were found in rooms-oriented northeast and northwest, as indicated in Table 7, suggesting good lighting and little glare all year long. On the other hand, rooms oriented southwest and southeast had higher DGP values, up to 0.45, particularly in the morning and afternoon when the room receives direct sunlight. These findings validate that the perception of glare is in line with the measured and simulated data and are in good agreement with the subjective evaluations of users. Thus, window orientation is crucial for visual comfort, and maintaining an ideal lighting balance in office settings requires managing direct sunlight with suitable shading and desk placement.
Table 7
Table 7. Comparison of measured, perceived, and simulated glare levels according to window orientation.
4. Discussion
The results of this study demonstrate the impact of context on window layout and user perception and access to daylight, and also highlight the fact that there is a trade-off between visual comfort and visual connection with users' tendency to avoid placing their desks directly next to full-height windows, even despite their desire to utilize natural light and exterior views. This pattern is consistent with recent studies showing that people typically prefer indirect daylight over direct sunlight exposure due to glare and screen reflection [1]. In this study, northeast- and southeast-facing windows showed the greatest differences in glare intensity based on desk orientation. The findings showed that depending on the orientation, desks that were perpendicular to the window created higher levels of glare. A study by Deitch et al. found similar results, showing that lateral viewing directions decreased perceived glare when compared to forward and window-facing directions [2]. This indicates the importance of desk orientation and user eye position, which determine visual comfort and should be considered when designing an office layout. Also, the low use of curtains, except in areas with a higher window-to-wall ratio, indicates the direct impact of excessive daylight penetration on occupant behaviour. Previous studies have shown that although employees value windows for psychological and physiological reasons, they often use blinds or curtains to reduce visual discomfort [3]. Advanced glazing technologies, such as electrochromic or translucent photovoltaic (STPV) glazing, can dynamically change luminance in these conditions, reducing the need for manual shading interventions [4,5]. The questionnaire results also suggested a tendency toward higher glare sensitivity among female participants; however, given the limited and unbalanced sample size, this observation should be interpreted with caution and does not support definitive gender-based differences in perceived visual comfort. This finding is consistent with psychophysical research showing that women often exhibit greater sensitivity to brightness contrast and visual fatigue, which is most likely a result of biological and perceptual factors influencing brightness tolerance [6]. Comparison of measured DGP values with values perceived by users confirmed a strong correlation between objective and subjective data, confirming the validity of HDR-based analyses and questionnaire-based assessments. A strong statistical correlation between daylight glare probability (DGP) and perceived discomfort has also been shown in controlled studies that integrated luminance mapping and user surveys [2].
The simulation results further emphasize the critical role of desk orientation and position in managing the annual glare potential. Annual DIVA-based analyses indicated that southeast-facing windows were more likely to experience significant or bothersome glare during morning hours, while northeast-facing windows caused temporary peaks in glare. These findings are supported by other studies that have shown similar temporal variations in DGP, particularly during months of low solar elevation. [7]. Furthermore, the pattern observed in this study is consistent with previous experimental findings reported in the literature. For example, field studies by [8] showed that real-world daylight measurements frequently diverge from simulation-only predictions, highlighting the necessity of validating simulation outputs with on-site measurements and user-related factors. Similarly, [9] emphasized that glare assessments based solely on simulation may misrepresent actual discomfort levels because users actively reposition desks or adjust blinds in response to brightness changes. A key implication of these results is the inherent trade-off between daylight availability and glare discomfort. Although more daylight enhances well-being, improves visual quality, and lessens reliance on artificial lighting, these advantages frequently come at the expense of greater glare and luminance contrast, especially in orientations exposed to low-angle sunlight. This duality has been extensively discussed in previous research, which shows that maximizing daylight does not necessarily maximize visual comfort [10,11]. This notion is supported by the current study, which shows that rooms in the northeast and northwest achieve a better balance between daylight sufficiency and visual comfort, while rooms in the southeast and southwest orientations, although providing high daylight availability, also show the highest glare risk.
From a design perspective, the difference in brightness between adjacent walls in rooms with corner windows indicates that the spatial distribution of daylight can lead to visual imbalance. Furthermore, recent optimization-based studies show that external perforated panels or light shelves can improve daylight uniformity and reduce glare by 60 [3,12].
Therefore, simultaneous implementation of passive daylight control elements can improve visual comfort and energy efficiency. In terms of window-to-wall ratio, this study found that a 20–40 WWR range provides the best balance between daylight adequacy and glare prevention. This finding confirms international research that glazing above 40 significantly increases DGP values, especially in hot or dry regions [1,13]. The findings also emphasize that by combining controlled artificial lighting with diffusers and appropriate facade proportions, uniformity can be increased and excessive contrast reduced. These findings also reinforce the importance of integrating quantitative simulation with user-based perception data to develop daylighting guidelines tailored to the climatic conditions of the Middle East. However, given the limited sample size and the specific nature of the study site, these findings should be interpreted as context-dependent observations, not as universally applicable design rules.
4.1. Design implications
The findings demonstrate several critical implications for daylight-responsive design:
- Desk placement is as important as window design. Perpendicular desk orientations significantly increase glare for southeast and southwest exposures.
- Full-height windows require careful sizing. In the case study, a range of 20–40 WWR was associated with a more balanced relationship between daylight access and tolerable DGP levels.
- It was observed that corner windows create strong lighting contrast and may reduce visual comfort if not supplemented with light diffusers or indirect artificial lighting.
- User behavior can serve as an indicator of discomfort. Limited use of curtains except in brightly lit rooms suggests that occupants are adapting their behavior in response to excessive lighting.
- In this case study, vertical illuminance levels above approximately 600 lux at eye level were most frequently associated with reported glare complaints, suggesting a specific reference threshold rather than a general limit.
4.2. Novelty of the Study
Rather than introducing a fundamentally new methodology, this study provides incremental and contextual insights into the existing body of daylighting and glare research. Instead, its contribution lies in the systematic combination of methods that have often been applied separately in previous studies, including field measurements, user-based visual comfort assessment, and daylight simulation. While multi-method approaches that combine field measurements, user perception surveys, HDR imaging, and daylight simulations have been used in previous studies, their application to real, occupied office environments in the Iranian climatic and cultural context remains limited. The innovation of this study lies mainly in the following:
- Application of an established multi-method framework to a real Iranian office environment, which allows for observation of real user behavior and adaptation strategies.
- Contextual interpretation of glare perception in relation to desk orientation and window placement in local climatic conditions.
- Cautious extraction of luminance ranges and window-to-wall ratios as indicative design references rather than global standards.
Accordingly, this study aims to complement existing research on glare by providing empirical observations that enrich the understanding of daylight-user interactions in hot and dry office environments in the Middle East.
4.3. Limitations and Future Work
The study is limited by the small sample size and constraints on continuous field measurements, especially given the dynamic nature of daylight. In particular, analyses related to gender were limited by the small and unbalanced groups of participants (13 men and 8 women), and therefore any observed differences should be considered exploratory rather than statistically robust. Additionally, the study did not account for dynamic sky conditions or the impact of seasonal user adaptation behaviors, which could influence long-term visual comfort evaluation. All offices could not be measured under identical sky conditions, and artificial lighting systems were not independently controllable by users. Future studies should incorporate:
- different façade systems and shading technologies,
- multiple climatic regions of Iran,
- larger and more diverse user groups, and
- advanced dynamic simulation tools calibrated with longitudinal measurements.
- Larger, more balanced samples to confirm initial observations.
Such future work can build on the present findings to develop evidence-based guidelines for designing glare-responsive and user-centered office spaces in similar climates. Future integration of physiological data such as pupil size variation or EEG-based responses to daylight conditions could further refine glare prediction models, bridging the gap between perceptual and physiological comfort metrics.
5. Conclusion
With an emphasis on the relationship between window placement, desk orientation, and user experience, the study examined how daylight affects visual comfort in office settings. By systematically combining field measurements, user perception surveys, and annual daylight simulations in real-world office environments in hot, dry climates, this study addresses a significant gap in research on daylight and glare—a field that has rarely been explored in previous studies that have focused primarily on simulations or laboratory settings in European and North American climates. None of the participants sat directly next to full-height corner windows, even though it was possible to move desks closer to them. Because of glare and reflections, users deliberately avoided positioning monitors directly across from windows in order to preserve a visual connection with the outdoors and take advantage of natural light. The delicate balance between the benefits of daylight and the requirement for visual comfort is highlighted by this behaviour. The results showed that more than 95 percent of workers relied on artificial light during the workday, although most workers preferred to have access to natural light. The measurement results showed that the light uniformity in all rooms was below the recommended range for office spaces (0.6-0.65), with the highest value being only 0.35. It should be noted that these measurements represent a specific time period and may not reflect the overall annual conditions. Increased reliance on artificial lighting and glare was caused by this lack of consistency, which decreased overall visual satisfaction. The validity of combining objective and subjective evaluations was validated by correlations between measured Daylight Glare Probability (DGP) and perceived glare. Desks positioned perpendicular to the window on the right side caused more glare in northeast-facing rooms, while desks positioned perpendicular to the window on the left side caused more issues in southeast-facing rooms, according to an annual daylight analysis. The association between desk placement, window orientation, and glare perception is supported by the fact that users in these positions expressed greater dissatisfaction with visual comfort. The study also demonstrated that full-height windows, which make up about 20–40% of the façade wall, efficiently supply natural light and preserve a visual connection to the outside, even though their corner placement can produce a stark contrast with nearby walls. This contrast can be lessened by artificial lighting, but poor design could add more glare sources. Several design suggestions are made in light of these findings: To reduce glare on monitors, desks should be positioned away from windows. For daylight access while preserving a visual connection with the outside, window-to-facade ratios of 20–40% are suitable. Diffusers or indirect systems should be used in artificial lighting to lessen glare and enhance visual comfort. To anticipate glare and optimize desk layouts, early use of 3D modelling and daylight evaluation software is advised. Last but not least, restrictions like the small sample size, limited access to all offices, and measurement limitations point to the need for more research using larger samples, a variety of facade configurations, and sophisticated simulation tools. By putting these strategies into practice, office buildings can improve occupant satisfaction, visual comfort, and energy efficiency while developing guidelines for daylight-responsive workspace design. The results of this study design are intended to inform initial decision-making rather than prescribe definitive performance thresholds and should be validated through further studies with larger and more diverse samples.
It should be emphasized that the findings of this study are based on a limited sample of departments and participants and should therefore be interpreted as context-specific findings, not as findings that can be generalized universally. Also, statistical analyses were used to identify trends and meaningful relationships within the study setting, not to draw definitive causal or population-level conclusions. Accordingly, conclusions about the annual radiation behavior are based on simulation results, while field measurements are interpreted as short-term, field-specific observations.
Funding
This research received no external funding.
Acknowledgement
During the preparation of this work, the authors used ChatGPT in order to enhance the clarity, coherence, and overall language quality of the manuscript. The content was subsequently reviewed and revised by the authors, who take full responsibility for the final version of the publication.
Author Contributions
M. Karimimoshaver: Conceptualization, Methodology, Investigation, Formal analysis, Writing – original draft, Supervision. F. Derakhshan: Software, Validation, Data curation, Visualization, Writing – review & editing.
Declaration of competing interest
The authors declared no potential conflicts of interest with respect to the research, authorship, and/or publication of this article.
References
- M.S. Cengiz, Use of Daylight in Houses and Villas from Modern Architectural Buildings, Avrupa Bilim ve Teknoloji Dergisi, 38 (2022) 247-258.
- M. Boubekri, et al., Impact of windows and daylight exposure on overall health and sleep quality of office workers: a case-control pilot study, J Clin Sleep Med, 10:6 (2014) 603-611. https://doi.org/10.5664/jcsm.3780
- M. Woo, et al., Access to Daylight and Views Improves Physical and Emotional Wellbeing of Office Workers: A Crossover Study, Frontiers in Sustainable Cities, 3 (2021).= https://doi.org/10.3389/frsc.2021.690055
- H.A. Hashaykeh, Evaluation of LEED Interior Design Environment to Improve the Indoor Environmental Quality Through Enhancing Lighting Parameters of UAE Campus Buildings, PhD thesis, The British University in Dubai, 2023.
- N. Nasrollahi, E. Shokry, Parametric Analysis of Architectural Elements on Daylight, Visual Comfort, and Electrical Energy Performance in the Study Spaces, Journal of Daylighting, 7 (2020) 57-72. https://doi.org/10.15627/jd.2020.5
- X. Qiu, M. Gong, A. Kaboorani, A Case Study on the Energy Efficiency of Windows in Institutional and Residential Buildings, Buildings, 15:19 (2025) 3478. https://doi.org/10.3390/buildings15193478
- A. Jamrozik, et al., Access to daylight and view in an office improves cognitive performance and satisfaction and reduces eyestrain: A controlled crossover study, Building and Environment, 165 (2019) 106379. https://doi.org/10.1016/j.buildenv.2019.106379
- M.R. Hasan, M.H. Sobuz, V. Tam, Impact assessment of window to wall ratio on energy consumption of an office building of subtropical monsoon climatic country Bangladesh, International Journal of Construction Management, 22 (2020) 1-26. https://doi.org/10.1080/15623599.2020.1808561
- M. Amirkhani, et al., An Energy Efficient Lighting Design Strategy to Enhance Visual Comfort in Offices with Windows, Energies, 10:8 (2017) 1126. https://doi.org/10.3390/en10081126
- A. Al-Ghaili, et al., A Review: Buildings Energy Savings -Lighting Systems Performance, IEEE Access, 8 (2020) 76108-76119. https://doi.org/10.1109/ACCESS.2020.2989237
- S. Sayadi, A. Hayati, M. Salmanzadeh, Optimization of Window-to-Wall Ratio for Buildings Located in Different Climates: An IDA-Indoor Climate and Energy Simulation Study, Energies, 14:7 (2021) 1974. https://doi.org/10.3390/en14071974
- J. Wienold, J. Christoffersen, Evaluation methods and development of a new glare prediction model for daylight environments with the use of CCD cameras, Energy and Buildings, 38:7 (2006) 743-757. https://doi.org/10.1016/j.enbuild.2006.03.017
- M. Kwon, H. Remøy, M. van den Bogaard, Influential design factors on occupant satisfaction with indoor environment in workplaces, Building and Environment, 157 (2019) 356-365. https://doi.org/10.1016/j.buildenv.2019.05.002
- K. Chaloeytoy, M. Ichinose, S.-C. Chien, Determination of the Simplified Daylight Glare Probability (DGPs) Criteria for Daylit Office Spaces in Thailand, Buildings, 10:10 (2020) 180. https://doi.org/10.3390/buildings10100180
- L. Bellia, F. Fragliasso, E. Stefanizzi, Daylit offices: A comparison between measured parameters assessing light quality and users' opinions, Building and Environment, 113 (2016). https://doi.org/10.1016/j.buildenv.2016.08.014
- M. Frontczak, et al., Quantitative relationships between occupant satisfaction and satisfaction aspects of indoor environmental quality and building design, Indoor Air, 22:2 (2012) 119-131. https://doi.org/10.1111/j.1600-0668.2011.00745.x
- M. Kwon, Impact of design factors on user satisfaction, A+BE | Architecture and the Built Environment, 10:01 (2020) 134-177. https://doi.org/10.59490/ABE.2020.15.4451
- I. Konstantzos, Daylight Glare Probability measurements and correlation with indoor illuminance in a full-scale office with dynamic shading controls, Master's thesis, 2014.
- M. Ayoosu, et al., Daylighting Evaluation and Optimisation of Window to Wall Ratio for Lecture Theatre in the Tropical Climate, Journal of Daylighting, 8 (2021) 20-35. https://doi.org/10.15627/jd.2021.2
- J.M. Monteoliva, J. Garretón, A. Pattini, Comparative Investigation of Daylight Glare Probability (DGP) Comfort Classes in Clear Sky Condition, Journal of Daylighting, 8 (2021) 284-293. https://doi.org/10.15627/jd.2021.22
- W.N.H. Wan Abdullah, et al., Identifying Optimal Window-to-Wall Ratio (WWR) and Window-to-Floor Ratio (WFR) for Typical Higher Educational Classrooms to Address Deficiencies in Daylighting Design, Malaysian Journal of Sustainable Environment, 12:2 (2025) 81-102. https://doi.org/10.24191/myse.v12i2.7059
- O. Dewi, et al., Window-to-Wall Ratio as a Mode of Daylight Optimization for an Educational Building with Opaque Double-Skin Façade, Journal of Sustainable Architecture and Civil Engineering, 30 (2022) 142-152. https://doi.org/10.5755/j01.sace.30.1.29744
- A. Borisuit, et al., Effects of realistic office daylighting and electric lighting conditions on visual comfort, alertness and mood, Lighting Research and Technology, 47 (2014) 192-209. https://doi.org/10.1177/1477153514531518
- A. Ghalehnovi, H. Kamelnia, Enhancing Daylight Performance and Visual Comfort in Office Buildings with Electrochromic Glazing: A Case Study Mashhad, Iranian Journal of Energy and Environment, (2024).
- J. Xue, et al., Improving Visual Comfort and Health through the Design of a Local Shading Device, International Journal of Environmental Research and Public Health, 19:7 (2022) 4406. https://doi.org/10.3390/ijerph19074406
- S. Rossi, et al., Influence of lighting on visual performance, Arq Bras Oftalmol, 87:3 (2024) e20230257.
- O. Overen, E. Meyer, G. Makaka, Daylighting Assessment of a Heritage Place of Instruction and Office Building in Alice, South Africa, Buildings, 13 (2023) 1-21. https://doi.org/10.3390/buildings13081932
- J. Mardaljevic, Simulation of annual daylighting profiles for internal illuminance, International Journal of Lighting Research and Technology, 32:3 (2000) 111-118. https://doi.org/10.1177/096032710003200302
- S. Daich, et al., A Combined Method for an Exhaustive Investigation of the Anidolic Ceiling Effect on Improving Indoor Office Daylight Quality: an Approach Based on HDR Photography and Subjective Evaluations, Journal of Daylighting, 8 (2021) 149-164. https://doi.org/10.15627/jd.2021.14
- F. Rezaei, et al., A Multi-objective Optimization of Window and Light Shelf Design in Office Buildings to Improve Occupants' Thermal and Visual Comfort, Lighting Research & Technology, 11 (2024) 55-68. https://doi.org/10.15627/jd.2024.4
- A. Zarrabi, et al., Comparative Study of Different Design Configurations Based on the Daylight and Visual Comfort Performance of Electrochromic Glass in a Side-lit Office Building, (2018). https://doi.org/10.14305/ibpc.2018.ie-3.02
- A. Mesloub, et al., Energy and Daylighting Evaluation of Integrated Semitransparent Photovoltaic Windows with Internal Light Shelves in Open-Office Buildings, Advances in Civil Engineering, (2020) 21. https://doi.org/10.1155/2020/8867558
- Z. Hamedani, Visual Discomfort Assessment in Office Environments: Light-induced Physiological Responses and Visual Performance, PhD thesis, 2019. https://doi.org/10.1016/j.buildenv.2019.02.035
- V. Mathew, C. Kurian, N. Augustine, Optimizing Daylight Glare and Circadian Entrainment in a Daylight-Artificial Light Integrated Scheme, IEEE Access, 10 (2022). https://doi.org/10.1109/ACCESS.2022.3165023
- J. Jakubiec, C. Reinhart, The 'adaptive zone' - A concept for assessing discomfort glare throughout daylit spaces, Lighting Research and Technology, 44 (2012) 149-170. https://doi.org/10.1177/1477153511420097
- A. Nabil, J. Mardaljevic, Useful daylight illuminances: A replacement for daylight factors, Energy and Buildings, 38:7 (2006) 905-913. https://doi.org/10.1016/j.enbuild.2006.03.013
- I. Konstantzos, Y.-C. Chan, Experimental and simulation analysis of daylight glare probability in offices with dynamic window shades, Building and Environment, 87 (2015). https://doi.org/10.1016/j.buildenv.2015.02.007
- C. Lavin, F. Fiorito, Optimization of an External Perforated Screen for Improved Daylighting and Thermal Performance of an Office Space, Procedia Engineering, 180 (2017) 571-581. https://doi.org/10.1016/j.proeng.2017.04.216
- M. Hosseini, et al., Quantitative Investigation Through Climate-based Daylight Metrics of Visual Comfort Due to Colorful Glass and Orosi Windows in Iranian Architecture, Journal of Daylighting, 5 (2018) 21-33. https://doi.org/10.15627/jd.2018.5
2383-8701/© 2026 The Author(s). Published by solarlits.com. This is an open access article distributed under the terms and conditions of the Creative Commons Attribution 4.0 License.

2403
Total views
Citations
SHARE ON


