Article | 7 May 2026
Volume 13 Issue 1 pp. 227-252 • doi: 10.15627/jd.2026.13
Horizontal Light Pipe System for Daylight Optimization in Deep-Plan Library Spaces in a Tropical Climate
Ridwan Noor,* Md Ashikur Rahman Joarder
Author affiliations
Department of Architecture, Bangladesh University of Engineering and Technology (BUET), Dhaka, Bangladesh
*Corresponding author.
ridwannoor@arch.buet.ac.bd (R. Noor)
ashikjoarder@arch.buet.ac.bd (Md. A. R. Joarder)
History: Received 15 March 2026 | Revised 5 April 2026 | Accepted 13 April 2026 | Published online 7 May 2026
2383-8701/© 2026 The Author(s). Published by solarlits.com. This is an open access article distributed under the terms and conditions of the Creative Commons Attribution 4.0 License.
Citation: Ridwan Noor, Md Ashikur Rahman Joarder, Horizontal Light Pipe System for Daylight Optimization in Deep-Plan Library Spaces in a Tropical Climate, Journal of Daylighting, 13:1 (2026) 227-252. doi: 10.15627/jd.2026.13
Figures and tables
Abstract
Deep-plan spaces, such as a library reading area, typically suffer from poor daylight penetration to the core, which reduces visual comfort and increases dependence on artificial lighting. Horizontal Light Pipes (HLPs) are passive daylighting systems that capture daylight through an inlet, transport it through a reflective pipe, and distribute it into the interior. This research examines the performance of HLPs in the second-floor reading room of a university’s Central Library, a typical institutional building in a tropical climate. Field measurements of illuminance were conducted to document existing conditions and later used to validate ClimateStudio simulation results. A Rhino and Grasshopper parametric workflow defined six HLP geometry variables and generated different HLP configurations for ClimateStudio analysis. Multi-objective optimization was performed using the Octopus plug-in to identify the most effective solutions, evaluating 1,100 genomes. Data export and organization were managed through the TT toolbox, and results were analyzed using statistical methods and cross-checked with Design Explorer. Performance was evaluated using daylighting and energy metrics such as mean illuminance, spatial daylight autonomy (sDA300/50%), annual sunlight exposure (ASE1000,250h), and energy use intensity (EUI). Compared with the base case with mean illuminance 393 lux, sDA300/50% of 38.4%, ASE1000,250h of 3.4%, EUI of 83.17 kWh/(m2y), HLP integrated optimized models achieved mean illuminance 760~880 lux with sDA300/50% of 77.33~80.12%, ASE1000,250h of 0.62~0.93% and EUI 71.02~71.13 kWh/(m2y), showing significant improvement over the base case. These results suggest that HLPs can provide better daylight distribution and reduce energy usage in deep-plan libraries. According to the study, HLPs have the potential to be a practical strategy for improving daylight performance in tropical academic buildings.
Keywords
horizontal light pipe, daylighting, multi-objective optimization, tropical climate, deep-plan space
1. Introduction
Daylight is a fundamental component of building design, contributing to energy efficiency, visual comfort, and occupant well-being. Beyond energy savings, daylight provides substantial non-energy benefits, including psychological stimulation and enhanced occupant health [1]. Although tropical climates receive ample daylight, the intensity and fluctuations of sunlight cause unpredictable indoor illuminance and visual discomfort, particularly in deep-plan layouts where daylight must travel farther from perimeter windows [2,3]. Conventional side-lit windows typically illuminate spaces up to about twice the window lintel height, often leaving interior core areas underlit in deep-plan spaces [4].
Horizontal Light Pipe (HLP) is an optical daylighting system designed to deliver daylight to areas distant from building perimeters in deep-plan buildings [5]. It is one of the main daylighting systems that can transport daylight into the deep interior [6-9]. An HLP system comprises three key components: an aperture or inlet, a reflector, and an outlet or opening distribution [10]. Unlike vertical light pipes, which require roof-level access and large shafts, HLPs can be routed through the plenum of each floor, making them feasible for deep-plan or multi-storey buildings [11,12]. Previous research mainly focused on improving the daylight performance of HLP and its reliability in enhancing daylight levels and uniformity in areas distant from the building perimeter [11].
Despite these advances, most HLP studies have tested systems using fixed or predefined parameters such as aperture size, pipe length, or reflector type [11-13]. These assumptions limit adaptability to local climate variations and prevent systematic exploration of optimal configurations. Climate-responsive configuration optimization for HLPs has received little attention in major studies, indicating a substantial research gap in this domain. In contrast, related studies on other daylight guidance systems, such as anidolic ceilings, have demonstrated that multi-objective optimization (MOO) can effectively balance daylight availability, glare risk, and energy efficiency [14,15].
This study addresses the lack of climate-responsive optimization of HLP systems, despite their strong potential as a daylighting strategy in tropical environments. The central aim of this paper is to investigate an optimization process of HLPs for daylighting and energy performance at the early design stage in a tropical deep-plan library. University library reading rooms are particularly appropriate for daylighting research for several interrelated reasons. First, libraries are among the most energy-intensive building types on academic campuses, with average annual energy use reaching up to 490 kWh/m2, making them among the highest-consuming academic facilities [16]. Lighting accounts for a dominant share of this energy demand, as library reading areas require continuous, high-quality illumination throughout extended daily occupancy hours to support sustained visual tasks such as reading and research [17]. Second, the reading room environment is particularly sensitive to daylight quality: adequate, evenly distributed lighting directly affects users' visual comfort, task performance, and psychological well-being [18]. For these reasons, a university library reading room was selected as the building type to investigate the optimization potential of the HLP system in a tropical climate. To achieve this, MOO techniques are applied to identify system configurations that enhance daylight penetration and uniformity while simultaneously reducing reliance on artificial lighting and overall energy demand. These improvements may also help lower energy use intensity, support a sustainable built environment, and align with global net-zero targets.
In this research, field measurements were conducted in the second-floor reading room of the Bangladesh University of Engineering and Technology (BUET) Central Library, Dhaka, Bangladesh, serving as a reference for developing a base model for daylighting and energy performance simulations using Rhinoceros, Grasshopper, and ClimateStudio. This base model is then modified with test cases incorporating different HLP configurations, which are parametrically modeled in Grasshopper. MOO is performed through the Octopus plug-in to identify the most effective system solutions. The evaluation considers daylighting metrics such as illuminance, spatial daylight autonomy (sDA300/50%), and annual sunlight exposure (ASE1000,250h), along with energy performance metrics such as energy use intensity (EUI). Simulation results are validated against field-measurement data to ensure accuracy, and the findings are used to establish optimized HLP configurations for deep-plan libraries in tropical contexts.
2. Background
2.1. Daylighting potential of horizontal light pipe systems
The potential for daylight utilization in the tropics is high, as daylight is abundant due to high solar intensity and long daylight hours [19]. Deep-plan building designs limit daylight penetration into spaces located far from side windows [20,21]. To overcome this limitation, a core daylighting system is required to channel daylight into the building’s interior areas [22]. One such system is the HLP, which has proven effective in channeling daylight deeper into interior spaces [23]. HLP works by collecting and redirecting daylight through an aperture located at the building facade, transporting it via a reflective pipe, and distributing it indoors through opening distributions [24].
Several strategies have been explored to improve the daylight performance of HLPs. These include the use of static and tiltable mirrors, central and side reflectors, trapezoidal shapes in plan, laser-cut panels, and flat captation systems [24]. Further improvements were achieved by integrating HLPs with optical light shelves, thereby improving daylight uniformity across the room. In this approach, seven different light shelf angle configurations were simulated using the integrated environment solution virtual environment [25]. Another study focused on the shape of an HLP transporter and the number of extractor openings to improve illumination in a deep, open-plan, high-rise office building in a tropical climate. The semicircular transporter with two openings, which had 14% less surface area than a conventional rectangular transporter, demonstrated the best overall performance, both quantitatively and qualitatively, among the studied configurations [12]. Collectively, these studies have verified the reliability of HLP in improving daylight levels and uniformity in areas distant from the building perimeter. Only one study has proposed a dynamic reflector model within an HLP to respond to changes in the sun angle [13]. The results showed that dynamic reflector modification could increase illuminance levels by up to 29.9%, daylight factor values by up to 29.2%, and uniformity ratios by up to 33.3%. Nevertheless, existing studies have not examined multiple parameters of horizontal light pipe systems simultaneously. Further investigations are therefore required to examine how variations in inlet or aperture dimensions, outlet or distribution opening geometry, and reflector curvature profile, together with their overall configurations, collectively affect the daylighting performance of HLPs.
2.2. Multi-objective optimization for building daylighting performance
In the field of building performance simulation, various optimization approaches have been applied to address single and multi-objective problems [26]. Optimization is the way towards finding the minimum or maximum value of a function by selecting appropriate variables within defined constraints [27]. MOO frameworks commonly use Rhinoceros and Grasshopper for parametric modeling, with Octopus or evolutionary algorithms, such as the non-dominated sorting genetic algorithm II (NSGA-II), applied to search for optimal solutions [28]. Applications of MOO in daylighting research are well documented. Ziaee and Vakilinezhad [29] optimized classroom light-shelf systems using Octopus. They considered four parameters of the light-shelf, including shelf height, exterior length, interior length, and interior angle, and showed that optimized solutions balanced illuminance and glare more effectively than fixed designs. Bahdad et al. [26] applied multi-objective optimization using a genetic algorithm to optimize controllable light-shelf parameters in Malaysian office buildings, improving both daylight distribution and energy savings. Kirimtat et al. [30] used NSGA-II and a self-adaptive continuous genetic algorithm with differential evolution to optimize amorphous facade shading panels, demonstrating the adaptability of MOO beyond conventional daylight devices.
In tropical climates, Sorooshnia et al. [28] used MOO to optimize anidolic daylighting systems, balancing daylight factor, thermal comfort, and energy demand in Sydney dwellings. Similarly, De Luca and Wortmann [14] applied MOO to retrofit the Tallinn University of Technology assembly hall, maximizing daylight availability while minimizing total energy use. Most of the analyzed solutions achieved sufficient daylight without additional energy demand. These examples highlight that MOO not only identifies high-performing solutions but also provides a rational framework for design decisions at early stages. Since a horizontal light pipe system is defined by interdependent components such as the reflector, inlet, and outlet, its performance is highly sensitive to their dimensions and configurations, making it a suitable candidate for MOO-based optimization in future research.
2.3. Existing research gap
Previous studies on HLPs have demonstrated their potential to improve daylight penetration and uniformity in deep-plan buildings through strategies such as modified transporters, egg-crate reflectors, light shelf integration, and dynamic reflector systems [11-13, 24,25]. Table 1 provides an overview of these and related daylighting optimization studies. A systematic review of this literature reveals three specific gaps that this study addresses.
Table 1
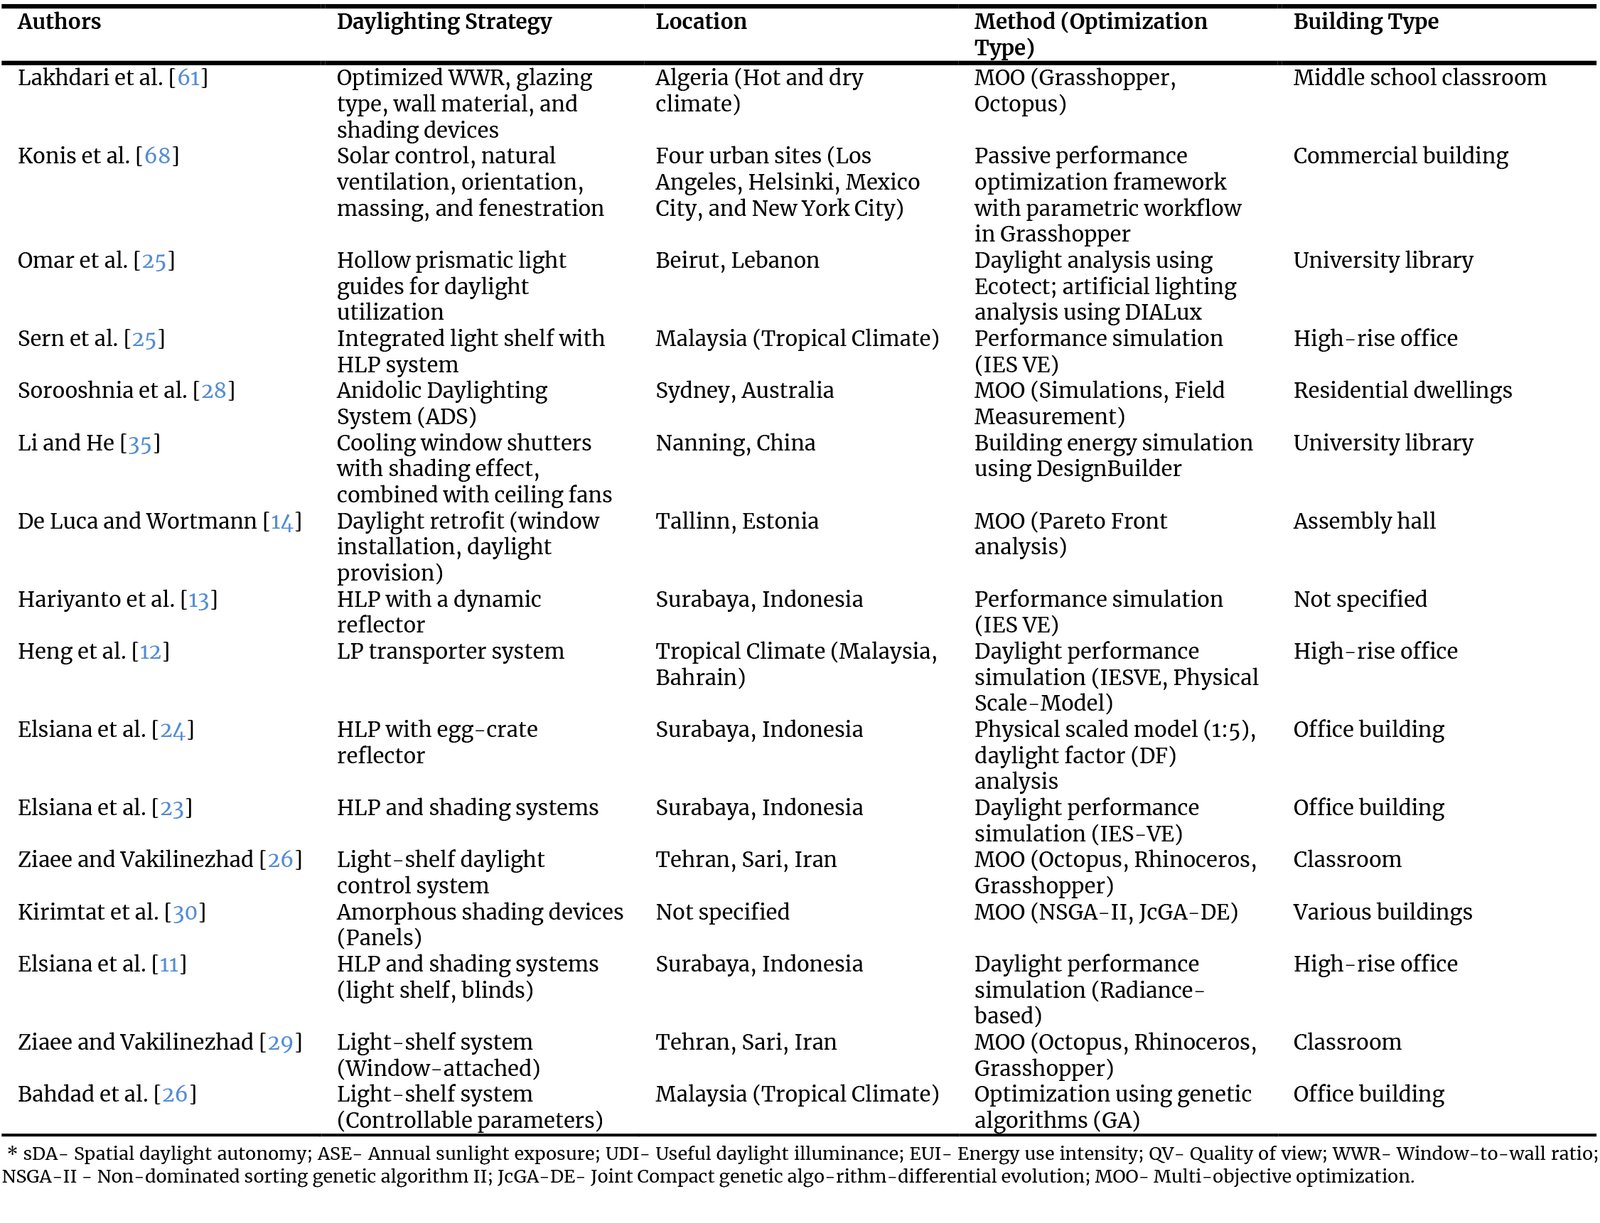
Table 1. Previous research on passive daylighting strategies.
First, all previous HLP studies focused on predefined or individually varied parameters, meaning each study changed one or a few design elements in isolation rather than varying multiple system parameters simultaneously. Elsiana et al. [24] tested a single egg-crate reflector configuration at the HLP's opening distribution, finding improvements in daylight factor of 16.6–56.6%, but did not vary aperture geometry, inlet angle, or reflector curvature. Elsiana et al. [11] examined the integration of HLP with shading systems (light shelf and blinds) using predefined HLP configurations without changing the HLP's own parameters. Heng et al. [12] compared nine LP transporter cross-section shapes but kept the collector, length, and outlet configuration constant. Hariyanto et al. [13] studied a single dynamic change in reflector tilt angle in isolation. Sern et al. [25] integrated a fixed HLP with seven light-shelf angle configurations. In all of these studies, the components of the HLP system, such as the inlet, pipe, and outlet, were not co-optimized. As a result, interactions and trade-offs among various HLP parameters have never been thoroughly examined.
Second, no previous HLP study has used multi-objective optimization (MOO) to explore the design space of HLP parameters across four performance metrics: mean illuminance, sDA, ASE, and EUI. MOO has been successfully applied to other daylighting systems, including light shelves [26,29], anidolic ceilings [28], and building envelope configurations [14], demonstrating that it can identify configurations that improve daylight quality while reducing energy consumption and glare risk. The lack of MOO in HLP research means that the Pareto-optimal trade-off space for an HLP system between daylight availability (sDA), glare risk (ASE), and energy performance (EUI) has never been characterized. This is a substantial gap: a designer choosing an HLP setup has no solid evidence to understand the geometric trade-offs involved in optimizing all three objectives together.
Third, all previous HLP studies assessed performance using static metrics such as Daylight Factor (DF), illuminance, or the illuminance uniformity ratio, rather than the climate-based annual metrics sDA and ASE, which are currently the most widely accepted standards for daylighting evaluation in LEED v4.1 and IES LM-83 [31-33]. Relying on DF and point-in-time illuminance does not reflect annual daylight availability or the frequency and extent of glare-risk conditions, making it inadequate for a full assessment of daylighting performance or for demonstrating LEED compliance. No existing HLP study has evaluated optimized HLP configurations using sDA, ASE, and EUI together. This study fills all three gaps by being the first to vary six HLP geometric parameters simultaneously within an MOO framework, analyze 1,100 genomes, and assess performance using sDA, ASE, and EUI in a tropical institutional building.
3. Methodology
A parametric approach was adopted to optimize the HLP system for a deep-plan library space, focusing on daylighting performance and energy efficiency.
The second-floor reading room of the BUET Central Library was selected as the base case space, because it represents a frequently occupied academic reading environment where prolonged visual tasks demand adequate daylight, uniform light distribution, and limited glare [34]. Such library spaces are also important for energy-focused daylighting research, as insufficient daylight in deeper zones increases reliance on artificial lighting, and long operating hours and cooling requirements raise overall operational energy use in tropical climates [35]. The HLP system consists of an inlet or aperture, a pipe, and an outlet or distribution opening. For this study, parameters such as inlet length, inlet angle, outlet opening percentage, the horizontal distance of the curve end point (ye), the horizontal distance of the curve center point (yc), and the vertical distance of the curve center point (zc) were chosen as the main variables for optimization. The multi-objective optimization process was executed using the Octopus plug-in for Grasshopper in Rhinoceros, enabling parametric control throughout the whole process.
There were four primary parts to the research process: (1) field study, (2) development of the base and HLP-integrated test models, followed by the base model's validation, (3) MOO aimed at optimizing daylight and energy performance, and (4) assessing the top-performing optimized test models with Design Explorer, Pareto Front, and fitness function. Field measurements of daylight illuminance were first recorded in the base library space. These data were used to validate the simulation model and to establish the base condition's performance. The validated model was then used to test different HLP configurations. The optimization process followed these steps to identify the most feasible HLP configurations to improve daylight distribution and reduce energy demand in the reading space. Fig. 1 shows the step-by-step flow diagram of the simulation, optimization, and data visualization workflow used in the research.
Figure 1
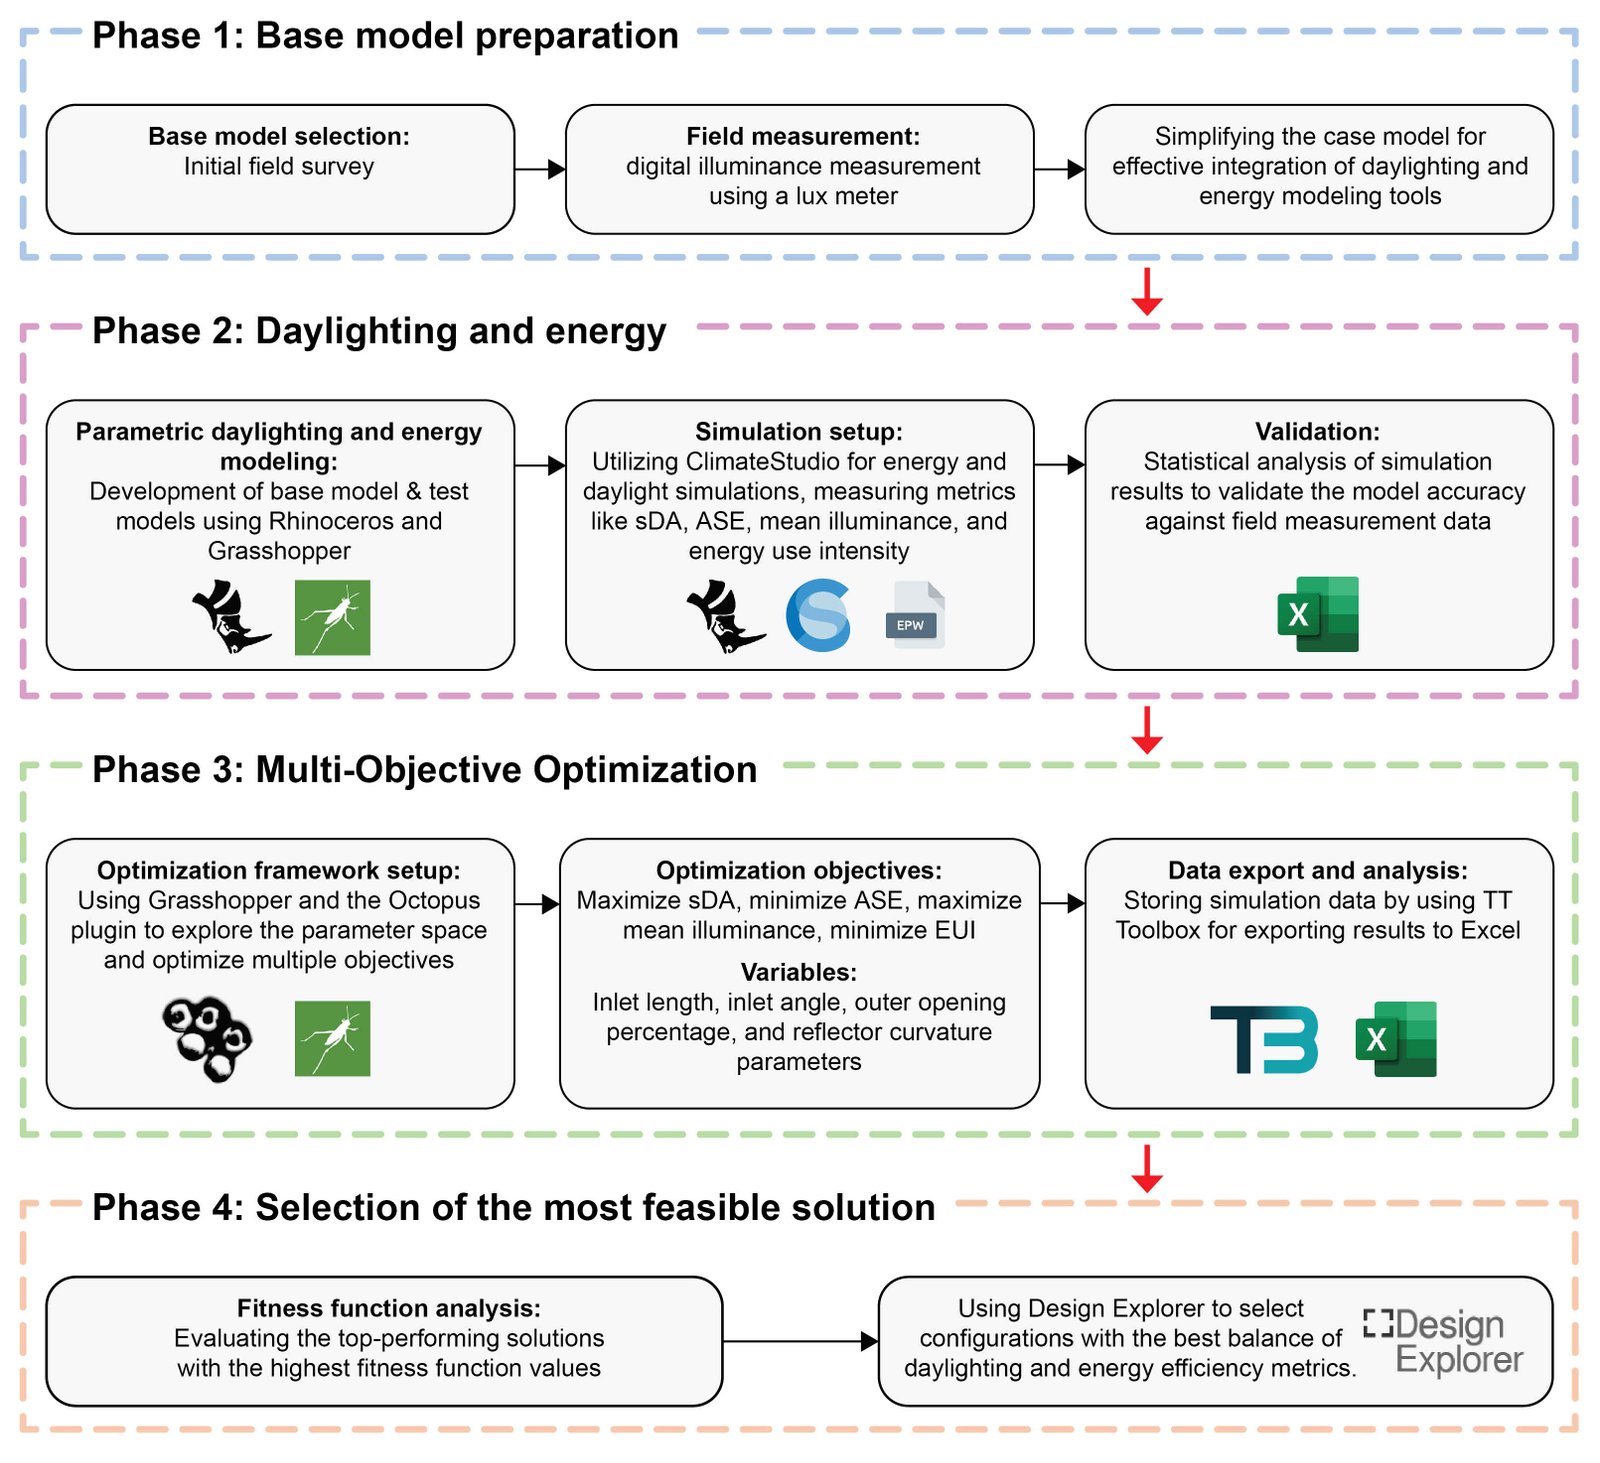
Fig. 1. Step-by-step flow diagram of research methodology.
3.1. Field study
The selected library space for this study, shown in Fig. 2, is 32 m long and 18 m wide. It is located on the second floor of the BUET Central Library, which is a five-storied institutional building with a total floor area of approximately 2322 m2. The library’s south facade receives the primary daylight, featuring horizontal shading devices and recessed windows that reduce direct solar penetration. On the other hand, the north facade serves as the main entrance and remains mostly shaded throughout the day by the surrounding vegetation. The schematic cross-section of the reading room with sensor grid points is shown in Fig. 3.
Figure 2
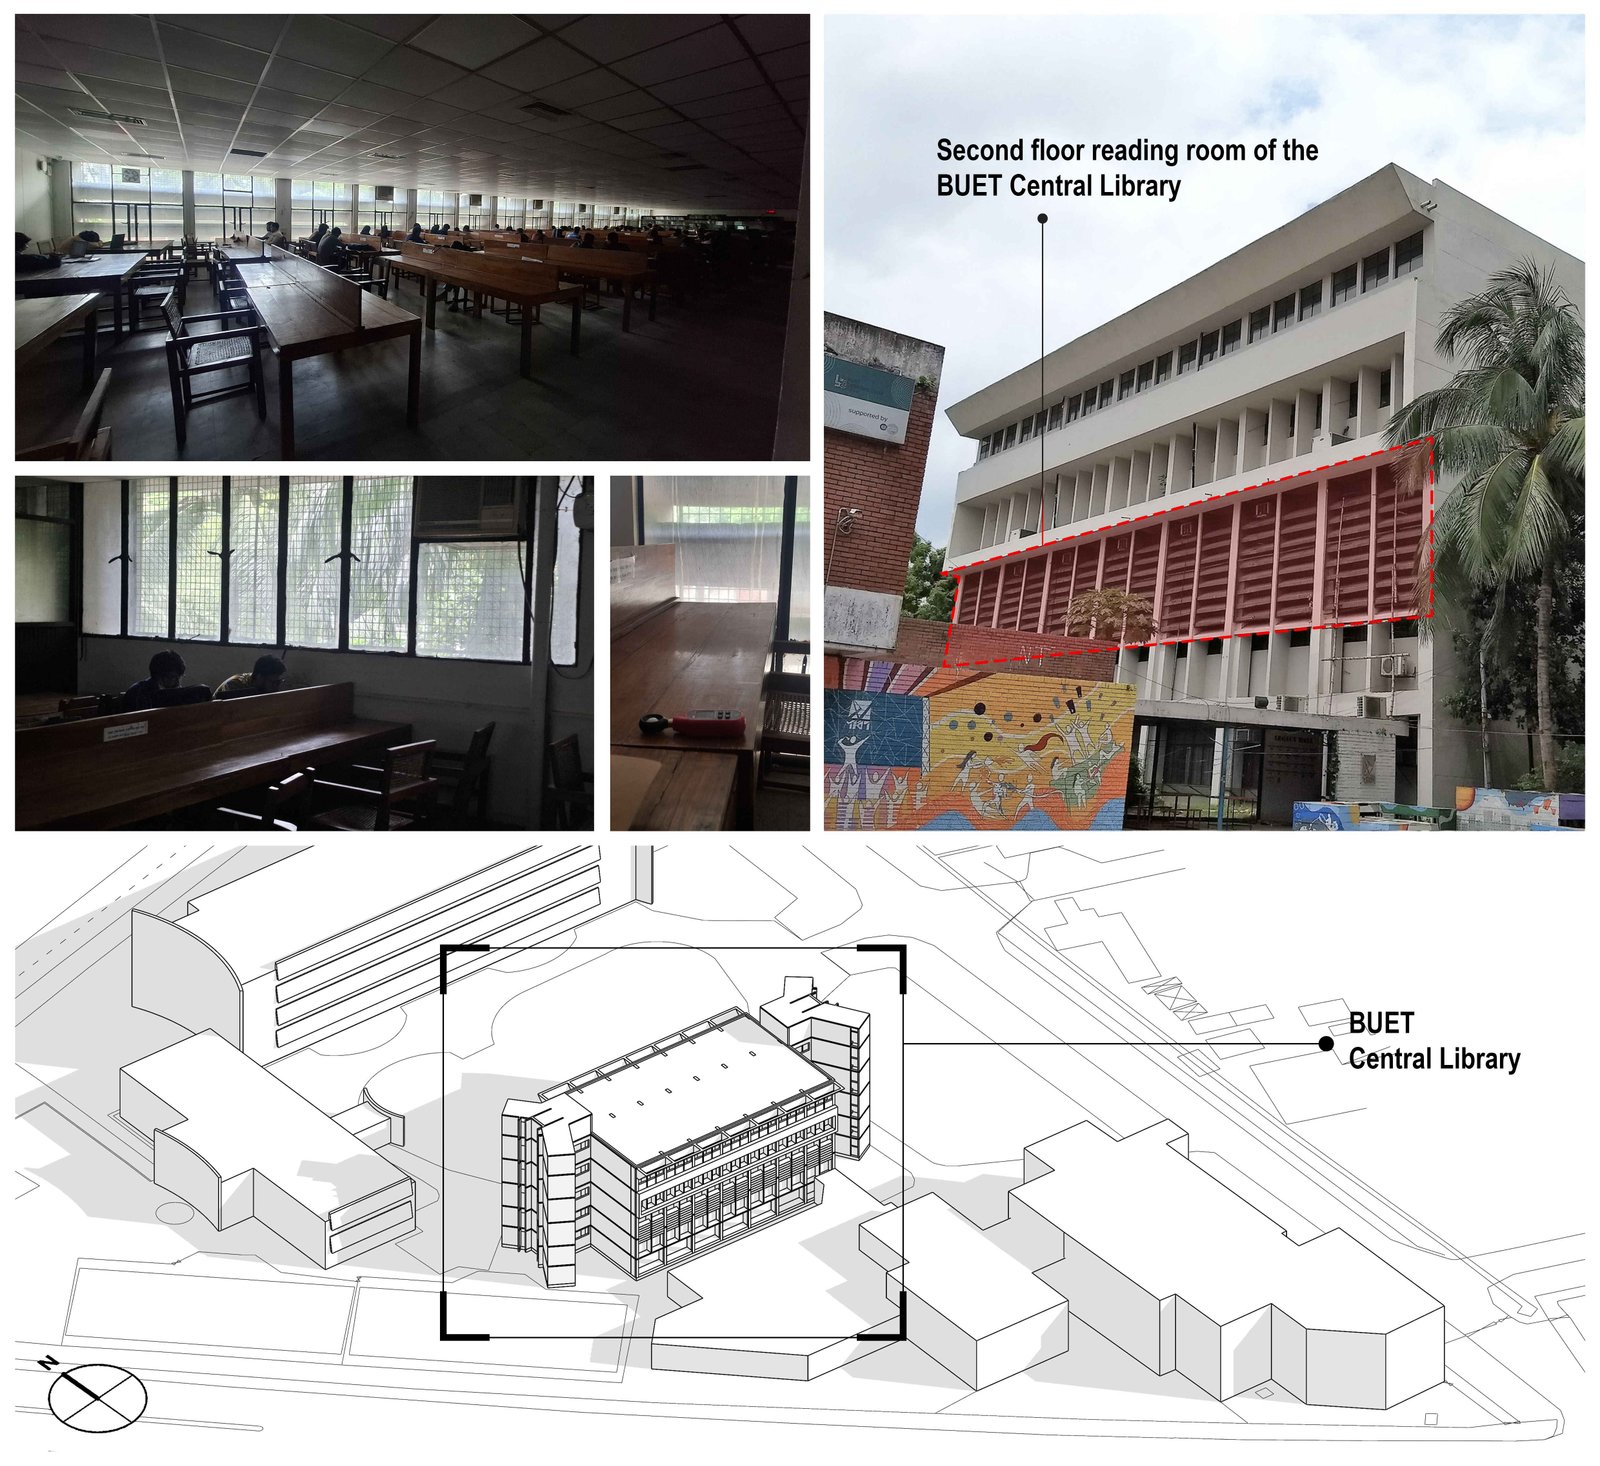
Fig. 2. BUET Central Library: Second-floor reading room as the case library space for base model development.
Figure 3
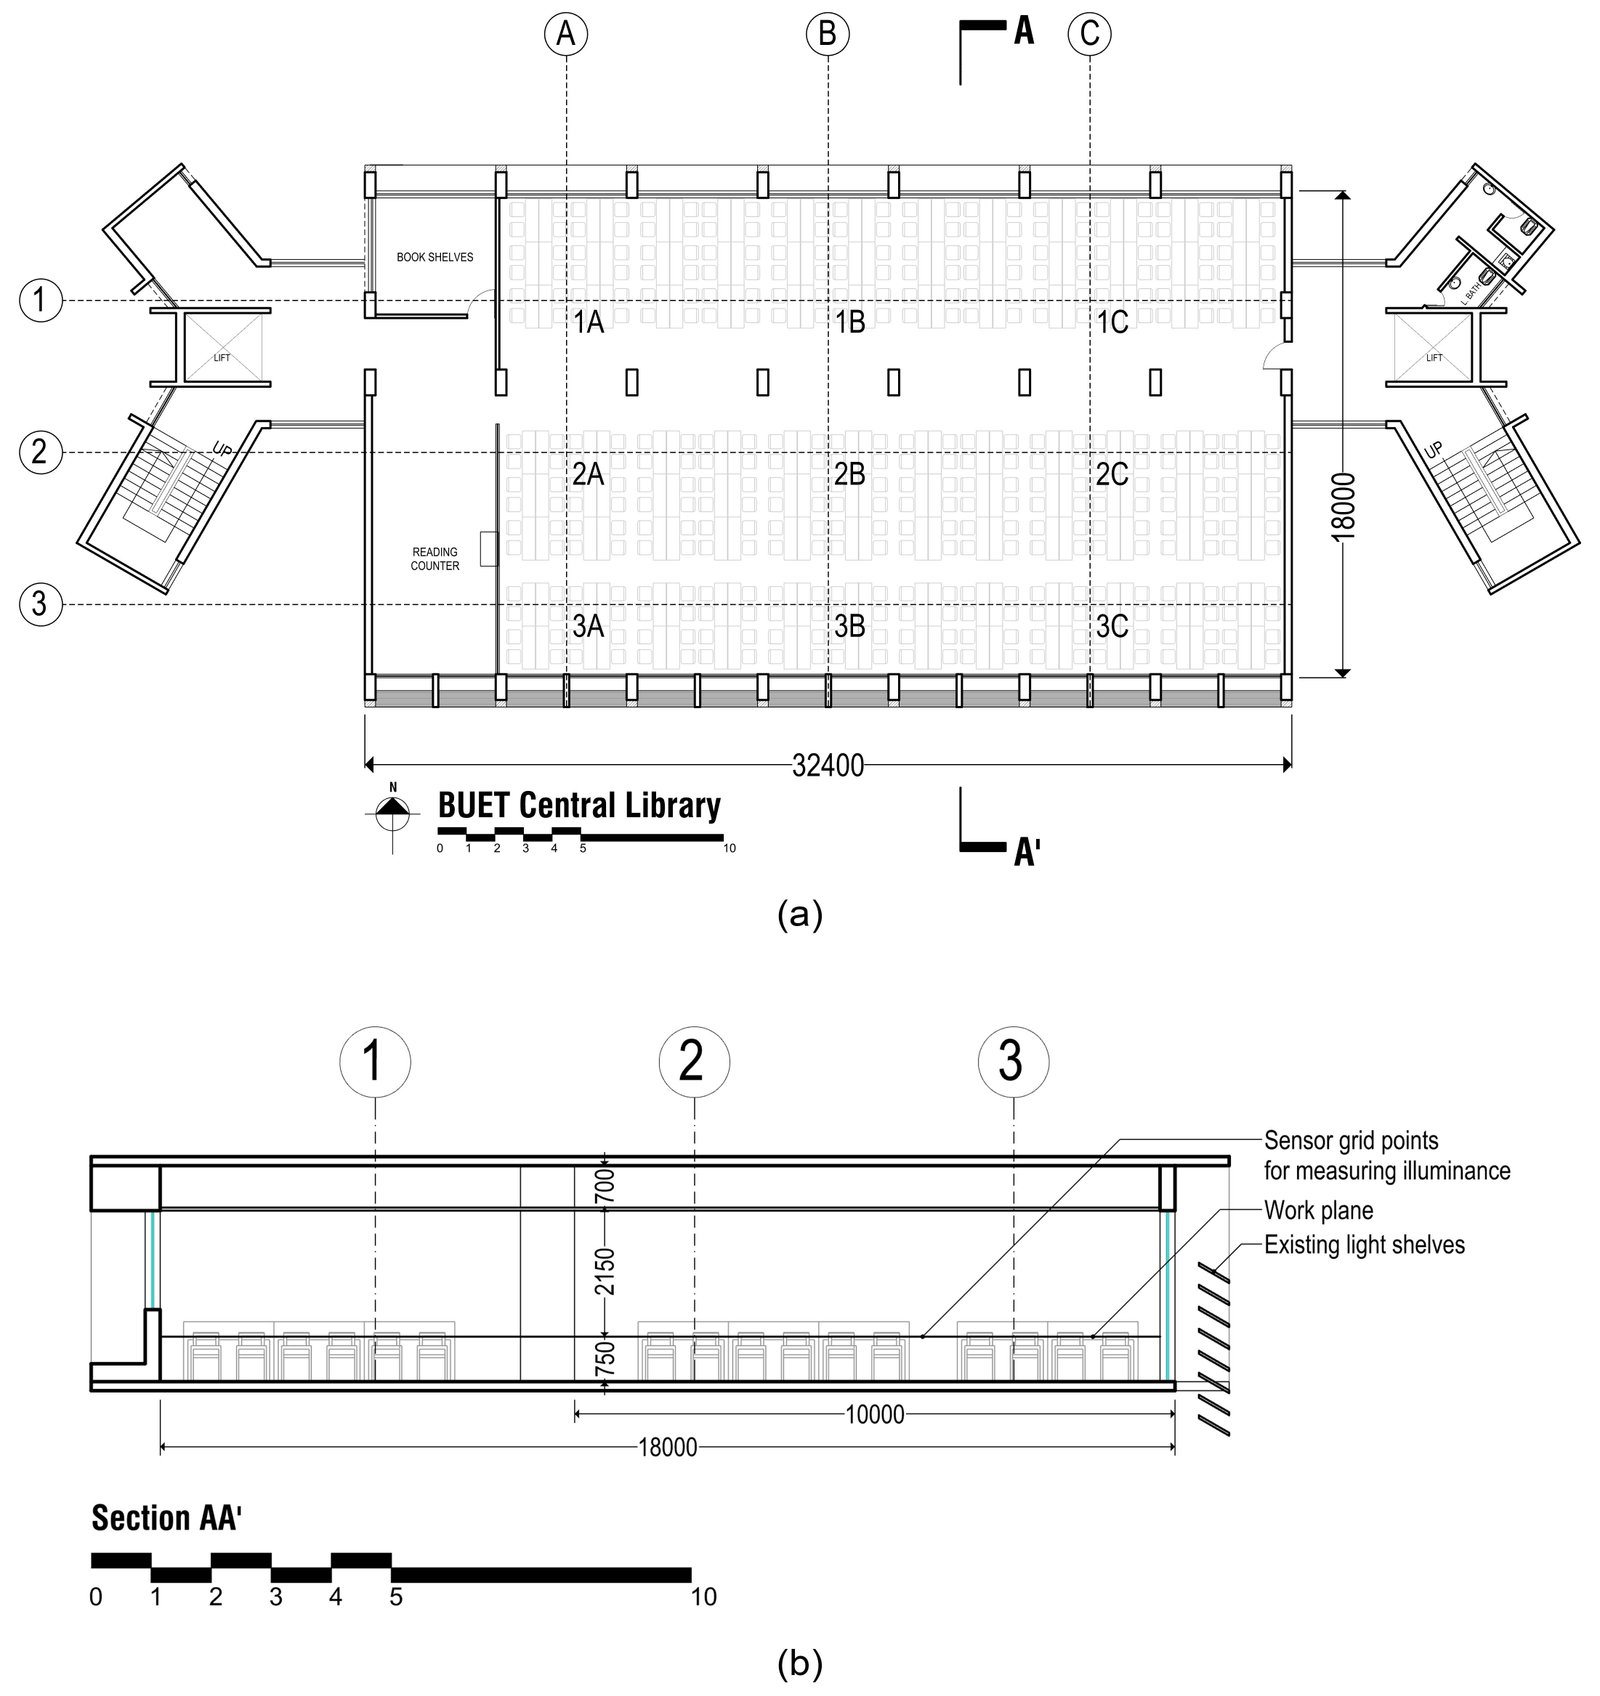
Fig. 3. (a) Plan with grid points for daylight measurements. (b) Section AA' of the case library space showing the height of grid points for light measurements and simulation study.
Studies have shown that dense vegetation placed in close proximity to a building can significantly reduce facade sky access and indoor illuminance to levels comparable to an entirely obstructed condition [36]. In the case of the BUET Central Library, the north facade faces a densely vegetated area with tall tropical evergreen trees, making the south facade the only effective source of daylight and resulting in a full-room depth with a deep-plan condition. These trees cast continuous shade on the north facade and were explicitly modeled using ClimateStudio's tree geometry module to replicate their dynamic shading behavior throughout the year.
A field survey was conducted by physically visiting the library, and daylight illumination data were collected using a light meter. The survey took place on 21 June 2025 (Summer Solstice) and 23 September 2025 (Autumnal Equinox) at the same points within the library space, between 10:00 a.m. and 2:00 p.m., to track changes in the sun's path throughout the year. Measurements were taken during regular library hours to reflect real user conditions and daylighting needs. The lighting data was recorded using a UNI-T UT383 Mini Light Meter. The device was placed on the reading desks at a work plane height of 750 mm, and artificial lights were switched off to obtain accurate daylight levels. Nine sensor grid points were distributed across the reading room to capture daylight variation from the window side to the deeper core areas. The light meter was positioned horizontally and kept steady on the reading tables during data collection to reduce potential measurement errors. Three consecutive readings were taken at each designated point. Since indoor daylight illuminance is affected by transient sky conditions such as passing clouds or wind-induced movement of surrounding vegetation, the digital light meter may show small temporary fluctuations between readings. Including such fluctuating readings in an average could introduce measurement error rather than reduce it. Therefore, the most stable reading among the three was chosen for each point, representing the clearest and most consistent sky condition at that moment.
3.2. Daylighting and energy metrics for simulation
The performance metrics selected for this study evaluate daylight availability, glare risk, and energy efficiency, enabling a quantitative assessment of HLP system performance against established standards. Illuminance is a commonly used metric in daylighting studies for evaluating how much visible light reaches work planes, floors, or walls in buildings during daylight hours. It is a photometric quantity that expresses the density of luminous flux incident at a point on a surface and is measured in lux [28, 29]. This study also focuses on sDA300/50% and ASE1000,250h, which are widely used in assessing indoor daylight levels.
According to the Illuminating Engineering Society (IES), sDA300/50% is a daylight metric that evaluates annual daylight access [31]. It defines the percentage of the occupied area that exceeds the 300 lux threshold for at least 50% of the total occupied hours in a year [39]. Using a grid of N points, with a function ST(i) that returns 1 for each point in the grid where the minimum illumination is met for a higher percentage of the total occupancy time, the sDA300/50% can be expressed as follows [32].
Where N = total number of grid points, ST(i) = 1 if point i meets the daylight criteria (e.g., ≥300 lux for ≥50% of occupied hours), otherwise ST(i) = 0. LEED v4.1 states that higher sDA300/50% scores translate into more credits for office buildings: 40% = 1 credit; 55% = 2 credits; and 75% = 3 credits [40].
According to the IES, ASE1000,250h measures the fraction of the horizontal work plane that exceeds 1000 lux for more than 250 hours annually, serving as an indicator of potential overlighting and excessive solar heat gain [41]. This metric is assessed during the working schedule with different operable shading devices retracted.
ASE1000,250h is intended to complement sDA300/50%, highlighting areas with high glare risk [39]. Like sDA300/50%, ASE1000,250h has the following mathematical representation.
Where ati is the number of hours point exceeds the ASE1000,250h illuminance threshold at point i, and is the annual absolute hour threshold. According to Leadership in Energy and Environmental Design (LEED), ASE1000,250h must not exceed 10% of the total space [42]. Illuminating Engineering Society, Lighting Measurement 83 (IES LM-83), approved the method of using sDA300/50% and ASE1000,250h together to evaluate the daylighting condition of the space [33].
EUI represents the sum of normalized heating, cooling, electric equipment, and lighting loads over the course of a year (kWh/(m2y)) [43]. A building's energy performance is considered better when its EUI is lower than the minimum benchmark recommended in local codes [44]. While the Bangladesh National Building Code (BNBC 2020) includes provisions for energy efficiency and sustainability in buildings [45], it does not prescribe specific numerical EUI benchmarks by building type. In the Bangladesh context, the related benchmarking term is Energy Performance Index (EPI), defined as building energy use per square meter per year.
However, available national implementation guidance suggests that such baseline values should be set for specific building types within the local context, and a fixed benchmark for university library reading rooms is not explicitly specified [46]. Therefore, in this study, EUI is primarily used as a comparative performance metric to evaluate the relative improvement between the base model and the HLP-integrated options rather than as a direct code-compliance goal. Various factors, such as plug loads, weather conditions, and occupant schedules, can influence a building's energy consumption. EUI is mathematically expressed as [47] following.
where, Ei is the monthly total energy consumption and Abuilding is the total floor area of the case space. Regardless of a building's size or particular energy end uses, EUI provides a standardized way to compare its energy performance. This research intended to find an optimized HLP system that maximizes sDA300/50%, minimizes ASE1000,250h and reduces EUI.
3.3. Simulation and optimization process
3.3.1 Selection of simulation tools
Several variables, including project goals, the level of detail needed, and user experience with the software environment, influence the choice of simulation tool for maximizing daylight performance and energy efficiency. Handling complex geometries, producing climate-based daylight metrics, and accurately predicting indoor daylight distribution are the key characteristics of an ideal tool [48]. It can be difficult to manage data from different energy and daylighting tools for MOO. By integrating simulations with Radiance and EnergyPlusTM for precise predictions, ClimateStudio streamlines the intricate simulation process. Real-time climate-based daylighting simulations, such as sDA300/50% and ASE1000,250h, that comply with LEED v4.1 standards are a crucial component of ClimateStudio [49]. In contrast to batch-processing tools such as DIALux, which require distinct calculation stages, ClimateStudio allows designers to see immediate effects on daylight performance by enabling dynamic parameter adjustments within Grasshopper. The interactive and parametric workflow represents a major advancement over conventional simulation methods, enhancing the accuracy and efficiency of daylight analysis [15]. EnergyPlusTM is also integrated into ClimateStudio to provide thorough simulations of energy performance. Key building energy parameters, such as ventilation, lighting, heating, and cooling, are modeled by the extensively validated simulation engine EnergyPlusTM [50]. The Octopus plug-in was used to carry out multi-objective optimization and iterative simulations while running alongside ClimateStudio in Grasshopper. Using GAs, the optimization process improves the facade design and finds the optimal trade-off between daylight performance and energy efficiency [51].
Octopus seamlessly integrates with Grasshopper to automate performance evaluation and expand design exploration [52,53]. In this study, Rhinoceros and Grasshopper were used to construct a parametric model for simulation, while ClimateStudio assisted with energy and daylight simulations. The Octopus was used for iterative simulation and optimization. Octopus made it easier to visualize optimized outcomes using a 3D Pareto Front graph. To verify the optimized result and gain a more in-depth understanding, the dataset generated by the optimization process was further examined in Design Explorer using a parallel coordinates plot (PCP) and optimization goals as filters.
3.3.2. Selection of variables
The configurations of the HLP parameters that influence daylight transport and distribution were considered as variables for the optimization study. The size of the library reading room was kept constant, while the geometry of the HLP system was varied as the parametric input. In total, six variables were selected for simulation and optimization, as illustrated in Fig. 4 and Fig. 5.
Figure 4
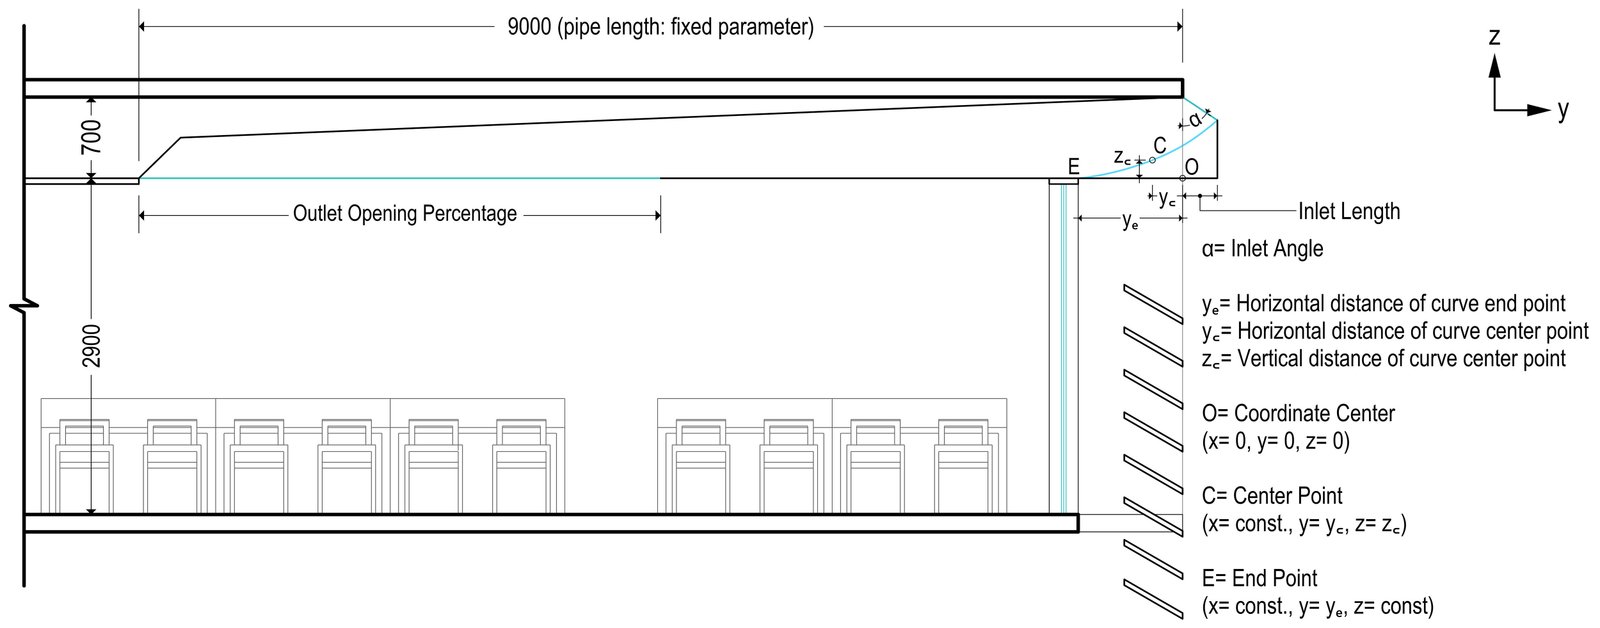
Fig. 4. Selected horizontal light pipe parameters for the optimization study.
Figure 5
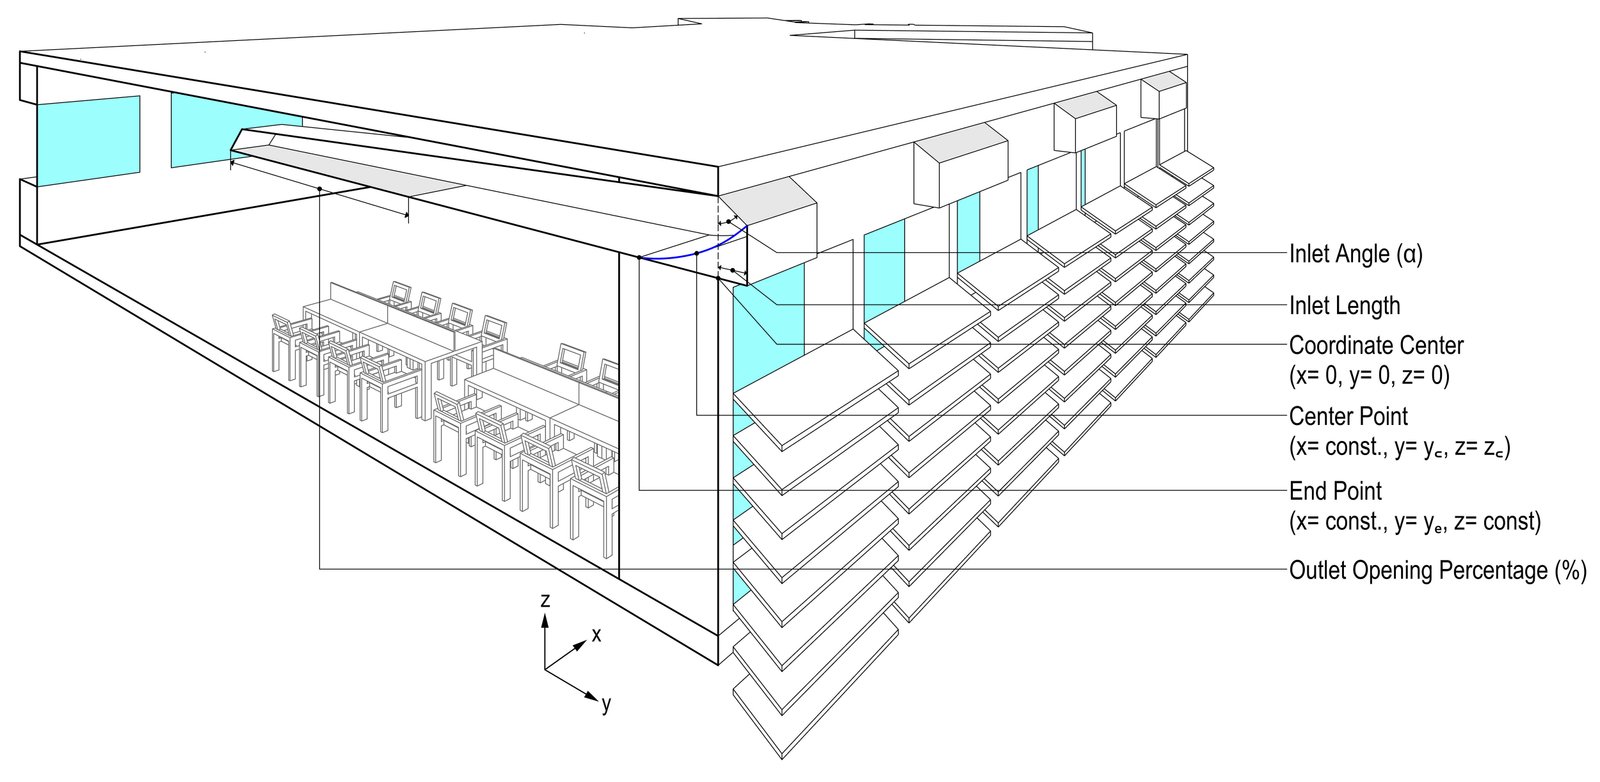
Fig. 5. Test model with selected horizontal light pipe parameters.
The inlet of the pipe was equipped with a reflector to guide incoming daylight, while the outlet determines how light is distributed into the interior. The pipe length was fixed at 9 m, corresponding to the depth of the library space. At the outlet, the illuminance was directed down to the reading area through a curved reflector, which plays a critical role in shaping the distribution of daylight [54]. Together, these parameters directly affect performance in terms of illuminance, daylight spread, and potential glare.
In the Grasshopper workflow, the inlet angle was derived from an HLP Inlet angle factor, while the outlet opening percentage was determined from an HLP outlet opening factor. These factors allowed controlled variation of the geometry during the optimization process. For this study, the following six variables were selected.
- Inlet length
- Inlet angle (derived from the HLP Inlet Angle Factor)
- Outlet opening percentage (derived from the HLP Outlet Opening Factor)
- Horizontal distance of curve end point (ye)
- Horizontal distance of curve center point (yc)
- Vertical distance of curve center point (zc)
Their ranges were determined based on a combination of physical constraints, established HLP design precedents from the literature, regulatory provisions, and the geometric inter-dependencies of the HLP system components.
The inlet length was varied from 0 to 1.5 m. The upper limit of 1.5 m was set with reference to the Bangladesh National Building Code [45] setback and projection provisions, which constrain the maximum allowable projection of building elements beyond the facade line. This range is consistent with the inlet widths studied in the HLP literature, where apertures of 0.6–2 m have been commonly employed[11,12,24].
The inlet reflector angle determines the orientation of the collecting surface relative to the horizontal, ranging from 0° (fully vertical, akin to a glazed facade) to 180° (fully horizontal, resembling a ceiling-mounted skylight). This range was chosen to enable the optimization process to examine the full angular span of possible inlet orientations within the specified HLP geometry. This is a geometry-based parametric definition rather than a code-derived value. This approach is consistent with the inlet angle optimization strategy described by Ziaee and Vakilinezhad [29], in which the shelf height and angle were allowed to vary across their full physically feasible range.
The outlet opening percentage was varied from 0% to 80%, with 80% representing the fully open condition used in the current parametric setup. This upper limit was chosen to prevent over-weakening the pipe body and to ensure the opening remains within a constructible and physically continuous outlet configuration for the modeled HLP. This is therefore a model-logic limit rather than an external standard.
The reflector-curve variables ye, yc, and zc were given bounded ranges because they are not independent free parameters; they are geometrically linked to the inlet size, inlet angle, and allowable reflector profile within the pipe envelope. In this study, ye was allowed up to 1800 mm, zc up to about 800 mm, and yc up to around 1650 mm, because larger values would push the profile outside the feasible reflector region generated by the chosen inlet geometry and HLP proportions. These ranges were selected as reasonably feasible limits that maintain a constructible reflector shape while still permitting significant curvature variation.
These variables (Fig. 5) were parametrically modeled to explore a wide range of HLP geometries and identify configurations that provide the best daylighting performance for the deep-plan library space.
In principle, the angles of the horizontal taper and vertical profile of the HLP body could act as additional optimization variables. However, they were kept constant in this study to ensure comparability with established HLP configurations and to keep the parametric solution space within computationally feasible limits. This is acknowledged as a limitation of the study (see Section 5.1.).
3.3.3. 3D Modelling
The daylight model was developed to analyze daylight availability, point-in-time illuminance, and glare, while the energy model focused on energy use and was simplified for faster simulation. A detailed parametric model of the second-floor reading room in the case library building (Fig. 6(a)) was developed in Rhinoceros and Grasshopper using field survey data. ClimateStudio (version 2.0) was used to simulate daylight, as shown in the daylight model (Fig. 6(b)). A simplified shoebox model (Fig. 6(c)) was also prepared to assess energy performance and the effect of design parameters on EUI. The climate file of Dhaka (Dhaka.419230_SWERA) from the EnergyPlusTM database was used to represent local conditions, and daylight simulations employed a sensor grid at 0.75 m above floor level under a CIE overcast sky, following standard practice [55]. For the iterative optimization process, daylight and energy models were integrated into a parametric model in Rhinoceros and Grasshopper (Fig. 6(d)).
Figure 6
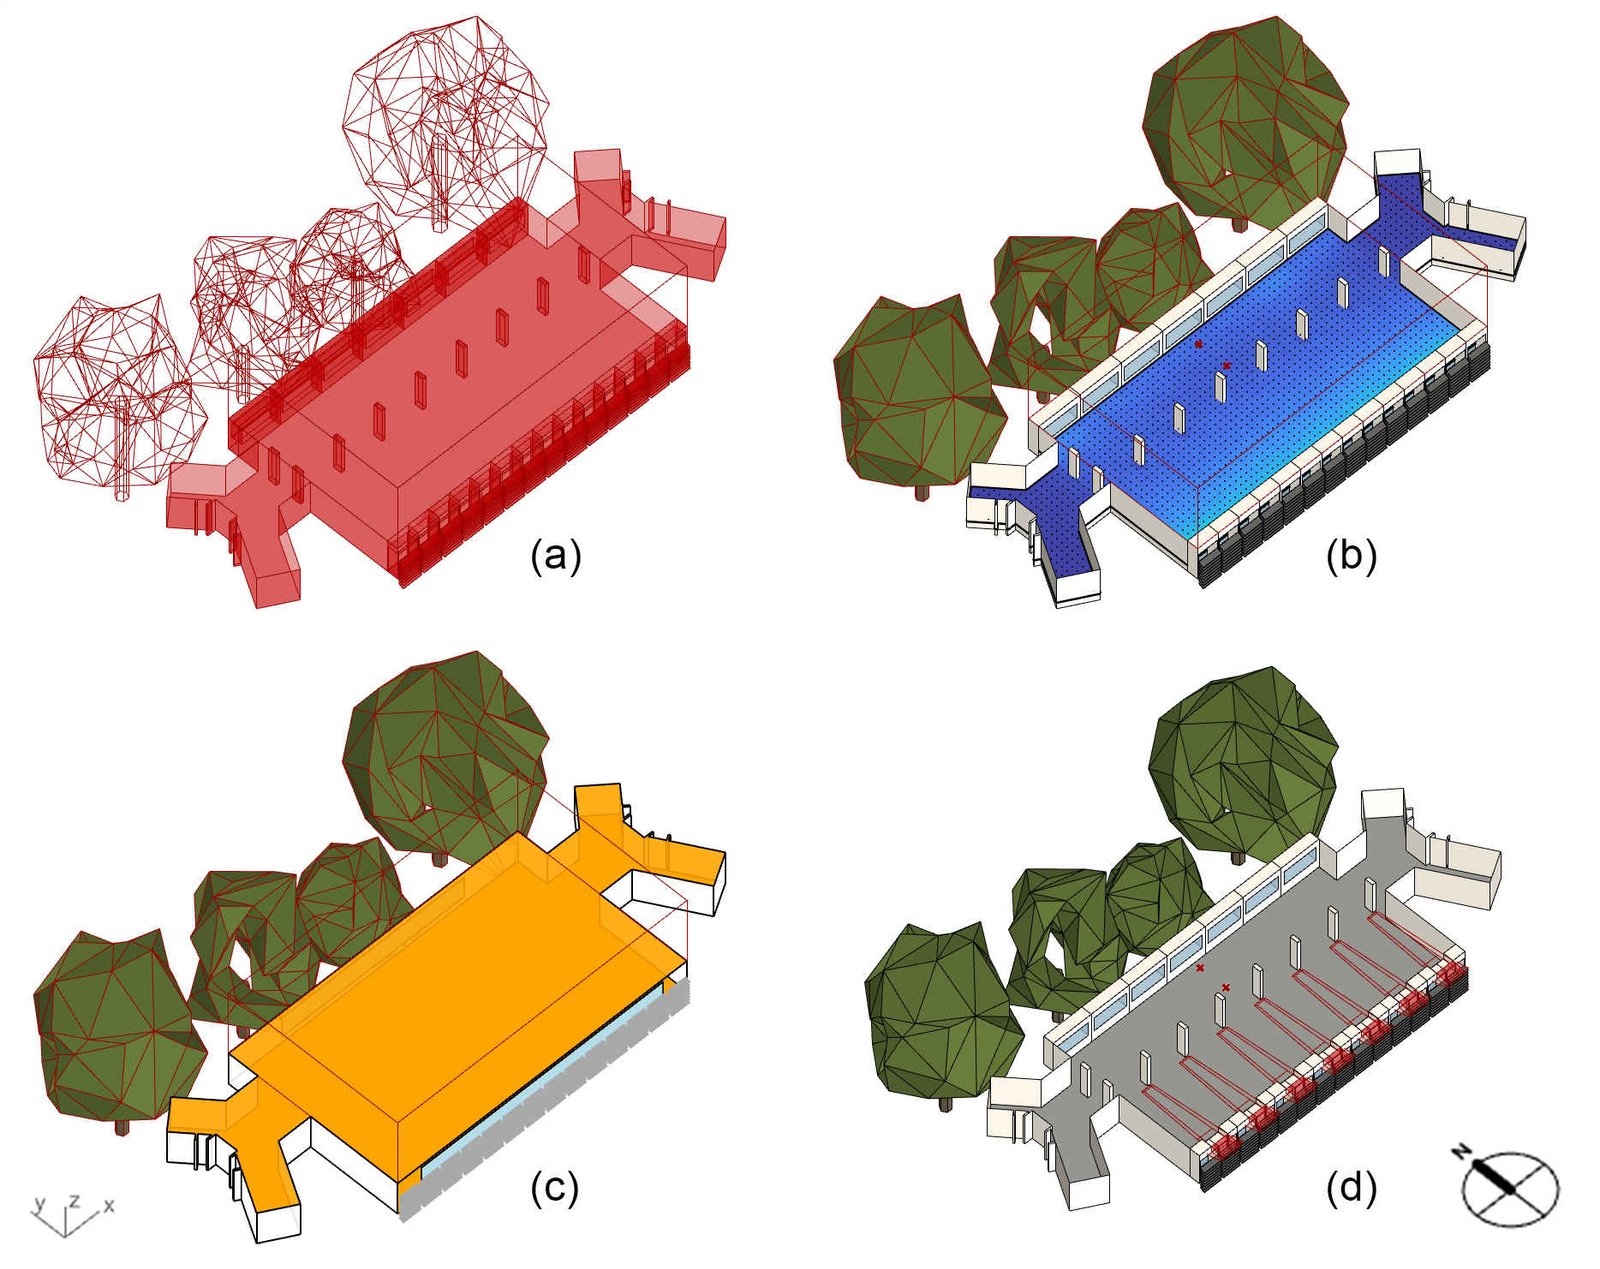
Fig. 6. (a) Case building model. (b) Daylight model. (c) Energy model. (d) Parametric model for optimization.
Test models were created by integrating different HLP configurations into the base model. The inlet length, inlet angle, outlet opening percentage, and reflector curvature parameters (ye, yc, zc) were varied as part of the parametric workflow, and a MOO was performed to balance daylighting and energy performance.
3.3.4. Materials and properties
Materials for the base and test models were identified during the site survey and assigned using the ClimateStudio material library. These materials included the floor, ceiling, wall, column, and window glazing components, each characterized by its corresponding optical and thermal attributes. To ensure consistency across simulations, the test models with HLP integration used the same material properties as the base model.
In this study, the inlet of HLP was oriented to the south to utilize the most sunlight throughout the day. The pipe was a rectilinear duct with optical properties suitable for delivering sunlight into the room [10]. In plan, the pipe had a trapezoidal shape, tapering from the inlet to the end. The overall length of the pipe is 9 m, with a height of 0.70 m. At the inlet, the width is 2 m, which gradually reduces to 1 m at the back of the room. The basic configuration of the light pipe, with its predefined dimensions, is shown in Fig. 7.
Figure 7
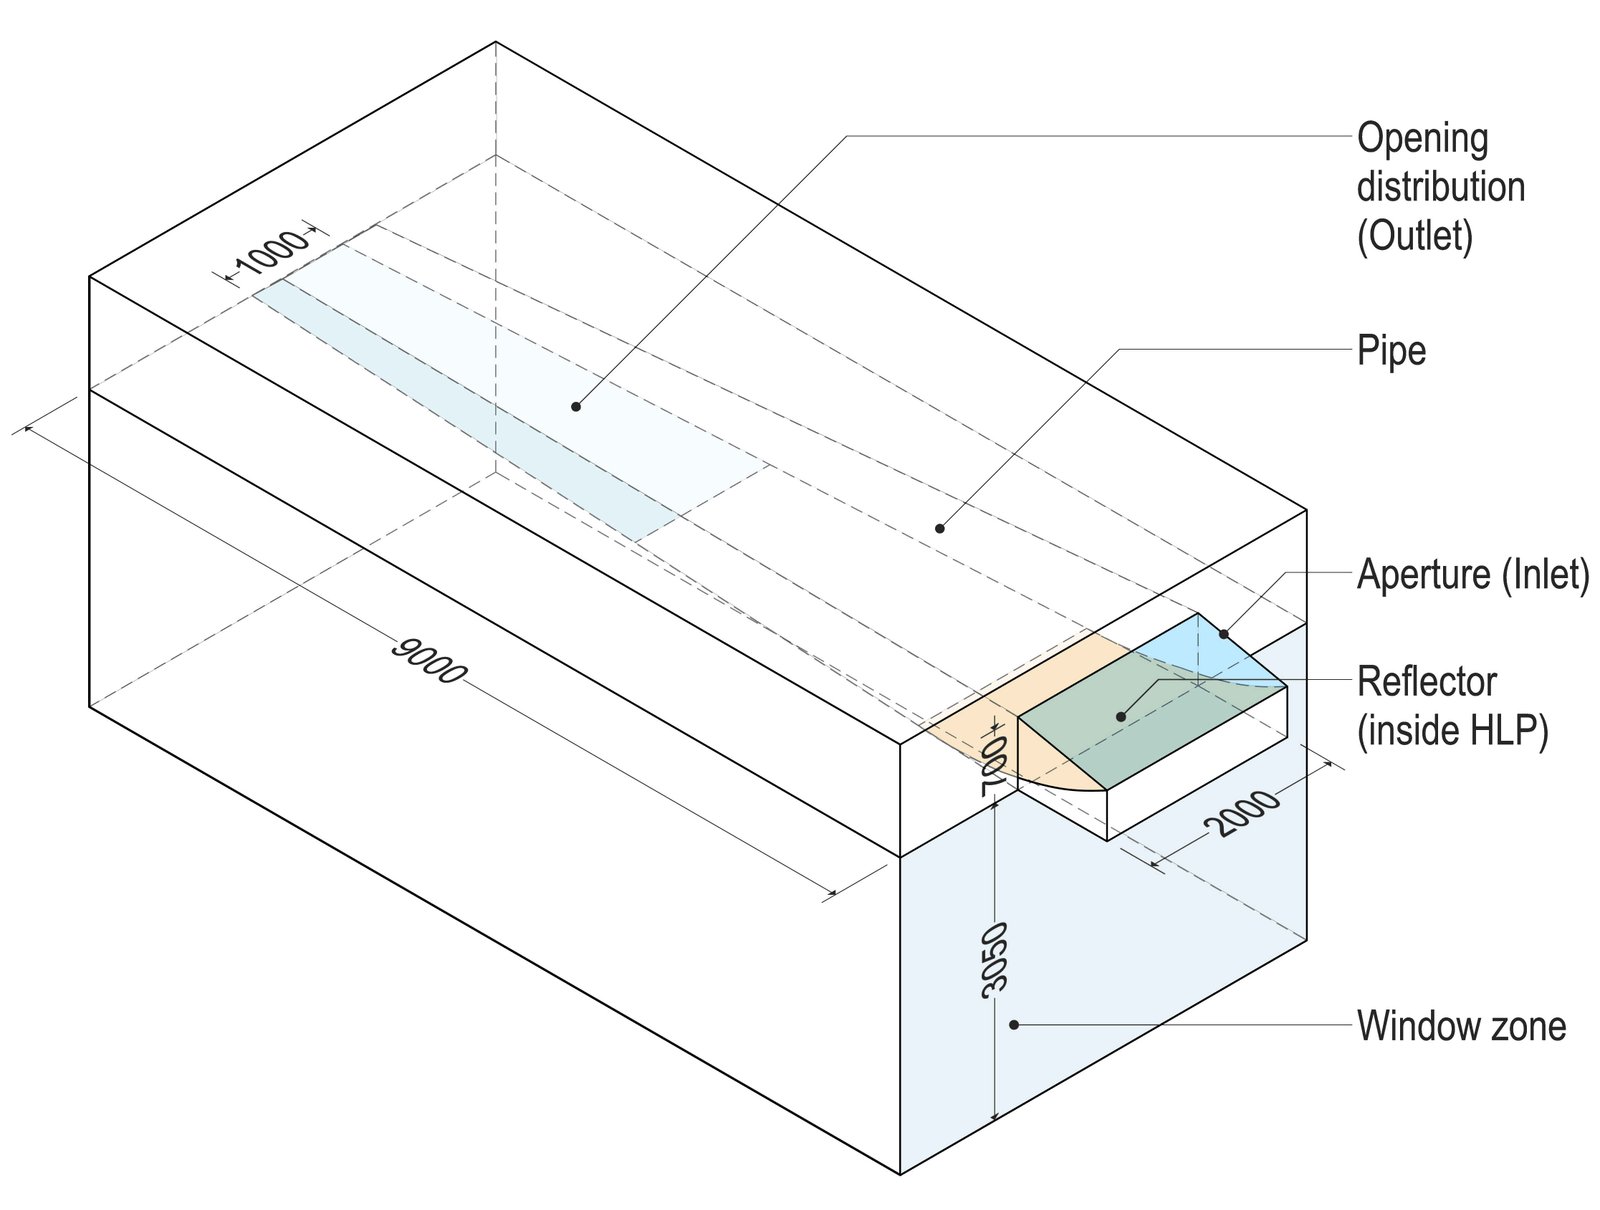
Fig. 7. The configuration of the horizontal light pipe.
This configuration is well established in prior HLP research on tropical climates [12,23,24]. This form progressively reduces the pipe's cross-section toward the outlet, limiting the number of successive reflections off the side walls as daylight travels deeper into the space, and thereby helping to maintain higher daylight intensity at greater room depths.
In the current case, the pipe length was fixed at 9 m to match the room's depth, while the 2 m to 1 m taper and 0.70 m height were chosen to ensure a practical HLP ratio within the plenum and to fit the room's spatial constraints.
The inlet was designed with clear glass having a visible transmittance of 88% to maximize light entry. The reflector and interior surfaces of the pipe were modeled with high reflectance values to ensure efficient redirection of daylight. Clear glass was also used for the outlet opening to maximize light transmission from the HLP into the room. The detailed material properties used for the simulation are listed in Table 2.
Table 2
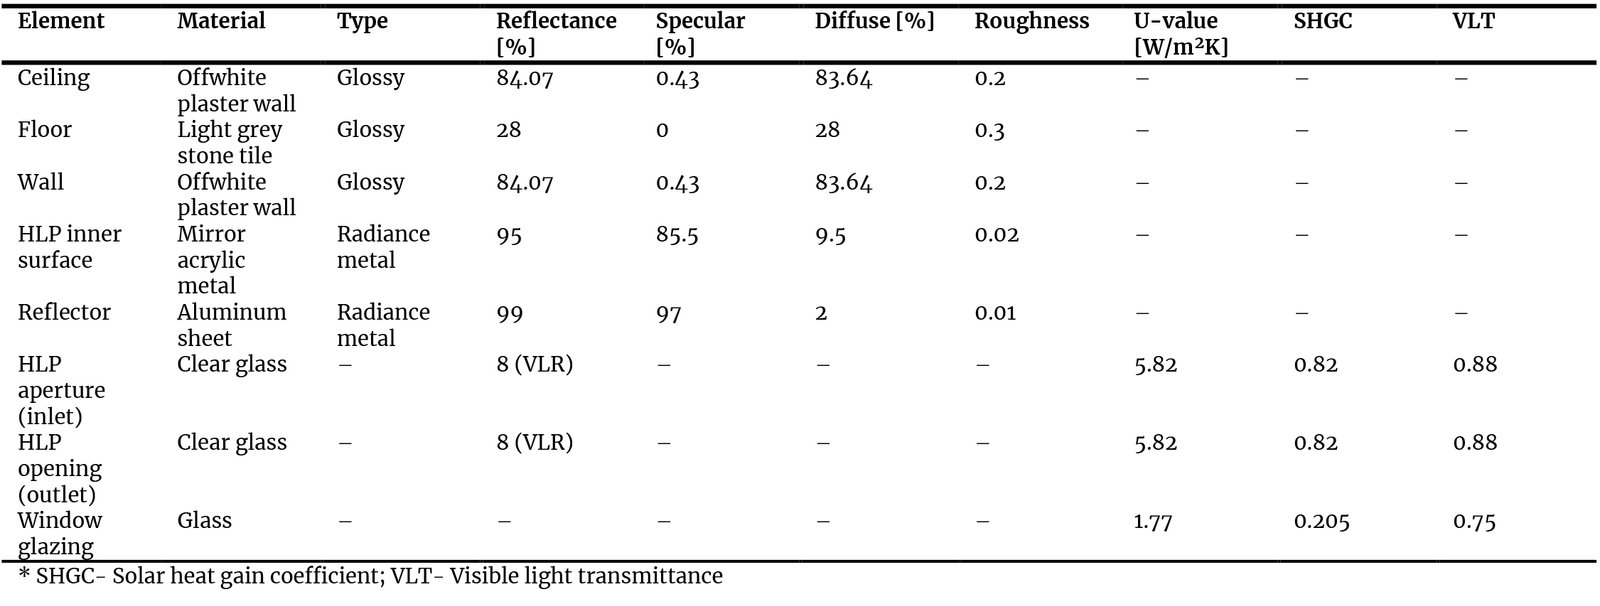
Table 2. Material selection for the 3D model from the ClimateStudio material library.
3.4. Simulation and optimization framework
The optimization process in this study was carried out through an integrated workflow using Grasshopper, ClimateStudio, and Octopus. Grasshopper was used to generate the parametric model, with six design variables: inlet length, inlet angle, outlet opening percentage, and three reflector curvature parameters (ye, yc, zc). ClimateStudio was then employed to perform daylight and energy simulations, providing four performance metrics required for evaluation. These metrics were mean illuminance, sDA300/50%, ASE1000,250h, and EUI. A large number of combinations were possible among these ten interconnected variables and within their ranges.
The Grasshopper workflow in this research comprises seven sets. Figure 8(a) shows the workflow of the optimization process in Grasshopper. Set A components were used to develop the building geometry. The geometry was connected to components in Set D for the parametric definition of HLP variables, including inlet length, inlet angle, outlet opening percentage, and reflector curvature parameters (ye, yc, zc). The daylight model from Set A was linked to Set B for daylighting simulation in ClimateStudio, while Set E represented the energy model and energy simulation. Set C was the Octopus plug-in, which connected the outputs from Sets E (energy model) and B (daylighting simulation) for MOO. Set F was responsible for data logging and export.
Figure 8
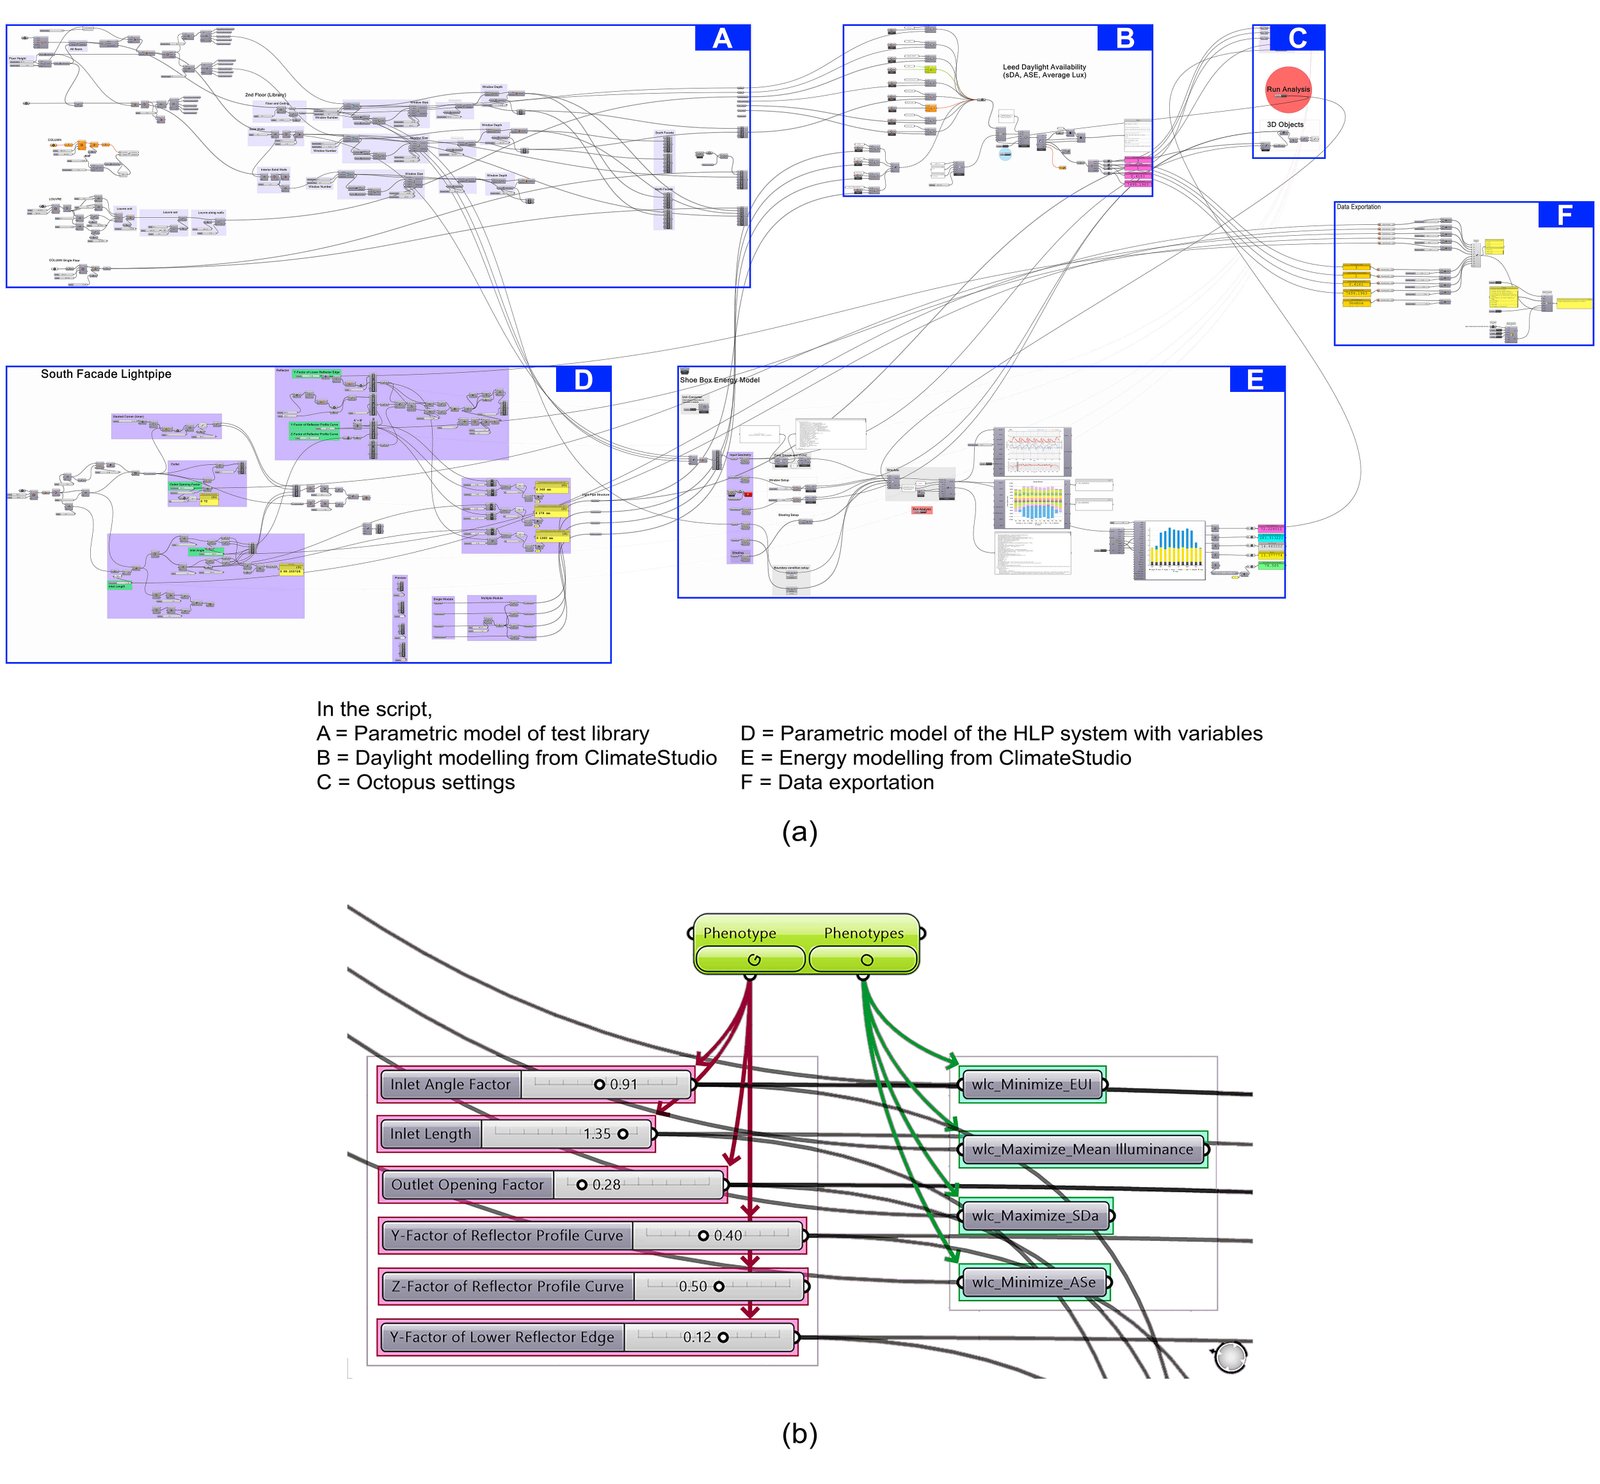
Fig. 8. (a) Grasshopper script connected with Octopus. (b) Grasshopper genomes and objectives connected with Octopus.
To achieve the desired values for daylight and energy metrics, the parametric variables of the HLP system were optimized using an MOO. Octopus, the optimization engine, was added to the Grasshopper canvas. As shown in Fig. 8(b), the six design variables were defined in Octopus through their parametric controls, while the four performance metrics were linked as objectives. The optimization targets were to maximize mean illuminance and sDA300/50%, while minimizing ASE1000,250h and EUI. The population size was set to 100 and the number of generations to 10, resulting in 1,000 simulation runs, with one additional generation evaluated to confirm stability, totaling 1,100 combinations. Each combination, known as a Genome, was assigned a serial number for analysis of results. This population size is consistent with standard practice in Octopus-based building performance optimization [15,32]. The selection of 10 generations was informed by preliminary optimization runs at lower genome counts (approximately 500 and 800), in which the performance metric ranges and parameter distributions among the top-ranked genomes continued to evolve. As the total simulation count approached 1,000, the Pareto Front solutions and their corresponding parameter ranges stabilized, indicating that the solution space had been sufficiently explored. The 1,100-genome count was therefore selected as the final evaluation set to confirm this stability. After the simulation, the design variables, daylighting metrics, and energy metrics were exported to another Excel file using the TT Toolbox for later analysis of the optimization outcomes.
Optimization convergence was assessed using two complementary approaches. During the optimization run, the Pareto Front was monitored across generations within the Octopus interface using its built-in hypervolume and convergence visualization. In the early generations (1 to 5), new non-dominated solutions continued to significantly displace the Pareto Front. From approximately generation 7 onward, the front stabilized, with successive genomes producing only marginal shifts, indicating that the evolutionary search had reached a consistent solution space. Post-hoc confirmation of convergence was performed through Design Explorer analysis of the exported genome dataset: the parallel coordinate plot revealed that the top-ranked genomes clustered within a narrow and repeatable parameter range (inlet length: 1.14 m to 1.50 m; inlet angle: 74° to 86°; outlet opening: 78% to 80%), with strong agreement between Pareto Front selections and Design Explorer top solutions. This dual approach to convergence assessment, real-time Pareto Front monitoring combined with post-hoc data clustering analysis, is consistent with established practice in MOO-based building performance studies [56,57].
3.5. Model validation
Field measurements were conducted to collect illumination data for validating the simulation model and evaluating the daylight performance of the library space. On reading desk top surfaces, illumination was measured at nine grid points (1A–3C), which correspond to a work plane height of 0.75 m from the finished floor (Fig. 3). The measurement grid was fixed to capture daylight variation from the perimeter near the windows to the deeper core zones of the second-floor reading room. Daylight illumination (in lux) was measured using a UNI-T UT383 Mini Light Meter (Fig. 9(a)). Since there is no official calibration certificate for the device [58], its results were cross-checked against a reliable reference light source in a controlled indoor environment before field use. This procedure improved measurement consistency, but it did not replace traceable laboratory calibration. Therefore, some uncertainty remained in the measured illuminance values, and the validation results should be interpreted with this limitation in mind. Each sensor location was marked in advance, and the meter was placed directly on the top of the reading desks during measurement (Fig. 9(b)).
Figure 9
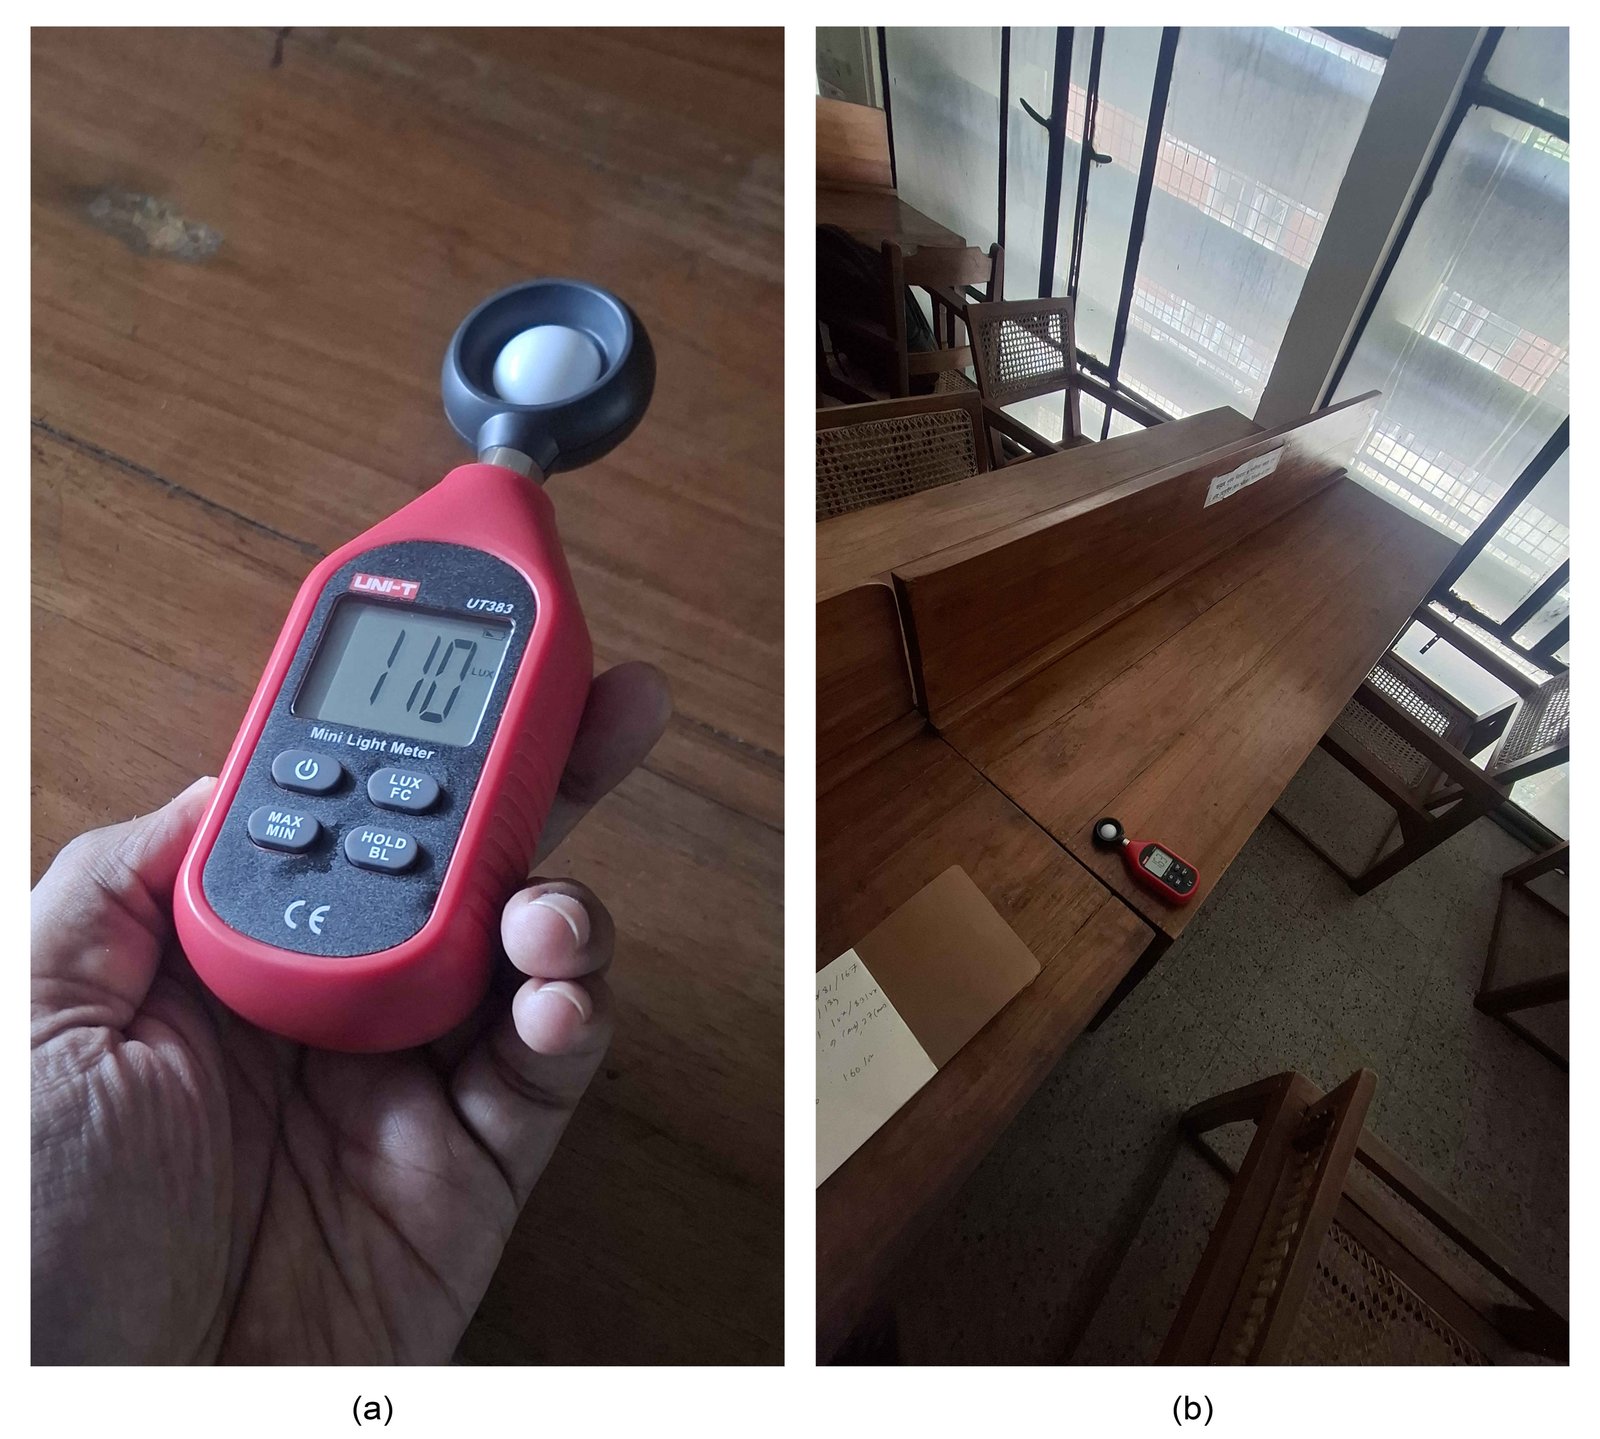
Fig. 9. (a) Equipment used for field measurement. (b) Equipment placed in the case room.
The measurement campaign took place twice a year, at the summer solstice (21 June 2025) and the autumnal equinox (23 September 2025). These measurements were conducted to validate the simulation model's point-in-time daylight behavior under two seasonally distinct conditions. However, since the field campaign lasted only two days, it does not capture the full annual variability in daylight conditions. Therefore, the measured data should be interpreted as validation data for the simulation model rather than as a complete annual daylight dataset.
Field measurements were initially conducted hourly throughout the day to understand daylight variation over time. Among these, data collected at 10:30 a.m. and 2:00 p.m. were selected for presentation and validation, as they correspond to critical daylight hours under typical sky conditions in Dhaka’s tropical climate. These timings were selected to coincide with high solar angles in Dhaka’s tropical climate [10], providing representative data on daylight penetration during midday. The collected data were used to validate the simulation model.
Artificial lights were switched off throughout the campaign, and the windows remained closed without blinds to ensure undisturbed daylight.
During the simulation, the 3D model was developed to closely replicate the actual conditions of the library space, thereby improving the accuracy of the comparison between measured and simulated lux values. While many studies focus on modeling the interior of a building to reflect real-world conditions, outdoor environments are often simplified or excluded. To improve validation of daylighting performance, this study included both the library's interior and its surrounding vegetation. Tree geometries provided by ClimateStudio were placed in the simulation as block instances (Fig. 6). These geometries, equipped with dynamic leaf materials, allow the trees to behave as either deciduous or evergreen species, depending on the simulation's time of year and geographical context [59]. The materials used in this instance were chosen to complement the tropical evergreen trees that naturally shade the library building's north facade. In reality, the thick, dense foliage of these trees plays a significant role in shading the facade. The model more accurately captured the shading effect of the surrounding environment by integrating these tree geometries into the simulation.
To quantitatively assess the deviation between measured and simulated results, several statistical validation indices were employed in accordance with American Society of Heating, Refrigerating, and Air-Conditioning Engineers (ASHRAE) Guideline 14-2014 [60]. These included the mean bias error (MBE), root mean squared error (RMSE), coefficient of variation of the RMSE [CV(RMSE)], mean absolute percentage error (MAPE), and root mean squared logarithmic error (RMSLE), as formulated in Equations (4) – (8).
where: Mi and Si are measured and simulated data at instance i, n is the total number of data values used for the calculation, ¯M is the mean value of measured data.
ASHRAE Guideline 14 [60] specifies that thermal or daylighting models are considered calibrated when the MBE remains within ±10%, and the CV(RMSE) is within ±30%. In daylighting research, simulation errors in the range of 20~30% have also been reported as acceptable in previous studies [61-63]. The comparison of measured and simulated illumination values at the nine grid points (Fig. 10) for the two studied days shows that the model well represents the distribution of daylight across the reading room.
Figure 10
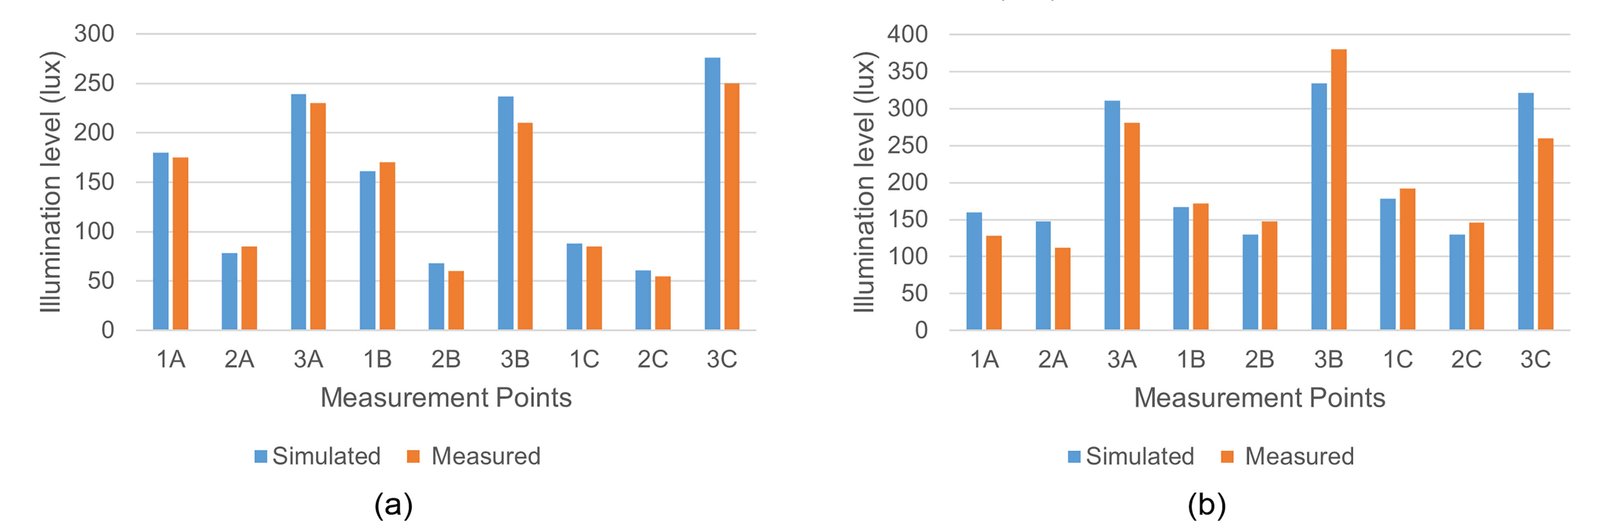
Fig. 10. Comparison of measured and simulated illuminance levels in the reading room: (a) 21 June 2025 at 10:30 a.m. (b) 23 September 2025, 2:00 p.m.
The validation results for the 21 June, 10:30 a.m. illumination measurements (Fig. 10(a)) yielded an MBE of –5.15% and a CV(RMSE) of 9.51%, both of which fall comfortably within the ASHRAE acceptance limits. Statistical indicators such as Pearson's r (0.9921) and R² (0.9624) were significantly close to +1, indicating a strong positive relationship between the actual and predicted data.
Similarly, for the 23 September, 02:00 p.m. illumination measurements (Fig. 10(b)), the measured data demonstrated good agreement with the simulated values. According to Table 3, the MBE for this dataset was –3.30%, within the acceptable range, and the CV(RMSE) was 16.38%, slightly higher than the 21 June values and still within the typical error range reported in daylighting research. Pearson's r (0.9225) and R² (0.8408) values also indicated a strong correlation between measured and simulated illuminance levels. These results indicate that the daylight model can reliably reproduce the real conditions of the case library building reading room.
Table 3
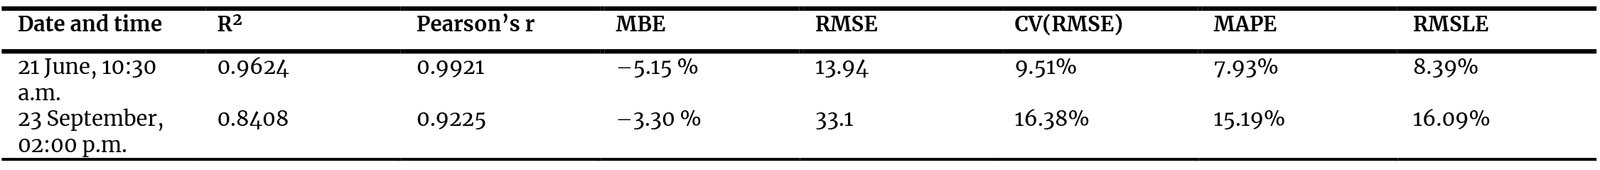
Table 3. Parameters of statistical tests for measured data and simulation.
Accordingly, the agreement between measured and simulated illuminance values on these two dates supports the model's reliability for point-in-time validation, while the annual daylight metrics reported later in the study remain dependent on climate-based simulation rather than direct year-round field monitoring [64].
The energy model's results are based on the established daylighting framework; therefore, they can be considered reliable for comparative analysis, even though they were not independently validated against site-specific metered energy data in this study. In the context of this study, sub-metered energy consumption data disaggregated to the level of a single reading room within a multi-story institutional building were not available, a commonly reported constraint in building energy research in developing country contexts. The energy simulations are conducted using EnergyPlus™ via ClimateStudio, a simulation engine that has been extensively validated globally through analytical, comparative, and empirical testing [65]. Since the primary purpose of this research is to optimize the daylight-energy trade-off through parametric HLP design, and EUI is evaluated across 1,100 comparative simulations rather than as an absolute operational prediction, the energy results are interpreted as relative indicators of performance improvement rather than absolute values. This approach is consistent with established practice in early-stage parametric optimization studies, where energy results are used to rank and compare design alternatives rather than to predict actual metered consumption [66].
4. Findings
The results assessed the performance of the library reading room, comparing scenarios with and without HLP system integration, while considering daylight availability and overall EUI throughout the year, based on occupancy hours from 9:00 a.m. to 5:00 p.m.
4.1. Comparison of daylighting metrics
This section presents a comparison between the daylighting simulation results of the base model and the test models. The base model results were used to establish the daylight performance of the existing library reading room. Three daylighting metrics were considered in the base model: mean illuminance, sDA300/50%, and ASE1000,250h. The Grasshopper-ClimateStudio simulation of the base model showed a mean illuminance of 393 lux, 38.4% sDA300/50%, and 3.4% ASE1000,250h. The test models, which integrated different HLP configurations, were developed through a parametric process where HLP parameters were varied. Changes in these variables resulted in differences in the daylighting metrics. The test model results were evaluated using the same three metrics: mean illuminance, sDA300/50%, and ASE1000,250h.
The key outcomes from the ClimateStudio simulations are summarized in Table 4 and are discussed in detail below.
Table 4
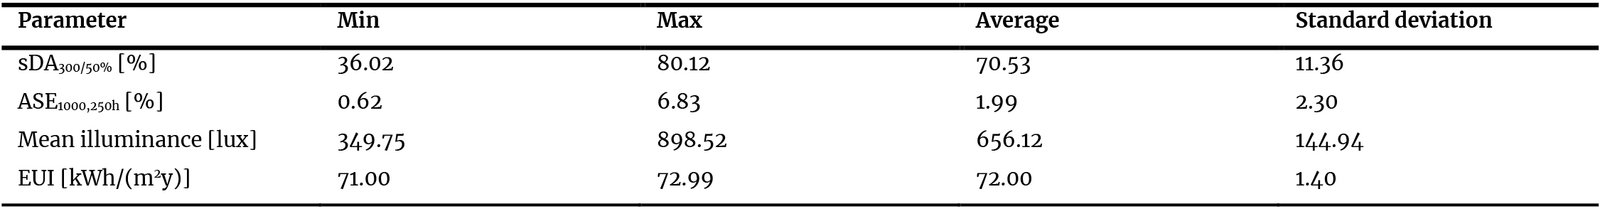
Table 4. Daylighting simulation results of the test models.
4.1.1. Mean illuminance
The mean illuminance in the test models (1100 simulation genomes) ranged from 350 to 899 lux, with an average of 656 lux and a standard deviation of 145 lux, indicating that the illuminance values remained within a consistent range across simulations. This shows that the test models achieved a minimum mean illuminance of 350 lux, which increased to nearly 900 lux depending on the HLP system parameter configurations. The distribution of mean illuminance values across the test models is illustrated in Fig. 11(a). As the HLP collected daylight and redirected it into the reading room space, the point-in-time illuminance increased substantially from the base model (393 lux) to the optimum case (899 lux).
Figure 11
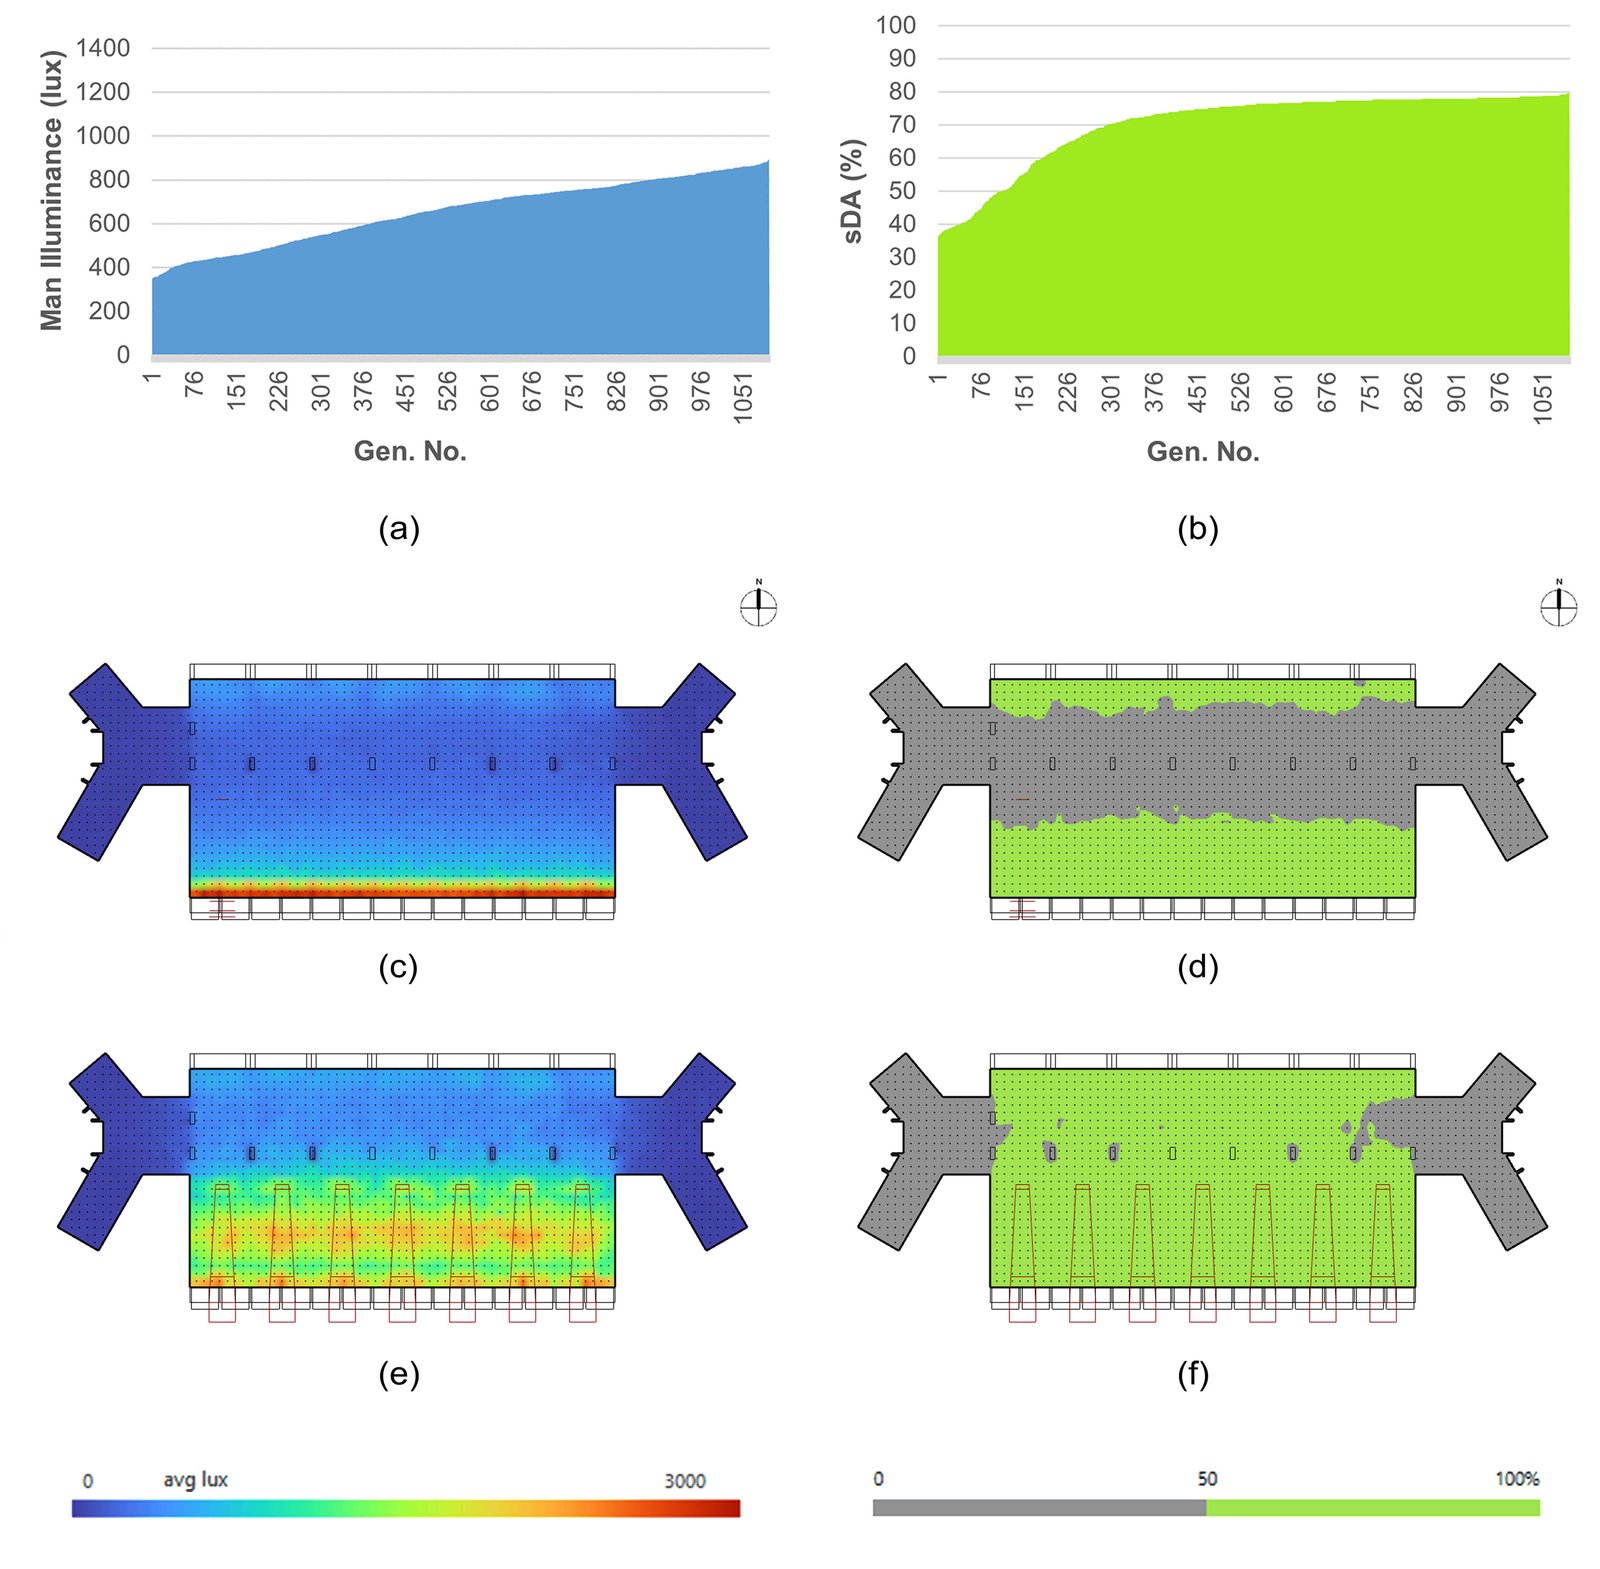
Fig. 11. (a) Mean illuminance distribution in 1100 MOO simulations. (b) sDA300/50% distribution in 1100 MOO simulations. (c) Distribution of point-in-time illuminance in the base model. (d) sDA300/50% distribution in the base model. (e) Distribution of point-in-time illuminance in the optimum test model. (f) sDA300/50% distribution in the optimum test model.
The results demonstrated that integrating the HLP system improved daylight penetration in the library space. Compared to the base model, which achieved 38.4% sDA300/50% and 3.4% ASE1000,250h, the optimum case reached 80.1% sDA300/50% and only 0.62% ASE1000,250h, showing enhanced daylight autonomy with reduced glare risk. The addition of the HLP therefore nearly doubled the spatial daylight autonomy while lowering annual sunlight exposure.
The illuminance distribution maps further confirm these findings. Fig. 11(c) shows the base model, in which daylight penetration was limited, and the central zone of the room remained underlit.
In contrast, Fig. 11(e) of the optimum test model shows a more uniform and brighter distribution, with daylight extending into the deeper portions of the space. This demonstrates the effectiveness of the HLP configuration in improving daylight delivery and achieving balanced lighting conditions throughout the room.
4.1.2. Spatial daylight autonomy
The base model results showed that sDA300/50% was 38.4%, indicating that only 38.4% of the studied library floor area achieved the required illuminance of 300 lux or more during occupied hours. Table 4 shows that the sDA300/50% range for the test models varied from 36.02% to 80.12%. The test models with HLP integration had an average sDA300/50% of 70.53 % with a standard deviation of 11.36 %, indicating that the sDA300/50% values remained within a consistent range across the configurations. By introducing the HLP system, the sDA300/50% improved by more than 40 % compared to the base case.
According to LM-83 guidelines, lighting designers should aim to achieve sDA300/50% values of 75% or higher in regularly occupied spaces, such as classrooms or open-plan offices, and at least 55% in areas where daylight is important [67]. While the base model of the case library building fell well below this benchmark, the optimum HLP test model reached an sDA300/50% of 80.12 %, thereby meeting the preferred daylighting standard for regularly occupied spaces.
The increase in sDA300/50% can be attributed to the HLP's capture and diversion of daylight into the library's deeper zones. This effect was particularly important for the studied space, as the case library building was a deep-plan building and daylight from the north facade was obstructed by surrounding vegetation, making it difficult to achieve sufficient illumination naturally. As a result, artificial lighting is typically used throughout the day.
In Fig. 11(d) and Fig. 11(f), the green zone highlights the areas that meet the required illuminance threshold. The base model (Fig. 11(d)) shows limited daylight penetration, especially in the central portion of the room. In contrast, the optimal test model (Fig. 11(f)) shows a much larger green-marked zone covering the entire space. This indicates that the HLP configuration significantly enhanced daylight autonomy compared to the base model.
4.1.3. Annual sunlight exposure
The base model results showed that ASE1000,250h was 3.4%, indicating that only a small portion of the library floor received excessive direct sunlight that could cause glare or increase cooling loads. This value was already well below the LM-83 threshold of 10 % [67], suggesting that the base condition did not suffer from critical daylight-related visual discomfort. For the test models with HLP integration, ASE1000,250h values ranged from 0.62% to 6.83%, with an average of 1.99% and a standard deviation of 2.30%, confirming that ASE1000,250h remained consistently low across different parameter configurations. The ASE1000,250h distribution from the parametric simulations is shown in Fig. 12(a).
Figure 12
Fig. 12. (a) ASE1000,250h distribution in 1100 MOO simulations. (b) Distribution of ASE1000,250h in the base model. (c) Distribution of ASE1000,250h in the optimum test model.
In the optimum test model, ASE1000,250h was further reduced to 0.62 %, demonstrating the strong shading effect of the HLP inlet design. The aperture portion of the pipe served not only as a collector but also as an effective shading device, limiting direct sunlight penetration near the facade. This shading potential helped decrease the fraction of floor space exposed to direct illuminance above 1000 lux for over 250 occupied hours per year.
The orange zones in Fig. 12(b) and Fig. 12(c) illustrate the ASE1000,250h distribution. In the base case (Fig. 12(b)), some areas near the window showed direct sunlight exposure, while in the optimum test model (Fig. 12(c)), the orange zone was minimal. This outcome indicated that integrating HLP further reduced ASE1000,250h, improving overall visual comfort while maintaining controlled daylight levels throughout the space.
4.2. Comparison of energy metrics
This section compares the energy performance of the base model and the test models of the case library building reading space. The base model simulation yielded a total EUI of 83.17 kWh/(m2y), including equipment, lighting, and cooling loads, while heating was not considered due to Dhaka’s climatic conditions.
For the HLP-integrated test models, the EUI ranged between 71.01 kWh/(m2y) and 72.99 kWh/(m2y), with an average of 72.00 kWh/(m2y) and a standard deviation of 1.40 (Fig. 13). This demonstrated that the results were consistent and within a narrow range. Compared to the base case, the optimum HLP configuration reduced annual energy consumption by more than 11 kWh/(m2y), underlining the system’s potential to enhance energy efficiency.
Figure 13
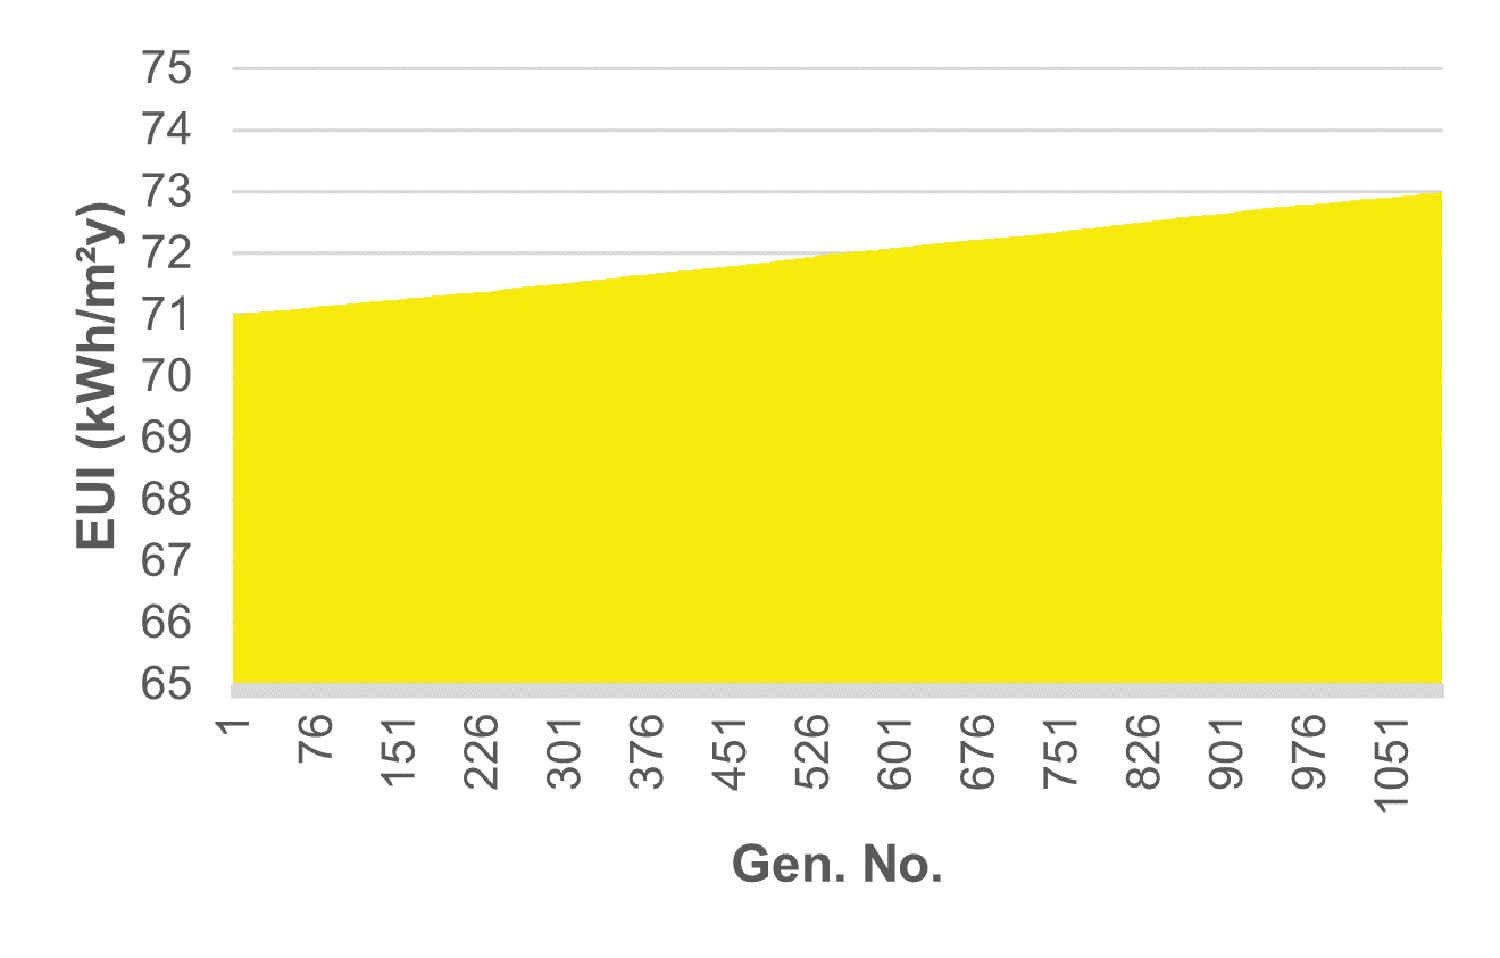
Fig. 13. EUI distribution in 1100 MOO simulations.
A decrease in artificial lighting demand mainly drove the reduction in energy use, as the HLP system improved daylight penetration into the library's deeper zones. This reduction in lighting also helped lower cooling loads, while equipment loads remained constant across all scenarios. The findings indicated that integrating HLP not only improved daylight availability but also reduced energy demand, making it an effective design strategy for achieving energy-efficient library spaces in tropical climates.
4.3. Formulation of optimization objectives
MOO uses iterative simulation to evaluate multiple outcomes simultaneously and identify optimal design preferences. A lot of data is produced during the optimization process, which necessitates careful examination. Simulation results are ranked and analyzed using a variety of methods, including the Pareto Front, Fitness Functions, and Design Explorer analysis. In this study, MOO was applied to assess trade-offs between daylight quality and energy efficiency for the case library building reading room. Through iterative simulations, a range of design alternatives was generated, each evaluated against multiple criteria, and ranked to highlight the most promising solutions.
The identification and ranking of simulation outcomes were performed using the fitness function, which has been widely applied in building performance [68]. The fitness function is an effective approach because it normalizes each performance metric, preventing any single indicator from dominating the results, and enabling meaningful comparisons. The optimization in this study focused on maximizing mean illuminance and sDA300/50%, while minimizing ASE1000,250h and EUI. These indicators represent the trade-offs between providing adequate daylight, avoiding excessive glare, and reducing energy demand.
The optimization process was conducted in Grasshopper using the Octopus plug-in, which applies evolutionary algorithms such as strength pareto evolutionary algorithm 2 (SPEA-2) and hypervolume-based evolutionary algorithm (HypE) to generate and maintain a diverse Pareto Front [57,58]. The Pareto Front provides a set of balanced solutions in which improving one metric may compromise another, allowing decision-makers to select outcomes that best align with project goals [57].
In this research, equal weight was assigned to sDA300/50% and ASE1000,250h, as both were considered equally important for ensuring adequate daylight while avoiding excessive direct sunlight. Mean illuminance was assigned half the weight of sDA300/50%, as increasing illuminance directly supports daylight autonomy. Given that the variation in EUI among test models was relatively small, EUI was also assigned half the weight of the daylight metrics. This weighting approach aligns with methods suggested by Marler and Arora [70] and Kumar et al. [71]. So, w1 = 2, w2 = 2, w3 = 1, and w4 = 1. The fitness function can be written as Equation (9).
w = weightage, i = iteration number, min = minimum value of the indicator, and max = maximum value of the indicator,
\( C_1=\frac{100}{{sDA}_{max}-{sDA}_{min}} \) ; \( C_2=\frac{100}{{ASE}_{max}-{ASE}_{min}} \) ; \( C_3=\frac{100}{{\rm \operatorname{MI}}_{max}-{\rm \operatorname{MI}}_{min}} \) ; \( C_4=\frac{100}{{EUI}_{max}-{EUI}_{min}} \).4.4. Result of optimization
A comparison of the Pareto Front solutions was conducted to examine how different HLP configurations influenced daylight distribution and energy performance in the case library building. On a Pareto Front, each highlighted solution is non-dominated, meaning no objective can be improved without worsening at least one other objective [72].
In this study, the highlighted points in Fig. 14 represent genomes that simultaneously maintain illuminance, maximize sDA300/50%, satisfy ASE1000,250h limits, and minimize EUI, thereby representing the best attainable trade-offs among the studied genomes. Their status is supported by their superior composite fitness function values.
Figure 14
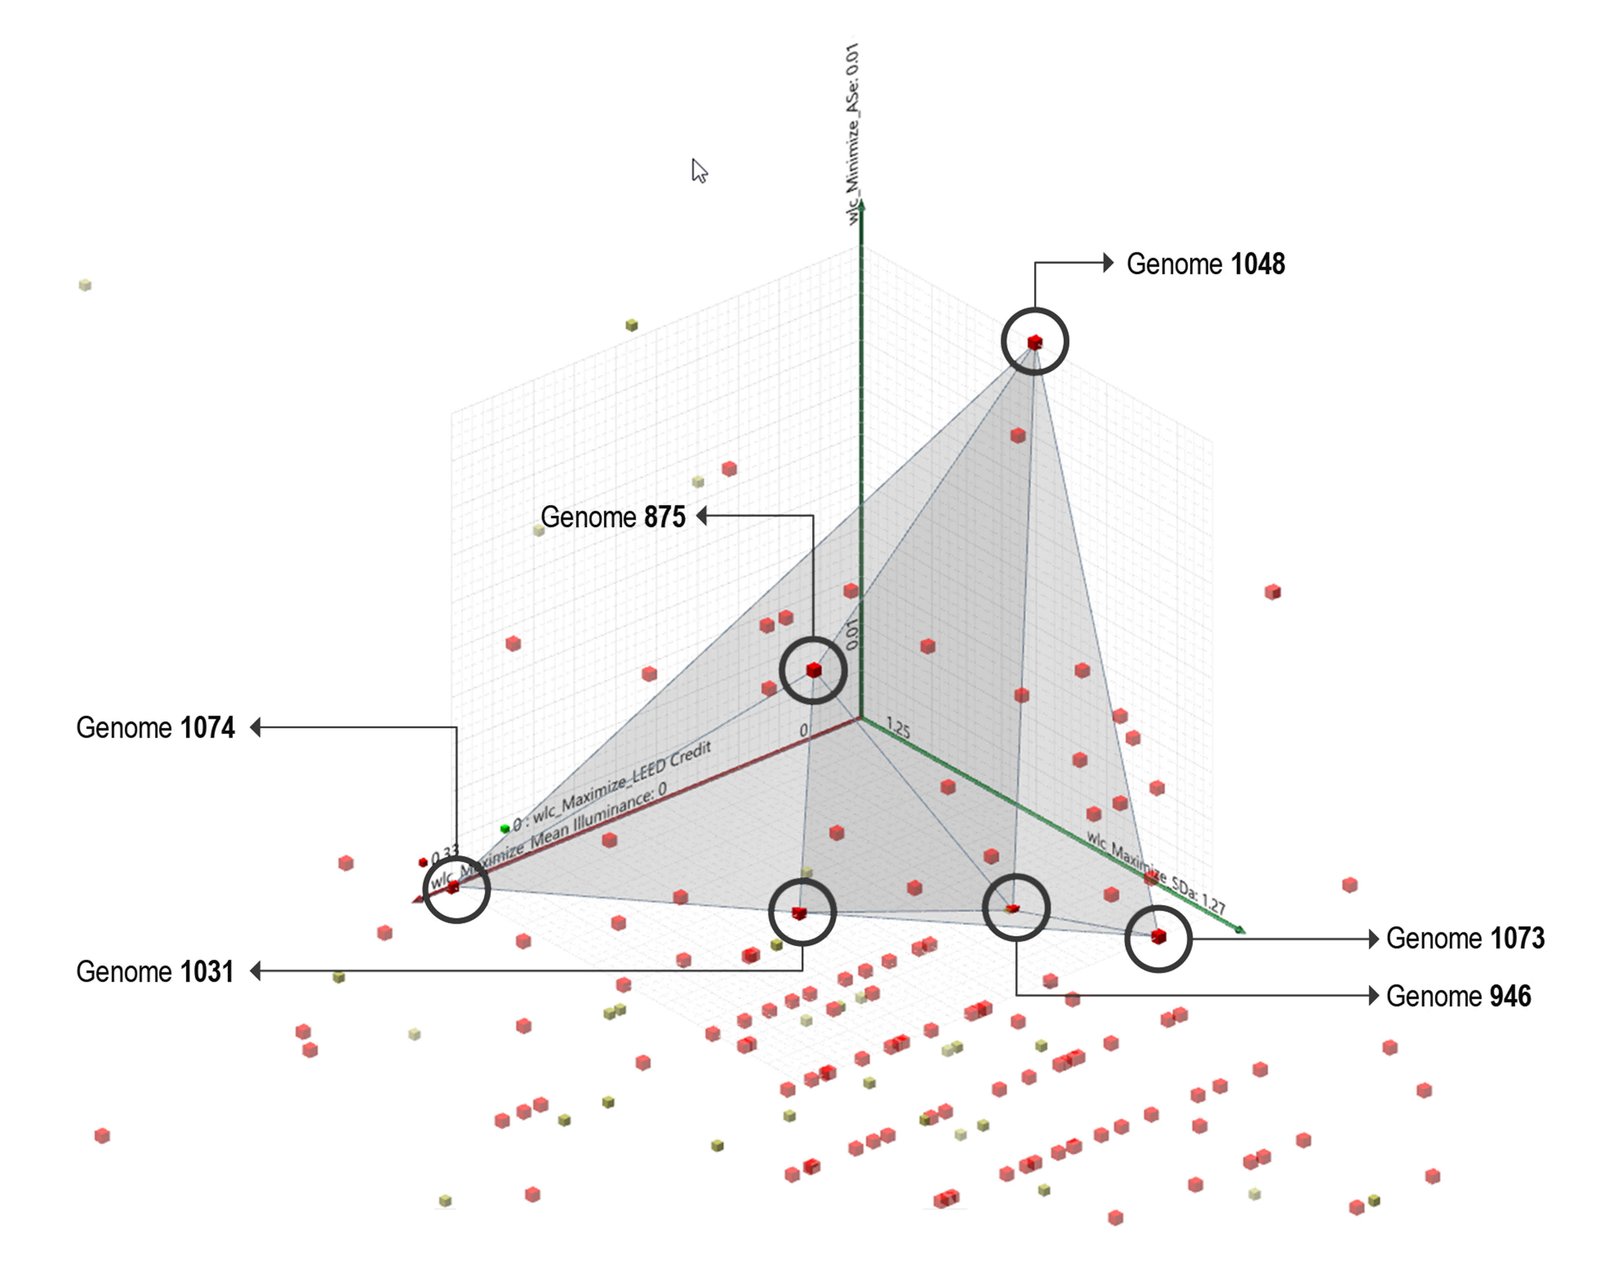
Fig. 14. Pareto front solutions of the most optimized genomes in the MOO process.
4.4.1. The Best Mean Illuminance Genome
From the 1100 simulation runs, the four highest mean illuminance values were identified during the optimization process (Table 5). These models achieved illuminance levels ranging from 884 to 898 lux, significantly higher than those in the remaining simulation runs.
Table 5
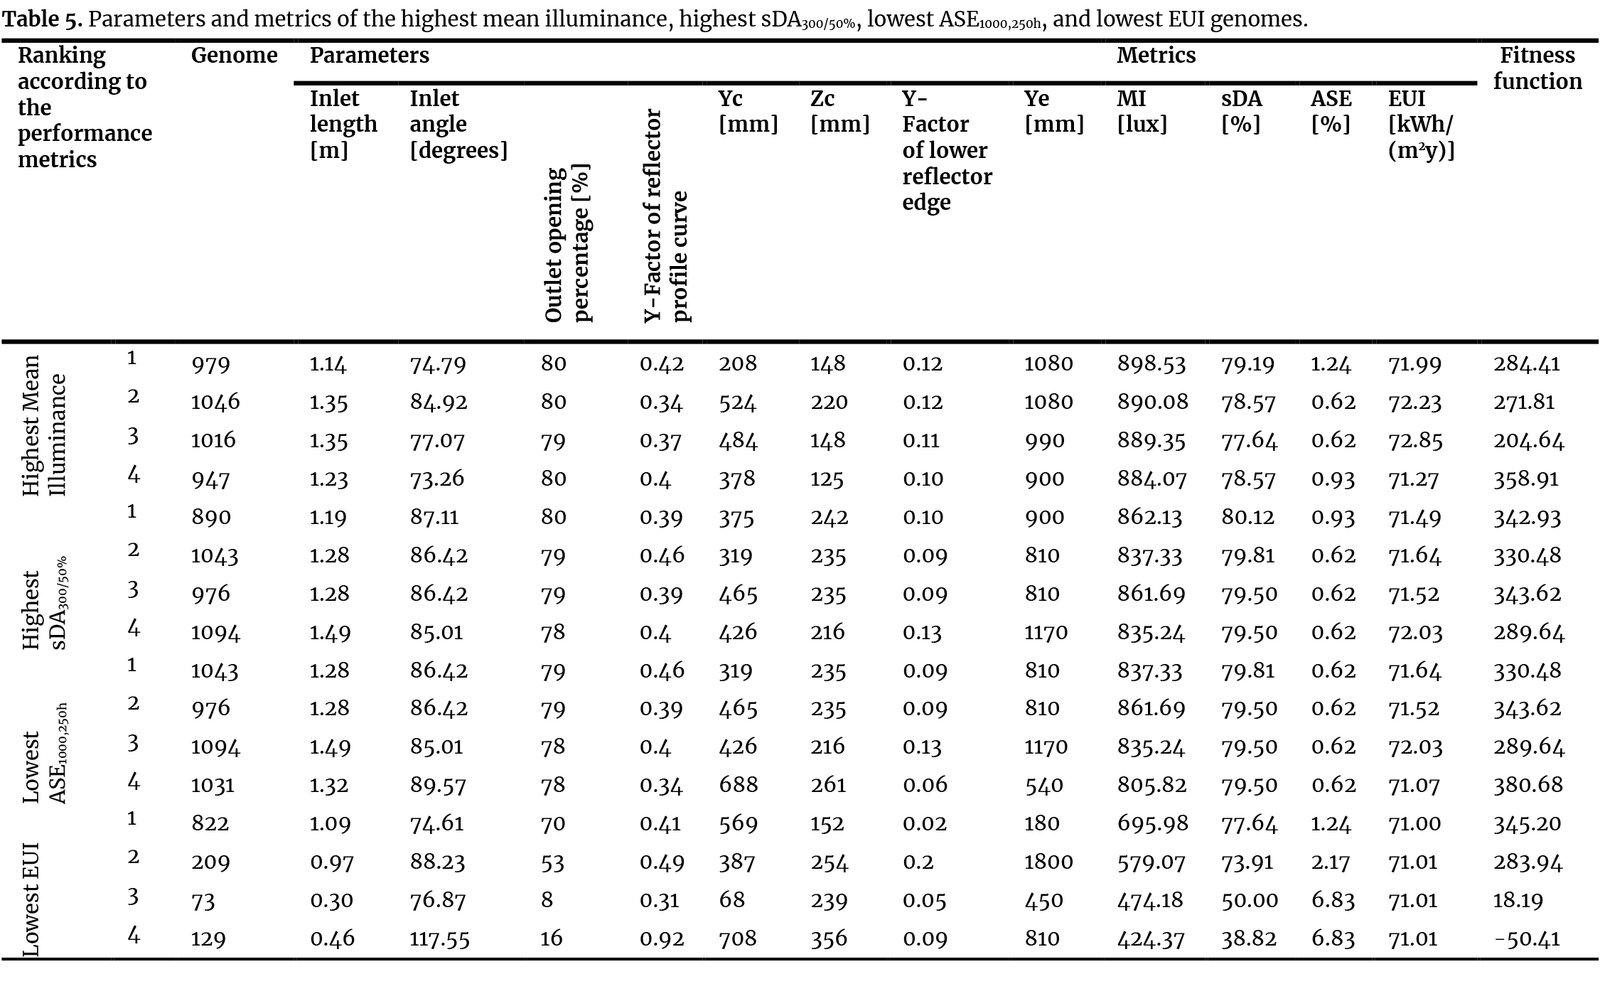
Table 5. Parameters and metrics of the highest mean illuminance, highest sDA300/50%, lowest ASE1000,250h, and lowest EUI genomes.
Despite their strong performance in illuminance, none of the top four genomes were included in the overall top 15 optimum solutions (Table 6) that achieved the highest fitness function values above 372. The highest fitness function among these four was 358.91 for genome 947, which is still notably lower than the top-ranked genomes in Table 5. This outcome highlights that while maximizing illuminance alone improves brightness, other daylighting and energy metrics must be considered simultaneously to reach a balanced optimum.
Table 6
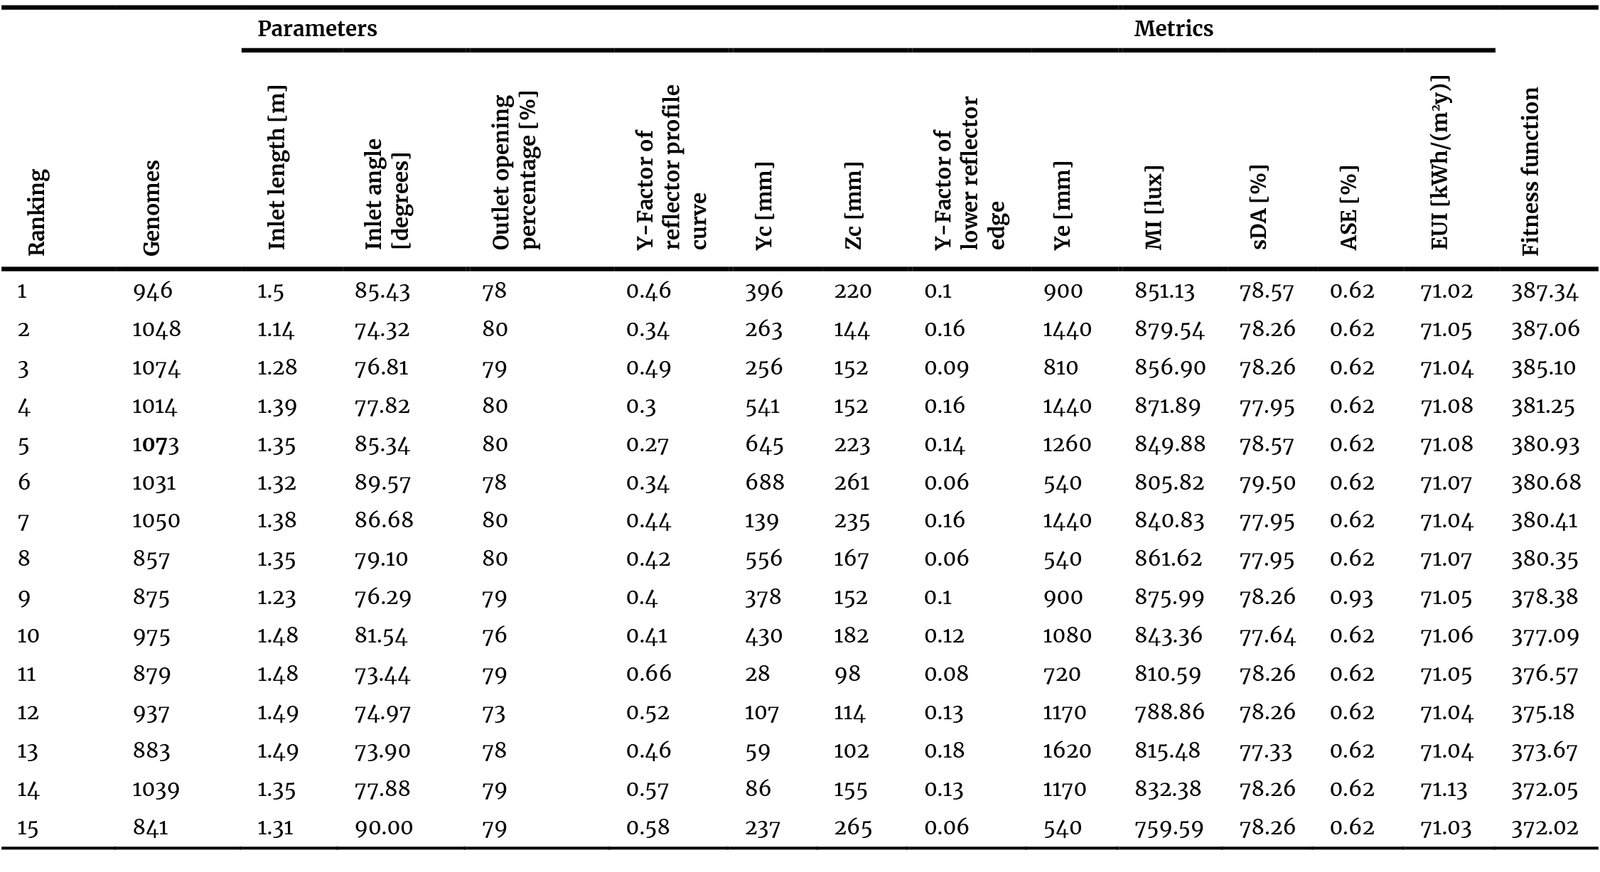
Table 6. Genomes with the highest fitness function value.
4.4.2. The best sda300/50% genomes
The four highest sDA300/50% values were obtained out of the 1100 runs, with results ranging from 79.5% to 80.12% (Table 5). These models outperformed most other configurations in spatial daylight autonomy, indicating that a substantial portion of the library floor area consistently met the required illuminance. Among them, genome 890 produced the best outcome (862.13 lux) but still did not enter the top 15 solutions (Table 6). This suggests that while higher sDA300/50% improves daylight coverage, optimization requires balancing with ASE1000,250h and EUI to produce more robust overall performance. Analysis of top-ranked genome data reveals that longer inlet lengths positively correlate with sDA300/50% and negatively with ASE1000,250h. Longer inlets increase the collection area exposed to the southern sky, allowing more daylight into the pipe and deep library space, boosting spatial daylight autonomy. Simultaneously, the extended inlet acts as an external shading device over the windows below, aligning with the shading-collection interplay in HLP research [11,23]. This shading effect limits direct solar penetration near the facade, contributing to the low ASE1000,250h values seen in the optimal genomes. The inlet angle, determining the reflector's tilt, influences which part of Dhaka's tropical sun path is most effectively captured. Angles between 74° and 86° frequently appear in top solutions, suggesting that a near-vertical to moderately tilted reflector best intercepts the high solar altitudes typical of Dhaka's climate at 23.8°N latitude. The outlet opening percentage reveals a clear trade-off: lower percentages reduce both sDA300/50% and ASE1000,250h by restricting the aperture through which collected light exits into the room, while higher percentages (78–80%) maximize light transmission to the reading plane while maintaining a functional reflective pipe interior. The reflector curvature parameters (ye, yc, zc) are highly sensitive to inlet length and angle, dictating that the curved outlet reflector aligns with the collection geometry to precisely direct light onto the 0.75 m reading plane. The narrow parameter ranges of top solutions confirm that reflector curvature is a conditionally dependent, geometrically specific variable: once inlet length and angle are fixed at their optimal values, the curvature converges to a profile that maximizes daylight projection downward.
4.4.3. The best ASE1000,250h genomes
Among the 1100 solutions tested, the four lowest ASE1000,250h values were identified (Table 5). These models showed only 0.62% of the case library floor area receiving excessive direct daylight during occupancy hours, remaining well below the LM-83 guideline threshold of 10%. Such low ASE1000,250h values indicate strong glare control and reduced risks of visual discomfort. Three of these four genomes did not appear in the top 15 solutions (Table 6), as their fitness function values were comparatively lower due to trade-offs with other daylighting metrics. Genome 1031 (ASE4) achieved both a minimum ASE1000,250h of 0.62% and a fitness function of 380.67, ranking 6th in the overall optimization results (Table 6). This demonstrates that while minimizing ASE1000,250h alone does not guarantee high optimization performance, certain configurations can balance glare reduction with sufficient illuminance and sDA300/50%.
4.4.4. The best EUI genomes
Out of the 1100 optimization runs, four genomes with nearly identical minimum EUI values [71.00–71.01 kWh/(m2y)] were identified (Table 5). Among them, the lowest EUI was achieved by genome 822 (EUI1), with a value of 71.00 kWh/(m2y). This genome also recorded the highest fitness function value of 345.20 among the top four EUI solutions. Despite this, none of the four lowest-EUI genomes were included in the top 15 overall solutions (Table 6), as their fitness function scores fell short of those of other genomes that balanced daylighting and energy metrics more effectively. The narrow range of EUI values shows that small improvements in EUI alone do not ensure a completely optimal solution. To achieve meaningful performance improvements, different daylighting metrics, such as sDA300/50% and ASE1000,250h, must also be considered alongside EUI.
4.4.5. The best optimum genomes
The Octopus simulation ran 1100 combinations to identify optimal solutions on the Pareto Front, balancing sDA300/50%, ASE1000,250h, and EUI. The top-ranked solution was genome 946, with a fitness function of 387.34 (Table 5). This genome achieved a mean illuminance of 851.13 lux, sDA300/50% of 78.57%, ASE1000,250h of 0.62% and EUI of 71.02 kWh/(m2y), showing a significant improvement compared to the base model, which recorded a mean illuminance of 393 lux, sDA300/50% of 38.4%, ASE1000,250h of 3.4%, and EUI of 83.17 kWh/(m2y).
Across the top 15 genomes, the performance remained closely clustered. The sDA300/50% values ranged between 77.33% and 79.50%, and the solutions exceeded the 75% threshold, thereby fulfilling the LEED v4 daylight credit requirement for three (3) points, while values between 55% and 74% would correspond to two (2) points. ASE1000,250h remained at 0.62% across nearly the top solutions, with only genome 875 recording 0.93%. Even this higher value is far below the LM-83 guideline threshold of 10%, confirming that the optimized models effectively eliminate excessive glare risks. Mean illuminance varied between 759.59 lux and 879.54 lux, with the highest value achieved in genome 1048 (879.54 lux, fitness function 387.06), while genome 946 attained 851.13 lux, indicating that higher illuminance alone did not guarantee the highest fitness outcome. EUI values also showed little variation, ranging from 71.02 to 71.13 kWh/(m2y), ensuring consistently energy-efficient performance across the top solutions. The narrow spread of sDA300/50%, ASE1000,250h, and EUI across the Pareto Front results can be attributed to the optimization setup, where a population size of 100 and 10 generations produced 1000 runs, with an additional 100 generated internally by Octopus, leading the solutions to converge and reduce variability among genomes. The convergence of the optimization process, as described in Section 3.4, is further confirmed by the tight parameter clustering observed across the top 15 Pareto Front solutions (Table 6). The results show that Genome 946 and Genome 1048 constitute the most balanced solutions, exhibiting closely matched values across MI, sDA300/50%, ASE1000,250h, and EUI. Both genomes deliver comparable performance in optimizing daylight autonomy, minimizing sunlight exposure, and reducing energy demand relative to the base case.
4.5. Analysis in design explorer
Design Explorer is an open-source digital platform that enables the visualization of numerous design alternatives. It allows users to interactively filter and compare outcomes across a wide range of parameters, making it particularly useful in parametric and optimization-based studies [73]. In this research, Design Explorer was employed to identify the configurations of the HLP system that could best balance daylighting and energy metrics. The earlier analysis based on fitness function values yielded the top solutions, and Design Explorer was then used to verify and compare them. The dataset of 1,100 simulations was uploaded to the Design Explorer platform to generate graphical representations of parameters and performance metrics.
Figure 15(a) illustrates the simulated combinations of HLP parameters and their resulting metrics. In this view, the red lines correspond to weaker-performing genomes, while the blue lines highlight the more successful configurations. Fig. 15 (b) shows the first filtered set, where solutions meeting the LEED criterion of sDA300/50%≥75% were selected, fulfilling the LEED v4 daylight credit thresholds, with ≥75% achieving three (3) LEED points. Fig. 15(c) adds the constraint of ASE1000,250h ≤1%, thereby filtering solutions to those that achieve high daylight sufficiency without introducing excessive glare risk.
Figure 15
![(a) 1100 solutions from Octopus MOO in Design Explorer. (b) Selection of the targeted sDA300/50% range (sDA300/50% above 75%). (c) Selection of the targeted ASE1000,250h range (ASE1000,250h less than 1%). (d) Selection of the targeted mean illuminance range (mean illuminance more than 850 lux). (e) Selection of the targeted EUI range [EUI less than 71.25 kWh/(m²y)].](figures/13-227-15.jpg)
Fig. 15. (a) 1100 solutions from Octopus MOO in Design Explorer. (b) Selection of the targeted sDA300/50% range (sDA300/50% above 75%). (c) Selection of the targeted ASE1000,250h range (ASE1000,250h less than 1%). (d) Selection of the targeted mean illuminance range (mean illuminance more than 850 lux). (e) Selection of the targeted EUI range [EUI less than 71.25 kWh/(m²y)].
Figure 15(d) further narrows the selection by requiring mean illuminance ≥850 lux, ensuring that the retained solutions deliver consistently higher indoor light levels. Fig. 15(e) applies the final filter, imposing an energy requirement of EUI ≤ 71.25 kWh/(m2y). This results in the final 12 solutions that met the four objectives: mean illuminance, sDA300/50%, ASE1000,250h, and EUI. These final solutions were exported into a spreadsheet for detailed comparison with the earlier fitness function results.
Figure 15(e) also demonstrates that the variable parameters tended to cluster within certain ranges for the top-performing 12 combinations. For instance, the inlet length ranged from 1.14 to 1.50 m, the outlet opening percentage ranged from 78% to 80%, and the inlet angle was concentrated between 74° and 86°. Similarly, the reflector geometry parameters showed a tendency toward consistent values, with yc ranging from 260 to 650 mm, zc from 144 to 223 mm, and ye from 900 to 1440 mm.
The parameters and performance metrics of these 12 genomes are summarized in Table 7. Their fitness function values range from 354.43 to 387.34, with seven genomes overlapping with the top 15 Pareto Front solutions identified earlier. These are genomes 946, 1048, 1074, 1014, 1073, 857, and 875, which ranked 1, 2, 3, 4, 5, 8, and 9, respectively, in the fitness-function-based analysis (Table 6 and 7). This strong overlap confirms the reliability of the selected solutions. Overall, Design Explorer screening confirms the Pareto-front outcomes while highlighting a consistent set of parameter ranges that deliver optimal results. These solutions achieve high sDA300/50% (meeting the LEED daylight credit thresholds), low ASE1000,250h, and minimal EUI, demonstrating the effectiveness of the optimized HLP design.
Table 7
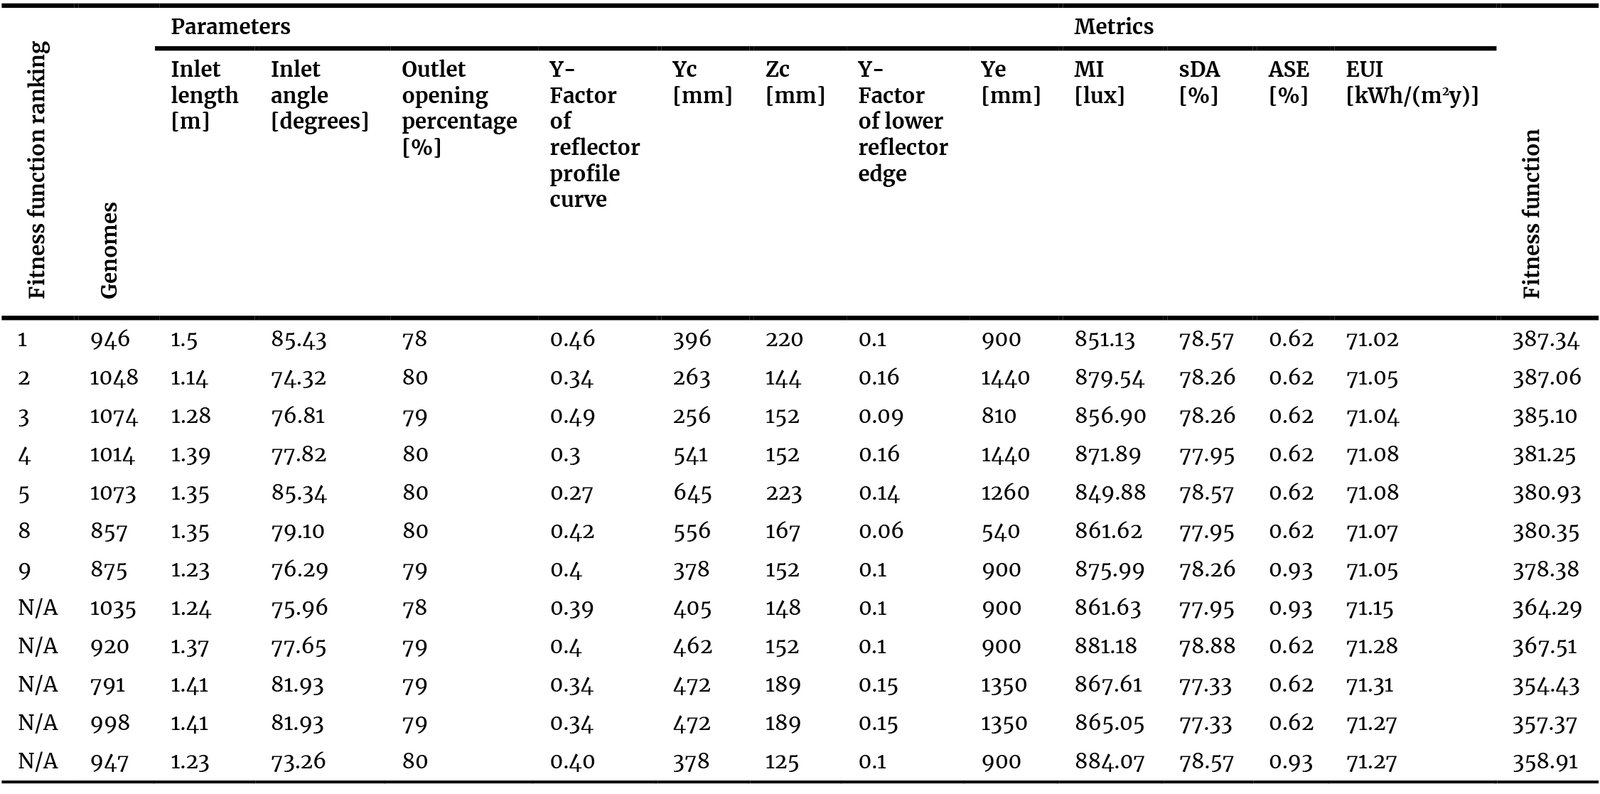
Table 7. The best optimum solutions found by Design Explorer.
4.6. The most feasible HLP system configuration
The most feasible HLP system configuration was identified from the Pareto Front results, where the fitness function was used to select the top 15 solutions. Among these, Genome 946 ranked first, achieving a fitness function value of 387.34, closely followed by Genome 1048 with a fitness value of 387.06. The performance of these two genomes is remarkably similar, with both configurations yielding almost identical results for daylight autonomy, glare control, and energy efficiency. This similarity in performance indicates that both genomes are highly effective, but the slight fitness advantage goes to Genome 946. When considering practical application and building regulations, Genome 1048 emerges as the more feasible solution.
Genome 1048 produced a mean illuminance of 879.54 lux, substantially higher than the base model value of 393 lux. It achieved an sDA300/50% of 78.26%, indicating that more than three-quarters of the floor area consistently received the required 300 lux or more during occupied hours. The ASE1000,250h value was maintained at 0.62%, ensuring effective glare control, well below the LM-83 guideline of 10%. The EUI for Genome 1048 was 71.05 kWh/(m2y), representing a reduction of more than 12 kWh/(m2y) compared to the base model with 83.17 kWh/(m2y). Collectively, these values demonstrate a balanced improvement in daylight autonomy, glare control, and energy efficiency comparable to Genome 946, but with a more practical inlet length for implementation.
While Genome 946 stands out for its high fitness score, Genome 1048, with a slightly lower fitness value, offers a more workable solution for real-world applications. Genome 946’s inlet length of 1.50 m, which is at the upper limit of the parameter settings, could potentially present challenges in terms of building regulations or setbacks. In contrast, Genome 1048’s inlet length of 1.14 m is more compatible with typical building codes, making it a more feasible option despite its near-identical performance.
The parameters of the most feasible HLP configuration, Genome 1048, were as follows: inlet length of 1.14 m, inlet angle of 74.32°, outlet opening percentage of 80%, horizontal distance of curve center point (yc) of 263 mm, vertical distance of curve center point (zc) of 144 mm, and horizontal distance of curve end point (ye) of 1440 mm. With these parameter values, the system achieved highly balanced daylighting and energy metrics, making Genome 1048 the optimal solution for the case building reading room (Fig. 16).
Figure 16
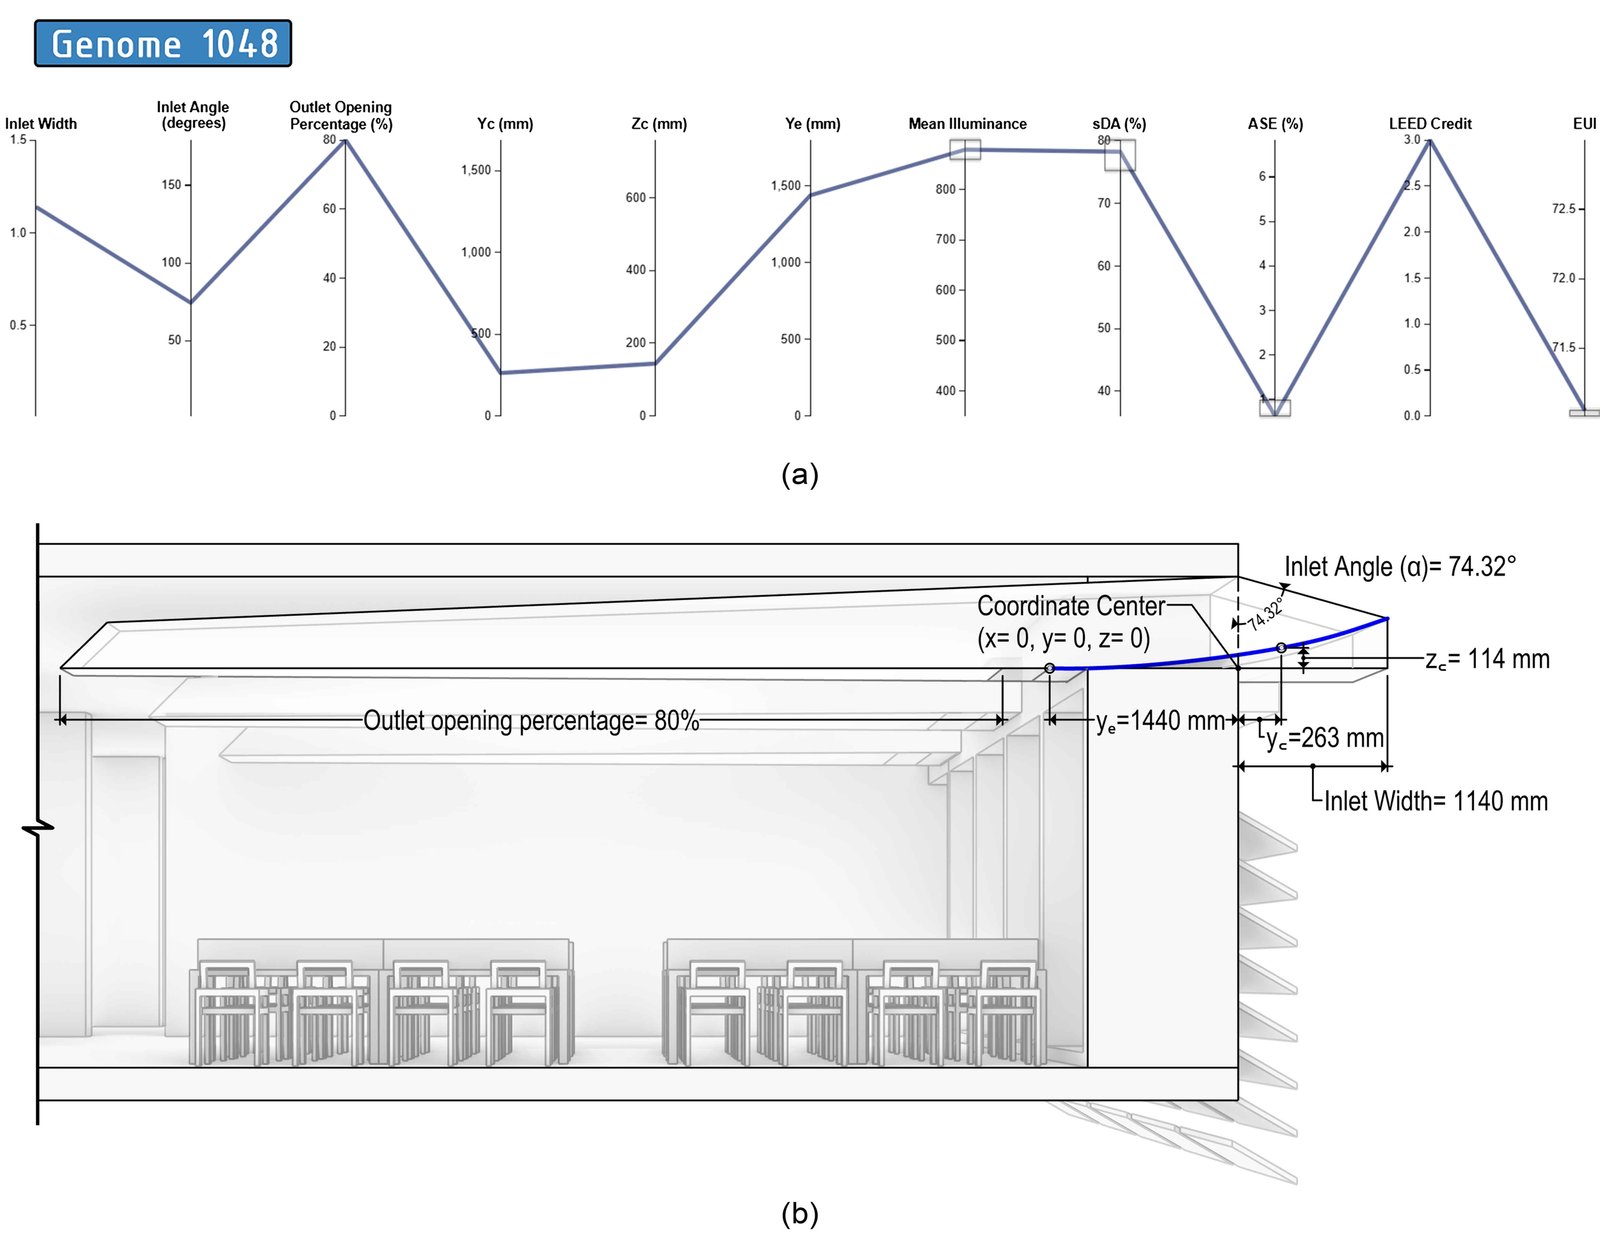
Fig. 16. (a) Design Explorer parallel coordinate plot of Genome 1048. (b) Parameters of the optimum HLP solution (Genome 1048) identified through fitness function and Design Explorer analysis.
5. Discussion
In this study, the fitness function was applied to evaluate 1,100 HLP simulation runs and identify the top 15 solutions. The base model of the case library space achieved 393 lux mean illuminance, 38.4% sDA300/50%, and 3.4% ASE1000,250h, which failed to meet daylighting benchmarks. In contrast, the optimized solutions achieved a mean illuminance reaching 898 lux, up to 80.12% of sDA300/50%, with ASE1000,250h reduced to 0.62%.
Energy performance also improved, with EUI values converging between 71.02~71.13 kWh/(m2y), compared to 83.17 kWh/(m2y) in the base case. This demonstrates that the HLP system substantially increased daylight autonomy and reduced energy demand while controlling glare.
ASE1000,250h remained consistently low in the optimized genomes, far below the LM-83 threshold of 10%. While some solutions produced slightly higher illuminance (e.g., 879 lux), they did not necessarily achieve overall fitness. This indicates that optimization depends on balancing daylighting and energy metrics rather than maximizing a single parameter.
According to LEED v4.1 daylighting criteria, spaces achieving sDA300/50% ≥75% with ASE1000,250h ≤10% qualify for three (3) points, while 55 to 74% sDA300/50% earns two (2) points. The base model earned no points, but the top 15 genomes exceeded 75% sDA300/50% and maintained ASE1000,250h below 1%, fulfilling the maximum three (3) point requirement. Verification with Design Explorer confirmed these results, with 12 final genomes overlapping strongly with the Pareto Front outcomes (Table 5) and showing consistent parameter ranges (inlet length 1.14 to 1.50 m, inlet angle 74° to 86°, outlet opening 78 to 80%). This convergence highlights the robustness of the optimization process. The optimized HLP configurations nearly doubled daylight autonomy, minimized sunlight exposure, and reduced annual energy use by over 11 kWh/(m2y) compared to the base case. These findings confirm the potential of parametric optimization in delivering LEED-compliant daylighting and energy efficiency in deep-plan library spaces.
The results of this study can be contextualized by comparison with other recent works on daylighting optimization in deep-plan and tropical buildings. In a similar study focused on the parametric optimization of anidolic ceiling systems for a deep-plan tropical office space, using the same simulation tools (Rhinoceros, Grasshopper, ClimateStudio, and Octopus), the best configurations reached sDA values between 20.51% and 68.18%, while reducing ASE from 15.83% to 8.52%. The EUI ranged from 189.3 to 174.0 kWh/(m2y) [15]. While the sDA range in that study is lower and the ASE higher compared to the present findings (sDA 77.33% to 80.12%, ASE 0.62% to 0.93%, EUI 71.02 to 71.13 kWh/(m2y)), this difference is attributed to the distinct nature of the two daylighting systems: the anidolic ceiling system primarily redirects diffuse daylight inward from the ceiling, whereas the HLP actively transports daylight deeper into the plan through a reflective pipe, making it better suited for achieving higher sDA values in a deep-plan library. Notably, the HLP system achieved considerably lower ASE values, indicating better glare control, which is particularly important in library reading environments.
A study on optimizing lightwell configurations for deep-plan tropical apartment buildings using a comparable MOO framework (Octopus, Radiance, EnergyPlus) reported an improvement in sDA from 0.95% to 44.29% and an EUI reduction from 100.1 to 93.7 kWh/(m2y), with ASE remaining within the acceptable range at 1.9% [74]. The substantially lower baseline sDA in that study (0.95%) reflects the more severely constrained daylight access in residential lightwells compared to a library reading room with perimeter windows, confirming that the building type and baseline condition significantly influence the absolute magnitude of achievable improvement.
For studies specifically involving HLP systems, Obradovic and Matusiak [9] reported that laser-cut panel (LCP) configurations at the HLP inlet increased daylight autonomy (DA300) by up to 19% at 2.1 m from the facade and 16% at 4.5 m depth in a high-latitude location. Although that study used DA instead of sDA and was conducted in a non-tropical climate (Oslo, Norway), the direction of improvement is consistent with the present findings; HLP integration raised sDA from 38.4% in the base case to between 77.33% and 80.12% in the optimized setups. More recently, a study on horizontal daylight tube integration in a deep-plan classroom in a comparable climate achieved the LEED target of sDA ≥55% with ASE ≤10% [75], which is consistent with the present study's top solutions exceeding sDA ≥75% with ASE ≤1%, demonstrating that the HLP system optimized here achieves a significantly higher performance threshold. Collectively, these comparisons confirm that the optimized HLP configurations developed in this study deliver competitive or superior daylighting and energy outcomes relative to other passive daylighting strategies in tropical deep-plan contexts.
From a design guidance perspective, the parameter convergence among the top 15 genomes indicates a useful sensitivity hierarchy for practitioners. Inlet length and outlet opening percentage appear to be the most performance-determining variables: the top solutions consistently occupied the upper end of both ranges (inlet length 1.14 to 1.50 m; outlet opening 78 to 80%), suggesting that maximizing collection area and outlet transmissivity are the most reliable strategies for achieving LEED-compliant sDA in a deep-plan tropical library. The inlet angle showed moderate sensitivity, with optimal values clustering between 74° and 86°, a range corresponding to a near-vertical to moderately inclined reflector, suitable for the high solar altitudes of Dhaka's tropical climate. The reflector curvature parameters showed little variation in the top solutions, indicating that once the inlet geometry is set, the outlet reflector curvature is mainly determined by geometric constraints rather than being freely adjustable. This hierarchy suggests that, in practice, focusing on inlet length and outlet opening when designing HLPs for tropical institutional libraries will yield the greatest performance improvements, while the inlet angle serves as a secondary fine-tuning parameter. These results provide early-stage design guidance aligned with the parametric optimization approach recommended for daylighting system design [29,32].
5.1. Limitations
This study concentrated on the daylighting and energy impact of HLP systems, with the optimization limited to a fixed set of geometric parameters. The inlet and outlet optical properties were assumed constant, although in practice, outlet openings are often equipped with elements such as laser-cut panels or egg-crate reflectors [24]. Future studies could explore new reflector types and their optimum dimensions to improve daylight uniformity. This study considered a single continuous outlet opening along the pipe length, whereas multiple distributed openings could potentially enhance daylight spread. Another limitation is the maximum inlet length, which was capped at 1.5 m using the projection factor method for external shading devices [76]. This limit was applied as a standard value; however, in real design situations, it can vary depending on national regulations, setback provisions, or facade control rules.
The HLP pipe body was designed with a predefined trapezoidal plan form that tapers from 2 m at the inlet to 1 m at the outlet, with a fixed length of 9 m, height of 0.70 m, and a constant pipe cross-section profile in the vertical plane. These dimensions were determined based on proportional standards in the HLP literature [12,24,77] and the spatial constraints of the case building. The taper slope angles of both the horizontal plan profile and the vertical pipe profile were not considered as optimization variables in this study. Since the pipe length was fixed to match the room depth, and inlet and outlet widths were based on established HLP configurations, including the taper angles as additional variables would have greatly increased the parametric solution space and the computational effort required for the optimization. This represents a known limitation, and including these slopes as variables in future studies could yield further performance improvements.
Another limitation of this study is the absence of independent energy model validation against measured energy consumption data. While the EnergyPlus™ engine embedded in ClimateStudio has been extensively validated globally, the lack of site-specific metered energy data for the case building's reading room prevents calibration of the energy model at the space level. This limits the energy results to relative comparative use and should be addressed in future research through collaboration with institutions that provide granular, sub-metered energy consumption records.
5.2. Future Scope
The methodology developed in this study could be extended to other building typologies such as offices, classrooms, and hospital wards, and to HLP systems serving different facade orientations, to evaluate the robustness of the parametric optimization approach across a broader range of contexts. While this study addresses a tropical climate (Dhaka, Bangladesh), the optimization framework could be applied to buildings in subtropical, temperate, or arid climates to examine how climate-responsive HLP configurations affect daylighting and energy performance under different solar and sky conditions.
The study assumed a rectangular or trapezoidal pipe section; alternative shapes, such as semicircular, triangular, or polygonal forms, could be tested parametrically to assess their performance. Future research might also extend the inlet length parameter to account for varying regulatory conditions, which could influence optimization results.
Additionally, further studies could utilize other optimization tools, such as Ladybug and Wallacei, and incorporate additional daylighting metrics such as daylight factor (DF), uniform daylight factor (UDF), useful daylight illuminance (UDI), and daylight glare probability (DGP) to provide a more comprehensive assessment of daylight quality and comfort. These avenues would contribute to a deeper understanding of how HLP systems can improve daylight quality and overall building energy efficiency.
6. Conclusion
This study confirmed that the baseline condition of the case building reading room offered inadequate daylight levels, leaving the space highly dependent on artificial lighting. By applying a multi-objective optimization approach to HLP systems, significant improvements in daylight availability, glare control, and energy performance were achieved.
In the optimized solution, mean illuminance levels improved from 393 lux to 851~879 lux across the top-performing genomes, ensuring consistent compliance with recommended indoor lighting standards. The optimized solutions nearly doubled the sDA300/50% from 38.4% to above 78%, while maintaining ASE1000,250h well below LM-83 thresholds (0.62% compared to 3.4% in the base model). At the same time, EUI dropped from 83.17 kWh/(m2y) in the base case to approximately 71 kWh/(m2y), reflecting a reduction of over 11 kWh/(m2y). These results confirm that HLP systems can simultaneously deliver high-quality daylight and enhance energy efficiency in deep-plan library spaces. Among the optimized set, Genome 1048 emerged as the most feasible configuration, achieving a mean illuminance of 879.54 lux, sDA300/50% of 78.26%, ASE1000,250h of 0.62%, and EUI of 71.05 kWh/(m2y). The Design Explorer validation further confirmed these outcomes, reinforcing confidence in the optimization process's stability. The research illustrated the potential of HLP integration in tropical institutional buildings as an effective strategy for achieving climate-responsive daylighting and lowering energy demand. Beyond the specific case, the methodology highlights how parametric optimization can guide design decisions that harmonize daylight quality, occupant comfort, and building performance.
Funding
This research received no external funding.
Acknowledgement
The authors would like to thank Solemma for providing an educational license for ClimateStudio. Special thanks are also extended to the Department of Architecture at Bangladesh University of Engineering and Technology (BUET) for granting access to multiple UNI-T UT383 Mini Light Meters for the study. During manuscript preparation, the authors used QuillBot to assist with grammar and paraphrasing some parts of the study. The authors have reviewed and edited the output and take full responsibility for the content of this publication.
Author Contributions
Conceptualization, R.N. and M.A.R.J.; methodology, R.N. and M.A.R.J.; software, R.N. and M.A.R.J.; validation, R.N.; formal analysis, R.N. and M.A.R.J.; investigation, R.N.; resources, R.N. and M.A.R.J.; data curation, R.N.; writing—original draft preparation, R.N.; writing—review and editing, M.A.R.J.; visualization, R.N. and M.A.R.J.; supervision, M.A.R.J. All authors have read and agreed to the published version of the manuscript.
Declaration of competing interest
The authors declare no conflict of interest.
Supplementary information
The measurement data, processed spreadsheets, simulation outputs, multi-objective optimization results, Grasshopper scripts related to the Horizontal Light Pipe (HLP) and ClimateStudio workflow, the Rhino model of the BUET Central Library case building, and original unprocessed images are provided as Supplementary Materials and have been deposited on Zenodo: https://doi.org/10.5281/zenodo.19029517 (accessed on 15 March 2026).
References
- L. Edwards, P. Torcellini, Literature Review of the Effects of Natural Light on Building Occupants, National Renewable Energy Lab., Golden, CO. (United States), NREL/TP-550-30769, 15000841, 2002. https://doi.org/10.2172/15000841
- S. Anthony, P. Ogheneyoma, P. Heritage, O. Ayoola, A. Fiyinfoluwa, Daylight Penetration in Build-ings: Issues in Tropical Climates, Solid State Technology, (2020) 276-285.
- Y.-W. Lim, M. H. Ahmad, D. R. Ossen, Internal Shading for Efficient Tropical Daylighting in Malay-sian Contemporary High-Rise Open Plan Office, Indoor and Built Environment, 22:6 (2013) 932-951. https://doi.org/10.1177/1420326X12463024
- G. L. Isoardi, The design and testing of a daylighting device: optimising the energy and optical per-formance of Australian commercial buildings, PhD Thesis, Queensland University of Technology, 2009.
- F. Elsiana, S. N. Ekasiwi, I. G. N. Antaryama, The Effect of Opening Distribution Area Modification on Horizontal Light Pipe Daylight Performance, DIMENSI (Journal of Architecture and Built Environment), 47:1 (2021) 19-26. https://doi.org/10.9744/dimensi.47.1.19-26
- C. Y. S. Heng, Integration of Shading Device and Semi-Circle Horizontal Light Pipe Transporter for High-Rise Office Building in Tropical Climate, Environmental Research, Engineering and Management, 77:4 (2021) 122-131. https://doi.org/10.5755/j01.erem.77.4.29942
- R. A. Mangkuto, F. Feradi, R. E. Putra, R. T. Atmodipoero, F. Favero, Optimisation of daylight ad-mission based on modifications of light shelf design parameters, Journal of Building Engineering, 18 (2018) 195-209. https://doi.org/10.1016/j.jobe.2018.03.007
- M. S. Mayhoub, D. J. Carter, The costs and benefits of using daylight guidance to light office buildings, Building and Environment, 46:3 (2011) 698-710. https://doi.org/10.1016/j.buildenv.2010.09.014
- B. Obradovic, B. S. Matusiak, Daylight autonomy improvement in buildings at high latitudes using horizontal light pipes and light-deflecting panels, Solar Energy, 208 (2020) 493-514. https://doi.org/10.1016/j.solener.2020.07.074
- R. Canziani, F. Peron, G. Rossi, Daylight and energy performances of a new type of light pipe, Energy and Buildings, 36:11 (2004) 1163-1176. https://doi.org/10.1016/j.enbuild.2004.05.001
- F. Elsiana, S. N. N. Ekasiwi, I. G. N. Antaryama, Integration of Horizontal Light Pipe and Shading Systems in Office Building in the Tropics, Journal of Applied Science and Engineering, 25:1 (2021) 231-243.
- C. Y. S. Heng, Y.-W. Lim, D. R. Ossen, Horizontal light pipe transporter for deep plan high-rise office daylighting in tropical climate, Building and Environment, 171 (2020) 106645. https://doi.org/10.1016/j.buildenv.2020.106645
- L. Hariyanto, F. Elsiana, D. S. Mintorogo, Study of Horizontal Light Pipe with Dynamic Reflector in the Tropics, DIMENSI (Journal of Architecture and Built Environment), 49:1 (2022) 75-86. https://doi.org/10.9744/dimensi.49.1.75-86
- F. De Luca, T. Wortmann, Multi-Objective Optimization for Daylight Retrofit, in: Proceedings of the 38th Conference on Education and Research in Computer Aided Architectural Design in Europe (eCAADe), Berlin, Germany, 16-18 September 2020, pp. 57-66. https://doi.org/10.52842/conf.ecaade.2020.1.057
- S. Shoeb, M. A. R. Joarder, Daylighting and energy performance optimization of anidolic ceiling systems for tropical office buildings, Building and Environment, 265 (2024) 112032. https://doi.org/10.1016/j.buildenv.2024.112032
- Z. Shao, Y. Li, P. Huang, A. M. Abed, E. Ali, D. H. Elkamchouchi, M. Abbas, G. Zhang, Analysis of the opportunities and costs of energy saving in lightning system of library buildings with the aid of building information modelling and Internet of things, Fuel, 352 (2023) 128918. https://doi.org/10.1016/j.fuel.2023.128918
- O. Omar, B. García-Fernández, A. Á. Fernández-Balbuena, D. Vázquez-Moliní, Optimization of daylight utilization in energy saving application on the library in faculty of architecture, design and built environment, Beirut Arab University, Alexandria Engineering Journal, 57:4 (2018) 3921-3930. https://doi.org/10.1016/j.aej.2018.10.006
- D. K. Kilic, D. Hasirci, Daylighting Concepts for University Libraries and Their Influences on Users' Satisfaction, The Journal of Academic Librarianship, 37:6 (2011) 471-479. https://doi.org/10.1016/j.acalib.2011.07.003
- M. Roshan, A. S. Barau, Assessing Anidolic Daylighting System for efficient daylight in open plan office in the tropics, Journal of Building Engineering, 8 (2016) 58-69. https://doi.org/10.1016/j.jobe.2016.07.002
- V. Hansen, Natural illumination of deep-plan office buildings: light pipe strategies, eprints.qut.edu.au, (2003).
- S. Singh, M. Thussu, A. Ahmad, Technology Interventions of Daylight for Deep Plan Building, In-ternational Journal for Research in Applied Science and Engineering Technology, 11:4 (2023) 2145-2151. https://doi.org/10.22214/ijraset.2023.50572
- F. Linhart, S. K. Wittkopf, J.-L. Scartezzini, Performance of Anidolic Daylighting Systems in tropical climates - Parametric studies for identification of main influencing factors, Solar Energy, 84:7 (2010) 1085-1094. https://doi.org/10.1016/j.solener.2010.01.014
- F. Elsiana, S. N. N. Ekasiwi, I. Antaryama, The impact of aspect ratio of buildings implementing Horizontal light pipe and shading systems on daylight performance, Journal of Asian Architecture and Building Engineering, 23:5 (2024) 1658-1676. https://doi.org/10.1080/13467581.2023.2278450
- F. Elsiana, F. Soehartono, L. Kristanto, Daylight performance of horizontal light pipe with egg-crate reflector in the tropics, IOP Conference Series: Earth and Environmental Science, 490:1 (2020) 012006. https://doi.org/10.1088/1755-1315/490/1/012006
- C. H. Y. Sern, L. T. K. Liou, S. F. S. Fadzil, Daylighting Performance of Integrated Light Shelf with Horizontal Light Pipe System for Deep Plan High-Rise Office in Tropical Climate, Journal of Daylighting, 9:1 (2022) 83-96. https://doi.org/10.15627/jd.2022.6
- A. A. S. Bahdad, S. F. S. Fadzil, N. Taib, Optimization of Daylight Performance Based on Controllable Light-shelf Parameters using Genetic Algorithms in the Tropical Climate of Malaysia, Journal of Day-lighting, 7:1 (2020) 122-136. https://doi.org/10.15627/jd.2020.10
- V. Machairas, A. Tsangrassoulis, K. Axarli, Algorithms for optimization of building design: A review, Renewable and Sustainable Energy Reviews, 31 (2014) 101-112. https://doi.org/10.1016/j.rser.2013.11.036
- E. Sorooshnia, P. Rahnamayiezekavat, M. Rashidi, M. Sadeghi, B. Samali, Curve Optimization for the Anidolic Daylight System Counterbalancing Energy Saving, Indoor Visual and Thermal Comfort for Sydney Dwellings, Energies, 16:3 (2023) 1090. https://doi.org/10.3390/en16031090
- N. Ziaee, R. Vakilinezhad, Multi-objective optimization of daylight performance and thermal comfort in classrooms with light-shelves: Case studies in Tehran and Sari, Iran, Energy and Buildings, 254 (2022) 111590. https://doi.org/10.1016/j.enbuild.2021.111590
- A. Kirimtat, O. Krejcar, B. Ekici, M. Fatih Tasgetiren, Multi-objective energy and daylight optimiza-tion of amorphous shading devices in buildings, Solar Energy, 185 (2019) 100-111. https://doi.org/10.1016/j.solener.2019.04.048
- D. A. Chi, An Approach to Determine Specific Targets of Daylighting Metrics and Solar Gains for Different Climatic Regions, Journal of Daylighting, 8:1 (2021) 1-19. https://doi.org/10.15627/jd.2021.1
- P. Pilechiha, M. Mahdavinejad, F. Pour Rahimian, P. Carnemolla, S. Seyedzadeh, Multi-objective optimisation framework for designing office windows: quality of view, daylight and energy efficiency, Applied Energy, 261 (2020) 114356. https://doi.org/10.1016/j.apenergy.2019.114356
- Approved method: IES spatial daylight autonomy (sDA) and annual sunlight exposure (ASE), Illu-minating Engineering Society of North America: New York, N.Y., USA, 2012.
- X. Cui, C.-W. Ahn, Multi-Objective Optimization of Natural Lighting Design in Reading Areas of Higher Education Libraries, Buildings, 15:9 (2025) 1560. https://doi.org/10.3390/buildings15091560
- Y. Li, J. He, Evaluating the improvement effect of low-energy strategies on the summer indoor thermal environment and cooling energy consumption in a library building: A case study in a hot-humid and less-windy city of China, Building Simulation, 14:5 (2021) 1423-1437. https://doi.org/10.1007/s12273-020-0747-6
- Z. Dicka, E. Dolnikova, D. Katunsky, The impact of shading by vegetation on the level of daylight in buildings: A case study, E3S Web of Conferences, 550 (2024) 01003. https://doi.org/10.1051/e3sconf/202455001003
- J. M. Monteoliva, A. Villalba, A. Pattini, Daylighting Metrics: an Approach to Dynamic Cubic Illu-minance, Journal of Daylighting, 5:2 (2018) 34-42. https://doi.org/10.15627/jd.2018.6
- A. Atthaillah, A. Bintoro, Useful Daylight Illuminance (UDI) pada Ruang Belajar Sekolah Dasar di Kawasan Urban Padat Tropis [Useful Daylight Illuminance (UDI) in Primary School Classrooms in Dense Tropical Urban Areas], Langkau Betang: Jurnal Arsitektur, 6:2 (2019) 72-86. https://doi.org/10.26418/lantang.v6i2.33940
- Illuminating Engineering Society, 2019 Building Energy Efficiency Standards-Reference Ace v23, 2019.
- O. A. Marzouk, Evolution of the (Energy and Atmosphere) credit category in the LEED green build-ings rating system for (Building Design and Construction: New Construction), from version 4.0 to version 4.1, Journal of Infrastructure, Policy and Development, 8:8 (2024) 5306. https://doi.org/10.24294/jipd.v8i8.5306
- . Borisuit, P. Suriyothin, Investigating Annual Sunlight Exposure (ASE) as an Indicator for Over-heating in a free-running building: a case of thermal comfort improvement in a child development centre in Thailand, Journal of Physics: Conference Series, 2600:11 (2023) 112012. https://doi.org/10.1088/1742-6596/2600/11/112012
- B. Liu, Y. Liu, Q. Deng, K. Hu, A study on daylighting metrics related to the subjective evaluation of daylight and visual comfort of students in China, Energy and Buildings, 287 (2023) 113001. https://doi.org/10.1016/j.enbuild.2023.113001
- H. Fell, D. Kaffine, D. Steinberg, Energy Efficiency and Emissions Intensity Standards, Journal of the Association of Environmental and Resource Economists, 4:S1 (2017) S201-S226. https://doi.org/10.1086/692015
- C. Li, T. Hong, D. Yan, An insight into actual energy use and its drivers in high-performance buildings, Applied Energy, 131 (2014) 394-410. https://doi.org/10.1016/j.apenergy.2014.06.032
- Government of Bangladesh, Bangladesh National Building Code (BNBC), 2020.
- Deloitte Touche Tohmatsu India LLP, Implementation support on Building Energy Efficiency and Environment Rating (BEEER) System for Green and Near Zero Energy Buildings in Bangladesh, 2022.
- J. Litardo, R. Hidalgo-Leon, G. Soriano, Energy Performance and Benchmarking for University Classrooms in Hot and Humid Climates, Energies, 14:21 (2021) 7013. https://doi.org/10.3390/en14217013
- A. R. Joarder, Incorporation of therapeutic effect of daylight in the architectural design of in-patient rooms to reduce patient length of stay (LoS) in hospitals, PhD Thesis, Loughborough University, 2011.
- V. T. Nguyen, T. H. N. Le, H. T. Le, P. B. L. Nguyen, An Adaptive Facade Configuration for Daylighting Toward Energy-Efficient: Case Study on High-Rise Office Building in HCMC, in: Proceedings of the Second International Conference on Sustainable Civil Engineering and Architecture (ICSCEA 2021), Ho Chi Minh City, Vietnam, 2021, pp. 39-47. https://doi.org/10.1007/978-981-19-3303-5_3
- J. Lytle, Improving Performance and Scalability of Onsite Renewable Energy Using Building-Level Microgrids, Thesis, Toronto Metropolitan University, 2024. https://doi.org/10.32920/25262767.v1
- M. Turrin, P. Von Buelow, R. Stouffs, Design explorations of performance driven geometry in ar-chitectural design using parametric modeling and genetic algorithms, Advanced Engineering Informatics, 25:4 (2011) 656-675. https://doi.org/10.1016/j.aei.2011.07.009
- Y. Ashour, B. Kolarevic, Optimizing creatively in Multi-Objective Optimization, in: Proceedings of the Symposium on Simulation for Architecture and Urban Design (SimAUD 2015), Alexandria, VA, USA, 12-15 April 2015, pp. 128-135.
- Y. K. Ashour, Heuristic Optimization in Design, in: Proceedings of the 35th Annual Conference of the Association for Computer Aided Design in Architecture (ACADIA), Cincinnati, Ohio, USA, 22-24 October 2015, pp. 357-369.
- J. Mahawan, A. Thongtha, Experimental Investigation of Illumination Performance of Hollow Light Pipe for Energy Consumption Reduction in Buildings, Energies, 14:2 (2021) 260. https://doi.org/10.3390/en14020260
- M. A. R. Joarder, Z. N. Ahmed, A. Price, M. Mourshed, A simulation assessment of the height of light shelves to enhance daylighting quality in tropical office buildings under overcast sky conditions in Dhaka, Bangladesh, in: Proceedings of the 11th International Building Performance Simulation Association Con-ference (Building Simulation 2009), Glasgow, Scotland, UK, 27-30 July 2009, pp. 1706-1713.
- E. Zitzler, M. Laumanns, L. Thiele, SPEA2: Improving the strength Pareto evolutionary algorithm, TIK Report, 103 (2001).
- L. Lu, C. M. Anderson-Cook, T. J. Robinson, A case study to demonstrate a Pareto Frontier for se-lecting a best response surface design while simultaneously optimizing multiple criteria, Applied Stochastic Models in Business and Industry, 28:3 (2012) 206-221. https://doi.org/10.1002/asmb.940
- UT383/UT383BT Mini Light Meters - UNI-T Meters | Test & Measurement Tools and Solutions, https://meters.uni-trend.com/product/ut383-ut383bt/
- Trees - ClimateStudio latest documentation, https://climatestudiodocs.com/docs/tree.html
- ASHRAE, Guideline 14-2014: Measurement of Energy, Demand, and Water Savings, American So-ciety of Heating, Refrigerating, and Air-Conditioning Engineers: Atlanta, Georgia, USA, 2014.
- K. Lakhdari, L. Sriti, B. Painter, Parametric optimization of daylight, thermal and energy performance of middle school classrooms, case of hot and dry regions, Building and Environment, 204 (2021) 108173. https://doi.org/10.1016/j.buildenv.2021.108173
- Y. Lu, W. Wu, X. Geng, Y. Liu, H. Zheng, M. Hou, Multi-Objective Optimization of Building Envi-ronmental Performance: An Integrated Parametric Design Method Based on Machine Learning Approaches, Energies, 15:19 (2022) 7031. https://doi.org/10.3390/en15197031
- C. Reinhart, A. Fitz, Findings from a survey on the current use of daylight simulations in building design, Energy and Buildings, 38:7 (2006) 824-835. https://doi.org/10.1016/j.enbuild.2006.03.012
- S. Rockcastle, M. Andersen, Measuring the dynamics of contrast & daylight variability in architec-ture: A proof-of-concept methodology, Building and Environment, 81 (2014) 320-333. https://doi.org/10.1016/j.buildenv.2014.06.012
- N. Queiroz, F. S. Westphal, F. O. Ruttkay Pereira, A performance-based design validation study on EnergyPlus for daylighting analysis, Building and Environment, 183 (2020) 107088. https://doi.org/10.1016/j.buildenv.2020.107088
- ClimateStudio User Guide, Solemma LLC, 2020.
- K. V. D. Wymelenberg, A. Mahic, Annual Daylighting Performance Metrics, Explained, Architect Magazine, https://www.architectmagazine.com/technology/lighting/annual-daylighting-performance-metrics-explained_o
- K. Konis, A. Gamas, K. Kensek, Passive performance and building form: An optimization framework for early-stage design support, Solar Energy, 125 (2016) 161-179. https://doi.org/10.1016/j.solener.2015.12.020
- A. Taser, T. Kazanasmaz, B. K. Koyunbaba, Z. D. Arsan, Multi-objective evolutionary optimization of photovoltaic glass for thermal, daylight, and energy consideration, Solar Energy, 264 (2023) 112070. https://doi.org/10.1016/j.solener.2023.112070
- R. T. Marler, J. S. Arora, The weighted sum method for multi-objective optimization: new insights, Structural and Multidisciplinary Optimization, 41:6 (2010) 853-862. https://doi.org/10.1007/s00158-009-0460-7
- A. Kumar, S. Goel, N. Sinha, A. Bhardwaj, Assessment of Weight Factor in Genetic Programming Fitness Function for Imbalanced Data Classification, in: Proceedings of the International Conference on Intelligent Vision and Computing (ICIVC 2021), Springer International Publishing: Cham, 2022, pp. 1-9. https://doi.org/10.1007/978-3-030-97196-0_1
- K. Deb, Multi-Objective Optimization Using Evolutionary Algorithms, John Wiley & Sons, Inc.: USA, 2001.
- P. Poinet, Enhancing Collaborative Practices in Architecture, Engineering and Construction through Multi-Scalar Modelling Methodologies, PhD Thesis, Institute of Architecture and Technology, Centre for Information Technology and Architecture, 2020.
- S. Sultana, M. A. Rahman Joarder, Optimising daylighting and energy performance in deep-plan tropical buildings: Uniform versus staggered lightwell configurations for multistory apartments, Journal of Building Engineering, 112 (2025) 113753. https://doi.org/10.1016/j.jobe.2025.113753
- E. Kizilorenil, Y. Yaman, I. Uygun, Enhancing Lighting Efficiency in Deep Plan Classroom: Artificial and Daylighting, Politeknik Dergisi, 28:2 (2025) 469-477. https://doi.org/10.2339/politeknik.1495937
- J. Ngungui, Sun Shading Catalogue. Adequate Shading: Sizing Overhangs and Fins | UN-Habitat, https://unhabitat.org/sun-shading-catalogue-adequate-shading-sizing-overhangs-and-fins
- F. Elsiana, S. N. Ekasiwi, N. Antaryama, Daylighting Performance of Horizontal Light Pipe Branching on Open Plan Office Space, DIMENSI - Journal of Architecture and Built Environment, 42 (2015) 43-50.
2383-8701/© 2026 The Author(s). Published by solarlits.com. This is an open access article distributed under the terms and conditions of the Creative Commons Attribution 4.0 License.

1254
Total views
Citations
SHARE ON


