Article | 17 May 2026
Volume 13 Issue 1 pp. 253-272 • doi: 10.15627/jd.2026.14
Effects of Window Design on Natural Ventilation and Daylighting in Single-Sided Computer Labs in Hot-Arid Climates
Rahaf M. Almomani, Ahmed A. Freewan*
Author affiliations
College of Architecture and design, University of Science and Technology, Irbid, Jordan
*Corresponding author.
rmalmomani22@ad.just.edu.jo (R. M. Almomani)
aafreewan@just.edu.jo (A. A. Freewan)
History: Received 2 February 2026 | Revised 11 March 2026 | Accepted 7 April 2026 | Published online 17 May 2026
2383-8701/© 2026 The Author(s). Published by solarlits.com. This is an open access article distributed under the terms and conditions of the Creative Commons Attribution 4.0 License.
Citation: Rahaf M. AlMomani, Ahmed A. Freewan, Effects of Window Design on Natural Ventilation and Daylighting in Single-Sided Computer Labs in Hot-Arid Climates, Journal of Daylighting, 13:1 (2026) 253-272. doi: 10.15627/jd.2026.14
Figures and tables
Abstract
Single-sided computer labs face challenges in achieving adequate natural ventilation and balanced daylighting, particularly in hot-arid climates. This study examines the effects of window-to-wall ratio (WWR) and window placement on ventilation and daylighting performance using an integrated simulation framework. Computational Fluid Dynamics (CFD) simulations in ANSYS Fluent were combined with climate-based daylighting analysis in Rhino/Grasshopper using Ladybug and Honeybee to evaluate airflow behavior, air change rates (ACH), Useful Daylight Illuminance (UDI), and daylight uniformity. The approach was applied to an existing computer lab at the Jordan University of Science and Technology. Results show that increasing WWR improves ventilation and daylight availability but increases glare risk, while split-window configurations enhance daylight uniformity with a slight reduction in ventilation efficiency. A multi-criteria compromise analysis identified an optimized configuration with a WWR of approximately 23.5% and a window spacing of 3.2 m, achieving a balanced performance. The findings provide practical.
Keywords
window-to-wall ratio (WWR), window placement, computer labs, computational fluid dynamics (CFD), single-sided ventilation
Nomenclature
| IEQ | Indoor Environmental Quality |
| IAQ | indoor air quality |
| CFD | Computational Fluid Dynamics |
| ASHRAE | The American Society of Heating, Refrigerating and Air-Conditioning Engineers |
| Q req | The required ventilation rate [L/s] |
| Qact | The actual ventilation rate [L/s] |
| nQ | Actual-to-required ventilation ratio |
| TWV | Total wind velocity |
| TKE | Turbulence kinetic energy |
| lu | extent of the upstream domain, encompassing the distance from the inlet to the windward building facade |
| ld | denotes the length of the downstream domain, spanning from the leeward building facade to the outlet plane |
| b | lateral clearance on both sides of the building |
| h | encapsulates the comprehensive height of the domain |
| ACH | Air Changes per Hour |
| ANSYS | Analysis System (Engineering Simulation Software) |
| A-series | Single centered window placement |
| B-series | Double-sided window placement on the same façade |
| CBC | Cross-Ventilation Base Case |
| SBC | Single-Sided Ventilation Base Case |
| NWV | Normal Wind Velocity |
| IESNA | Illuminating Engineering Society of North America |
| CO₂ | carbon dioxide |
| PBDEs | Polybrominated Diphenyl Ethers |
| SWV | Shear Wind Velocity |
| UDI | Useful Daylight Illuminance |
| WWR | Window-to-Wall Ratio |
| HVAC | Heating, Ventilation, and Air Conditioning |
| WHO | World Health Organization |
| DA | Daylight Autonomy |
| sDA | Spatial Daylight Autonomy |
| ASE | Annual Sunlight Exposure |
| DF | daylight factor |
| DC | daylight coefficient |
| VOF | Volume of Fluid |
| PBDEs | polybrominated diphenyl ethers |
1. Introduction
Indoor Environmental Quality (IEQ) plays a pivotal role in shaping the comfort, health, and productivity of building occupants [1,2], particularly in educational environments where students and instructors spend extended periods engaged in concentrated cognitive activities [3,4]. Among the key components of IEQ, natural ventilation and daylighting play a central role. Natural ventilation regulates indoor temperature and dilutes pollutants such as carbon dioxide ( ) [5,6], while daylighting enhances visual comfort, reduces reliance on artificial lighting, and supports psychological well-being and circadian rhythm stability [7]. Achieving an appropriate balance between airflow and glare-free daylight is therefore essential to maintaining both energy efficiency and occupant well-being in educational buildings [8].
Maintaining this balance is particularly challenging in hot-arid climates such as Jordan. Elevated outdoor temperatures reduce the cooling effectiveness of natural ventilation, while prolonged occupancy and equipment use increase internal heat gains [9,10]. As a result, educational facilities often depend heavily on mechanical cooling systems, leading to higher energy consumption and operational costs [11,12]. In addition, many buildings rely on single-sided openings that limit ventilation efficiency and daylight penetration, increasing dependence on artificial systems. These climatic and architectural constraints underscore the importance of passive design strategies—especially optimized window size and placement—to enhance environmental performance while controlling heat gain and glare [13,14].
Computer labs represent one of the most environmentally demanding spaces within educational buildings. Continuous operation of electronic equipment generates substantial internal heat and pollutant loads [5,6].
Devices emit heat and compounds such as polybrominated diphenyl ethers (PBDEs) [15], which may accumulate when ventilation is insufficient. Reported concentrations range from 876 ppm in naturally ventilated computer labs to as high as 4000 ppm in poorly ventilated classrooms during peak occupancy [5]. Such elevated levels negatively affect cognitive performance and user comfort [16]. In single-sided configurations, restricted airflow pathways further limit pollutant dilution and ventilation effectiveness.
Daylighting performance in computer-based environments presents additional complexity. Although natural light reduces energy demand and improves occupant well-being, it can also produce glare and disruptive reflections on screens if not properly controlled [17]. Single-sided rooms typically exhibit uneven daylight distribution, with strong luminance contrasts between window-adjacent and deeper zones [18]. Oversized or poorly positioned windows may intensify glare and overheating, compromising visual comfort. Consequently, daylighting strategies in computer labs must carefully balance adequate illumination with glare mitigation and thermal control.
Because both ventilation and daylighting are primarily governed by window characteristics [19], window design plays a decisive role in shaping IEQ performance [20]. Parameters such as Window-to-Wall Ratio (WWR) and window placement directly influence airflow dynamics [21], daylight penetration depth, illuminance uniformity, and glare probability [22]. In single-sided spaces—where airflow is inherently constrained and daylight enters from only one façade [23] these design parameters become even more critical. However, increasing window size to enhance airflow and daylight may simultaneously increase heat gain and glare risk [24,25], creating a complex design trade-off.
Previous studies indicate that higher WWR can improve daylight availability [22] and potentially enhance ventilation performance [26], yet they also report increased risks of overheating and glare, particularly in hot climates [27]. Research further demonstrates that window placement significantly affects airflow distribution and daylight uniformity [28,30]. Nevertheless, most existing investigations examine ventilation and daylighting independently or focus on general classrooms, offices, or cross-ventilated spaces [31,32]. Limited attention has been given to the combined environmental performance of single-sided computer labs, despite their high internal heat loads, equipment density, and restricted façade exposure.
Moreover, few studies employ an integrated simulation framework capable of simultaneously assessing airflow dynamics and daylight performance under consistent boundary conditions. Since window design directly influences both ventilation and daylight distribution [19], evaluating these aspects separately provides only partial insight into their interactive effects. A comprehensive approach that systematically optimizes WWR and window placement—while accounting for trade-offs among airflow efficiency, thermal implications, illuminance distribution, and glare probability—remains necessary, particularly in hot-arid climates.
Despite increasing interest in sustainable educational design, a clear research gap persists regarding the combined evaluation and optimization of ventilation and daylighting in single-sided computer labs. Accordingly, this study aims to evaluate and optimize natural ventilation and daylighting performance in single-sided computer labs by examining variations in Window-to-Wall Ratio (WWR) and window placement. An integrated simulation framework is adopted, combining Computational Fluid Dynamics (CFD) modeling in ANSYS Fluent with daylight performance analysis using Honeybee and Ladybug within Rhino/Grasshopper.
The research assesses airflow patterns, air change rates (ACH), velocity distribution, illuminance levels, Useful Daylight Illuminance (UDI), uniformity, and glare probability. A real case study from the Jordan University of Science and Technology provides the contextual basis. The objective is to identify window configurations that achieve a balanced integration of ventilation efficiency and daylight quality, thereby supporting energy-efficient and occupant-centered design strategies for educational facilities in hot-arid climates.
2. Materials and methods
This study investigates the influence of window design parameters specifically window-to-wall ratio (WWR) and window placement on natural ventilation and daylighting performance in computer labs within a hot-arid climate. A performance-based, simulation-driven methodology is adopted, integrating Computational Fluid Dynamics (CFD) using ANSYS Fluent to analyze airflow behavior and air change rates, alongside daylighting simulations conducted through Rhinoceros/Grasshopper with Ladybug and Honeybee plugins to evaluate illuminance distribution and visual performance. The framework ensures methodological rigor through clearly defined variables, consistent boundary conditions, and climate-representative calibration for Jordan, enabling a controlled comparison of ventilation and daylighting outcomes across identical geometries and providing evidence-based insights to support passive window design strategies that reduce reliance on mechanical ventilation and artificial lighting.
2.1. Case study and scenario configurations
The case study shown in Fig. 1 examined in this research is an existing single-sided computer lab at the Jordan University of Science and Technology in Irbid, Jordan, selected as a representative example of typical educational spaces in the region [34], with limited façade exposure and restricted natural ventilation potential. The lab measures 10.7 m × 7.1 m × 2.7 m, with a total area of 75.7 m², and includes a single row of windows along one façade with a height of 1.1 m, a sill height of 1.0 m, and an existing window-to-wall ratio (WWR) of 10%, which serves as the baseline condition for all simulations. The computer workstations are arranged in rows with the monitors oriented toward the window façade, meaning that the screens face the windows and are therefore directly influenced by incoming daylight, making glare control and daylight distribution critical factors for visual comfort in the space. Its single-sided configuration and limited opening area make it suitable for evaluating air flow and daylighting constraints. The site is located in Irbid (32°33′20″N, 35°51′0″E), a semi-arid city situated near the Mediterranean climatic zone, with average temperatures of approximately 25°C in July and 8°C in January (Irbid Climate: Weather Irbid & Temperature by Month, n.d.), and a recorded average wind velocity of about 3.6 m/s with an air density of 1.15 kg/m³, providing a realistic climatic context for assessing window design performance under Jordan’s environmental conditions [35].
Figure 1
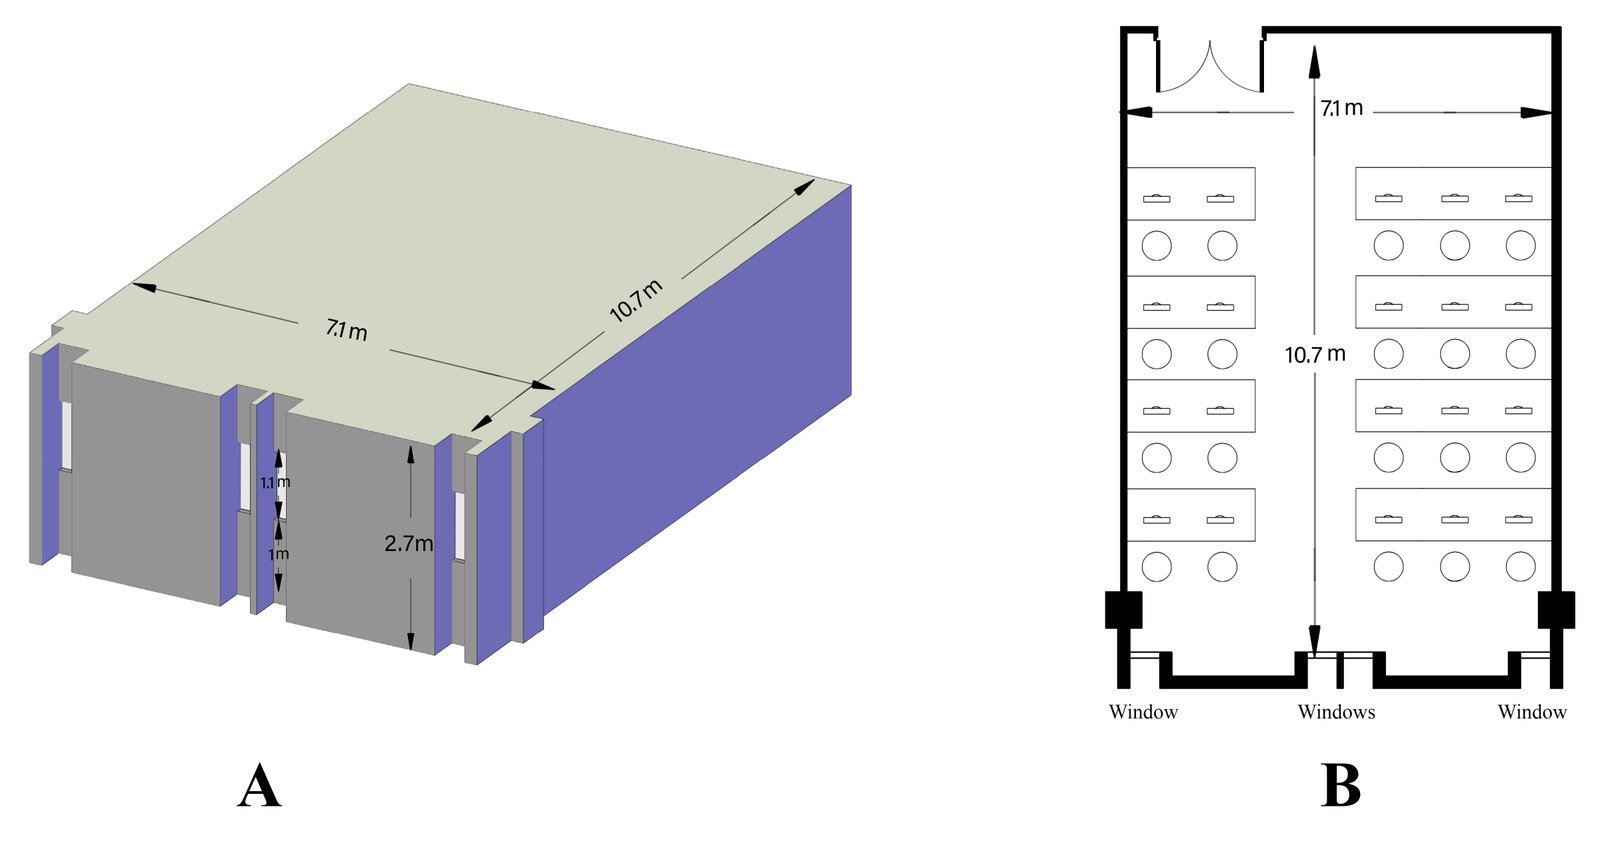
Fig. 1. Single-sided computer lab (A) 3D model (B) 2D plan.
To evaluate the impact of window design on natural ventilation and daylighting performance in computer labs, this study established a structured set of simulation scenarios based on the single-sided configuration. Within this framework, multiple window design parameters were systematically varied to enable consistent and comparable assessment across all cases:
· Three WWR levels 10%, 20%, and 30% representing small, medium, and large openings, respectively. To maintain methodological consistency and isolate the effect of WWR, variations were introduced solely through changes in window width, while keeping the window height fixed at 1.1 m and the sill height at 1.0 m in accordance with ergonomic and architectural standards for computer labs. This approach avoids introducing additional variables related to glare, daylight distribution, and view angles that are sensitive to vertical window placement [18]. The selected WWR range is widely supported by existing research and educational building standards as a practical and realistic interval for assessing daylighting and natural ventilation [34]. Moreover, limiting WWR to a maximum of 30% is particularly important in computer-based learning environments, where excessive daylight can cause glare and screen reflections, and where ventilation gains beyond this threshold tend to diminish while visual and thermal discomfort increase [36,37].
· Two window placement strategies—a single centered window and a double-sided arrangement on the same façade. Window placement on the façade is a key architectural variable affecting both airflow distribution and daylight penetration in naturally ventilated computer labs [37]. This study evaluates two common and contrasting placement strategies: a single centrally located window and a double-sided arrangement with two symmetrically positioned windows on the same façade, sharing the same total window-to-wall ratio. The comparison enables an assessment of how different opening geometries influence ventilation efficiency, airflow patterns, daylight spread, and visual comfort. While The center placement emerges as the most effective in boosting average velocity [38].— But, potentially increasing glare and screen reflections in computer-based environments [18], the double-sided configuration is examined for its ability to distribute air and daylight more evenly, reduce localized luminance contrasts, and enhance overall environmental performance [39,40].
· This combination results in a total of 6 scenarios and one base case as shown in Fig. 2.
Figure 2
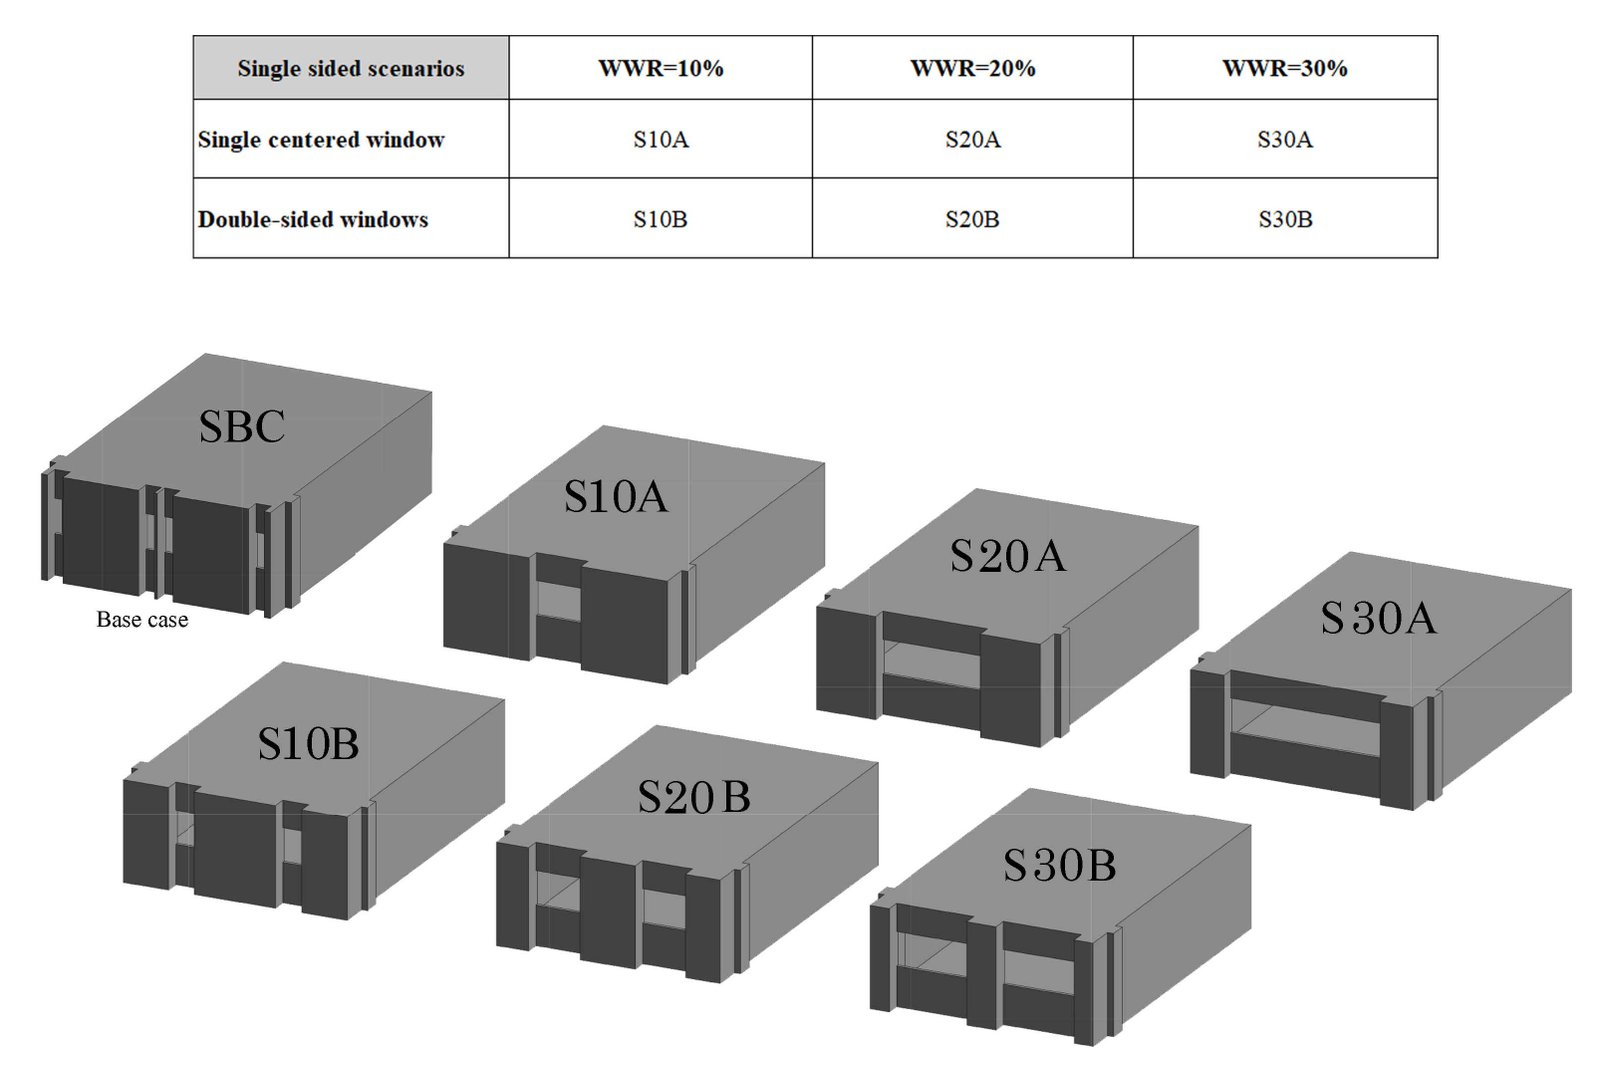
Fig. 2. Windows scenarios.
2.2. Tools and validity
The accuracy of the Computational Fluid Dynamics (CFD) simulations conducted in ANSYS Fluent was validated through direct comparison with on-site airflow measurements taken inside the computer lab, as presented in Figs. 2 and 3. Field data were collected on 10 November using a professional EXTECH Instruments anemometer, with air velocity measured at a height of 1.2 m above the floor to represent the seated occupants’ breathing zone and to match the CFD post-processing plane. Measurements were conducted under stable environmental conditions to ensure representative airflow behavior. The comparison between measured and simulated velocities demonstrated a strong agreement in both magnitude and spatial distribution, confirming the model’s ability to accurately capture airflow patterns within the space. Quantitatively, the validation results yielded a Percentage Mean Bias Error (MBE) of approximately 14%, indicating acceptable agreement between simulated and measured data for natural ventilation studies. This agreement was further supported by the application of robust simulation settings, including the decomposition of total wind velocity into shear and normal components at the inlet boundaries, a strict residual convergence criterion of 1×10⁻⁶, and a mesh sensitivity analysis that identified a 0.5m grid as an optimal balance between accuracy and computational efficiency.
Figure 3
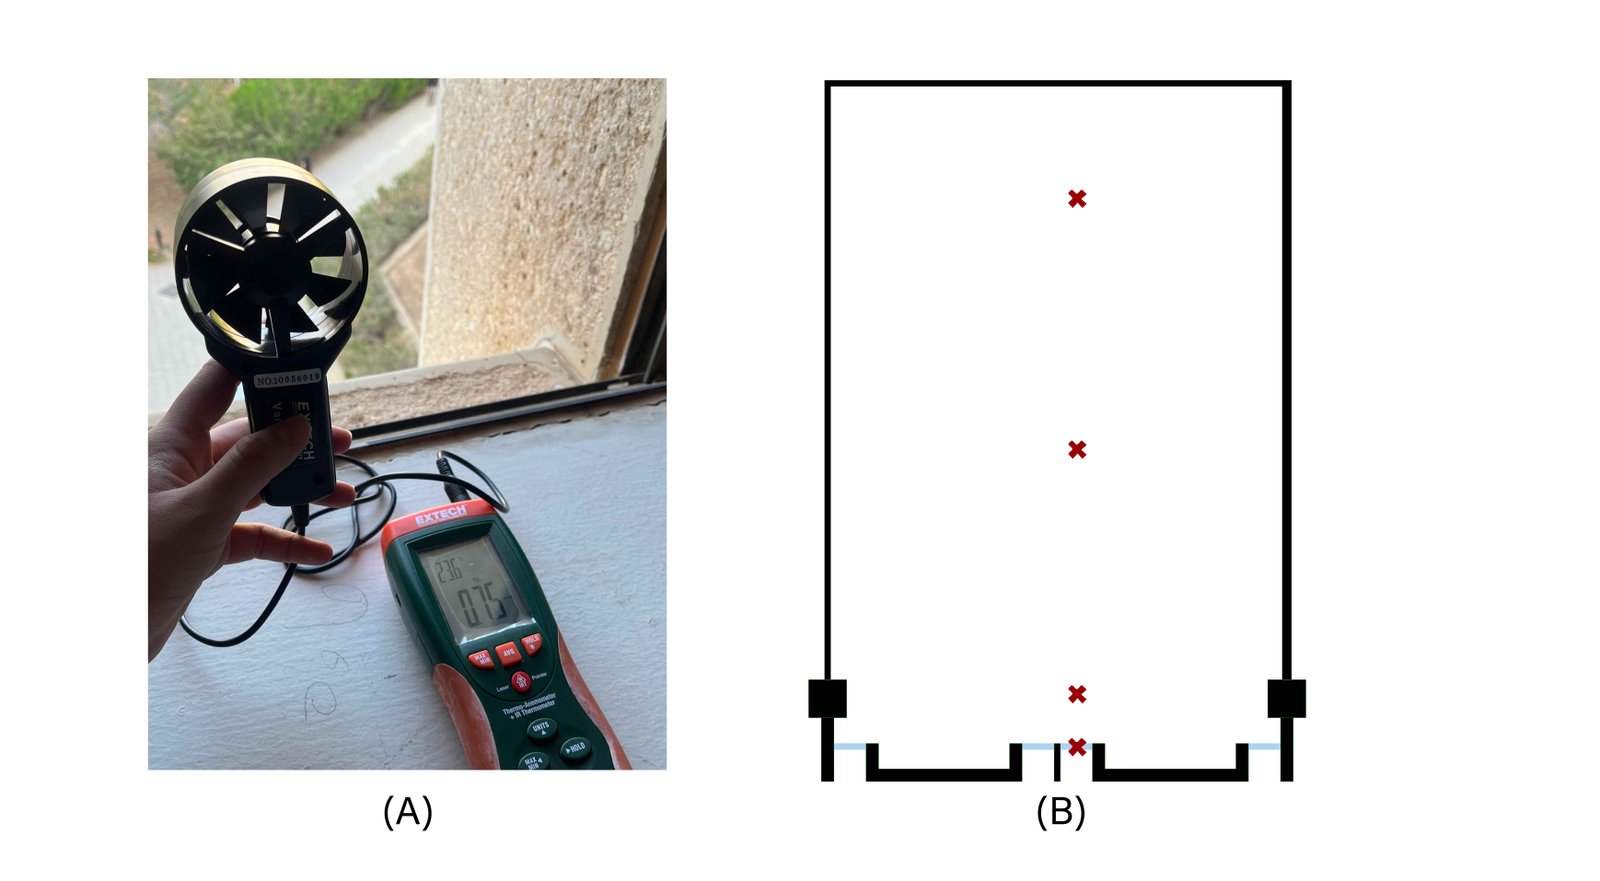
Fig. 3. (a) Thermo-Anemometer with IR Thermometer (b) Air velocity measurement points.
Together, these measures validate the reliability of the CFD model for assessing natural ventilation performance in computer lab environments. Similarly, the daylighting simulation results were validated by comparing modeled illuminance levels with on-site measurements conducted on 10 November at 10:00 AM under clear-sky conditions, as seen in Figs. 4 and 5. Illuminance data were collected using a high-precision EXTECH Instruments datalogging light meters at a consistent work-plane height of 0.75 m, corresponding to typical desk level for seated users. The measured and simulated illuminance values showed close alignment in both trends and absolute values across all measurement points, with a Percentage Mean Bias Error (MBE) of approximately 9.3%, indicating good agreement between the modeled and observed data as seen in Fig. 6. This strong correspondence confirms the validity of the daylighting model and supports the reliability of the integrated simulation framework used in this study for evaluating and optimizing both ventilation and daylighting performance in computer labs.
Figure 4
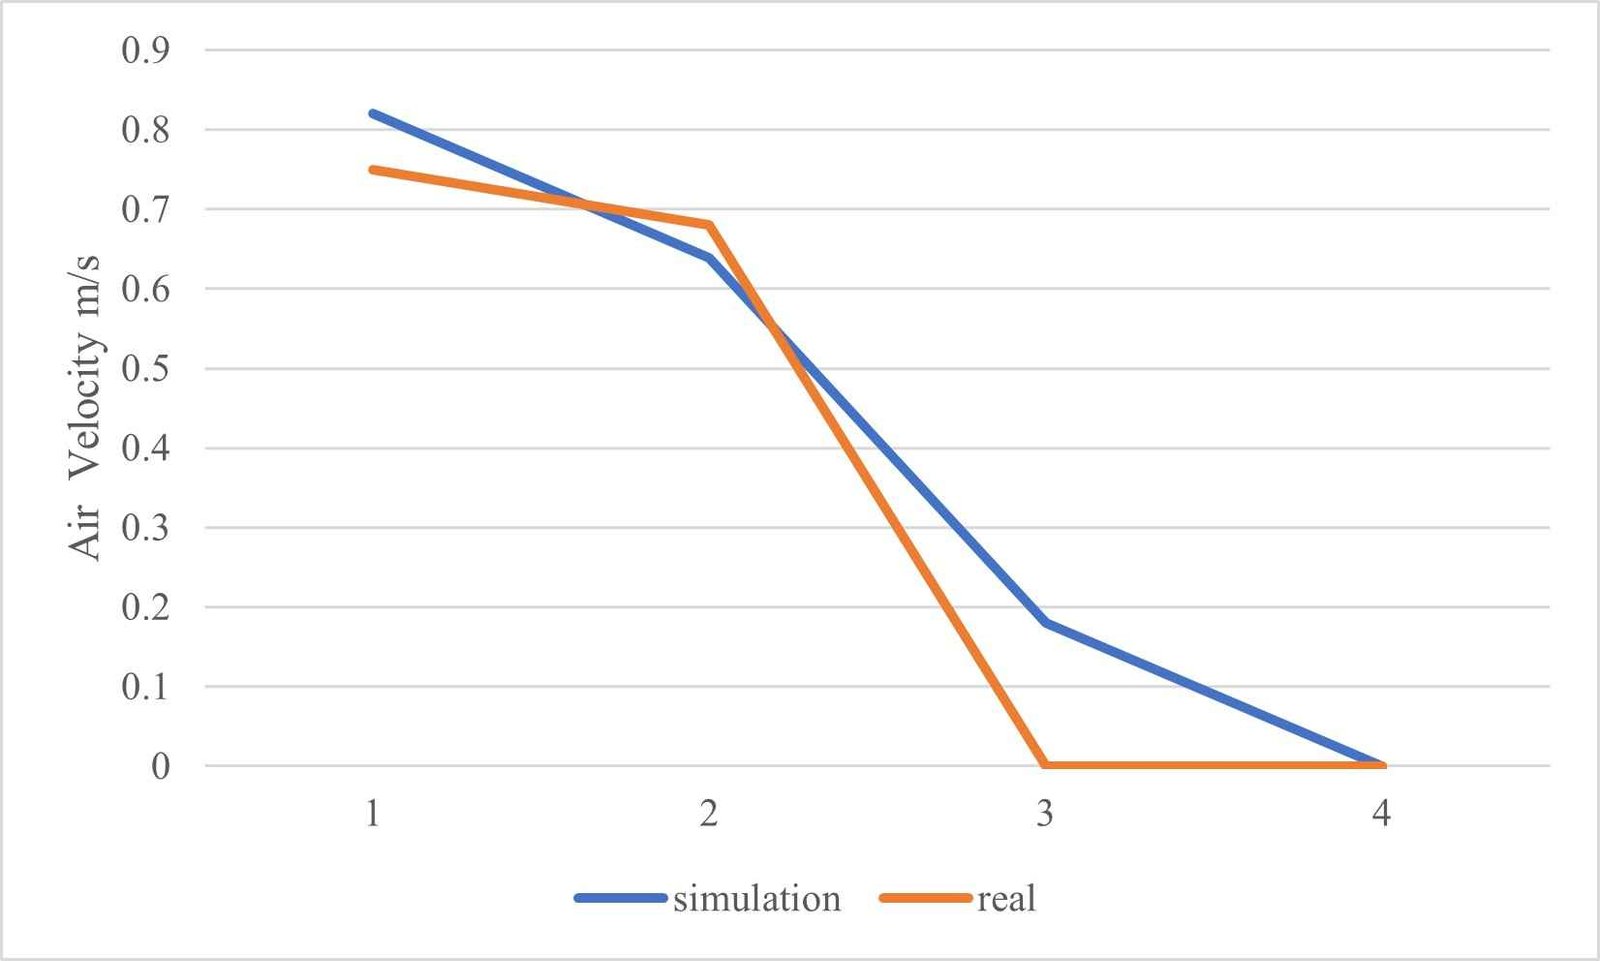
Fig. 4. Comparison between measured and simulated air velocity values.
Figure 5
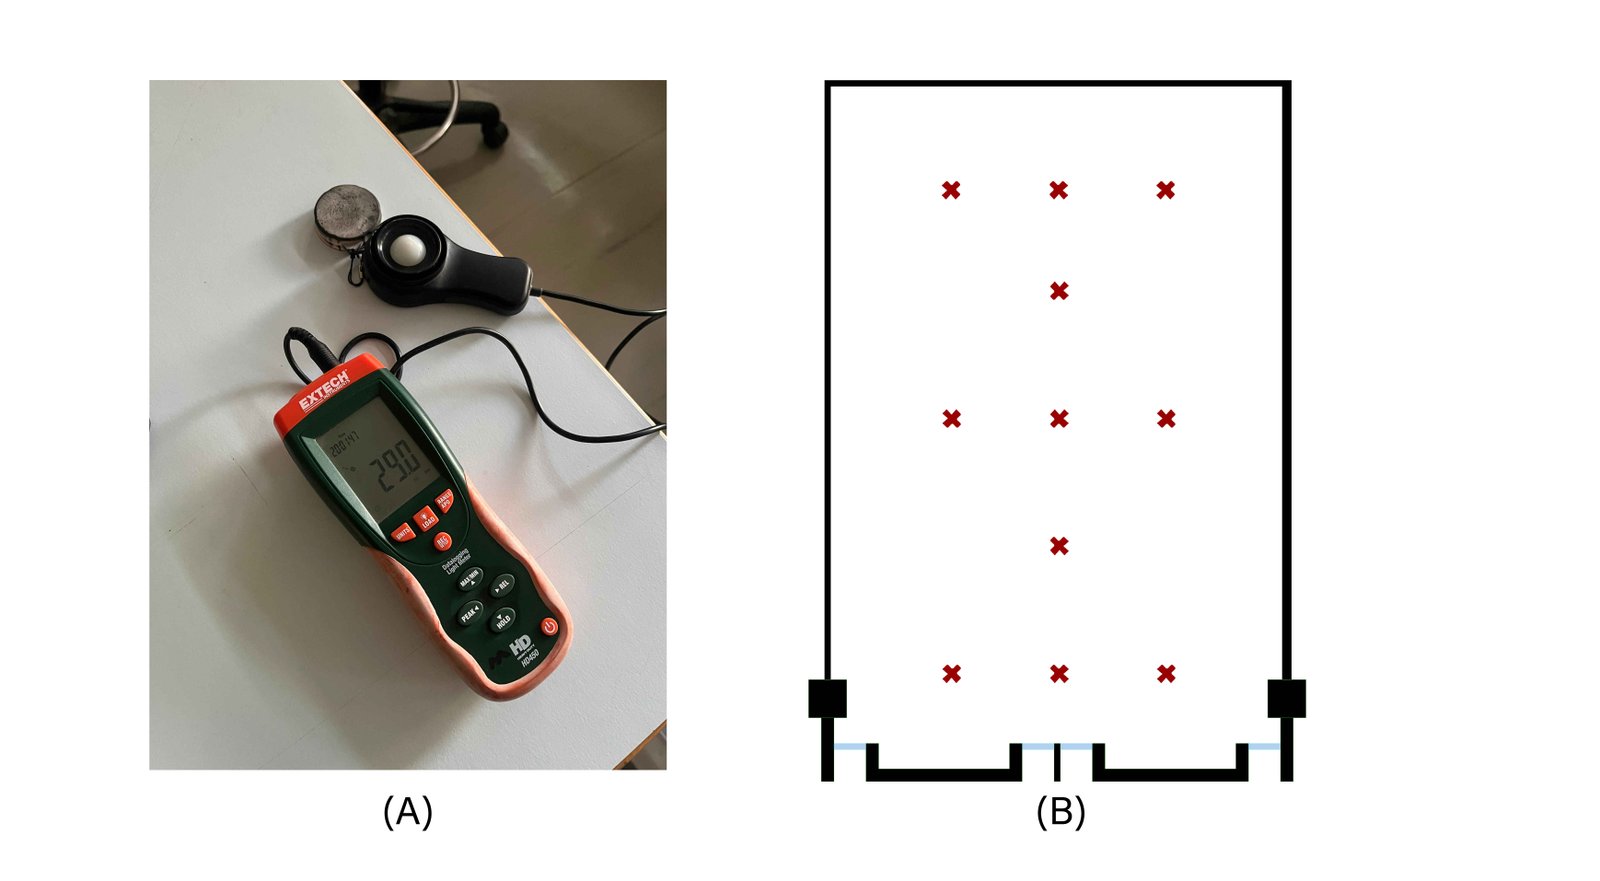
Fig. 5. (a) Light meter (b) illuminance measurement points.
Figure 6
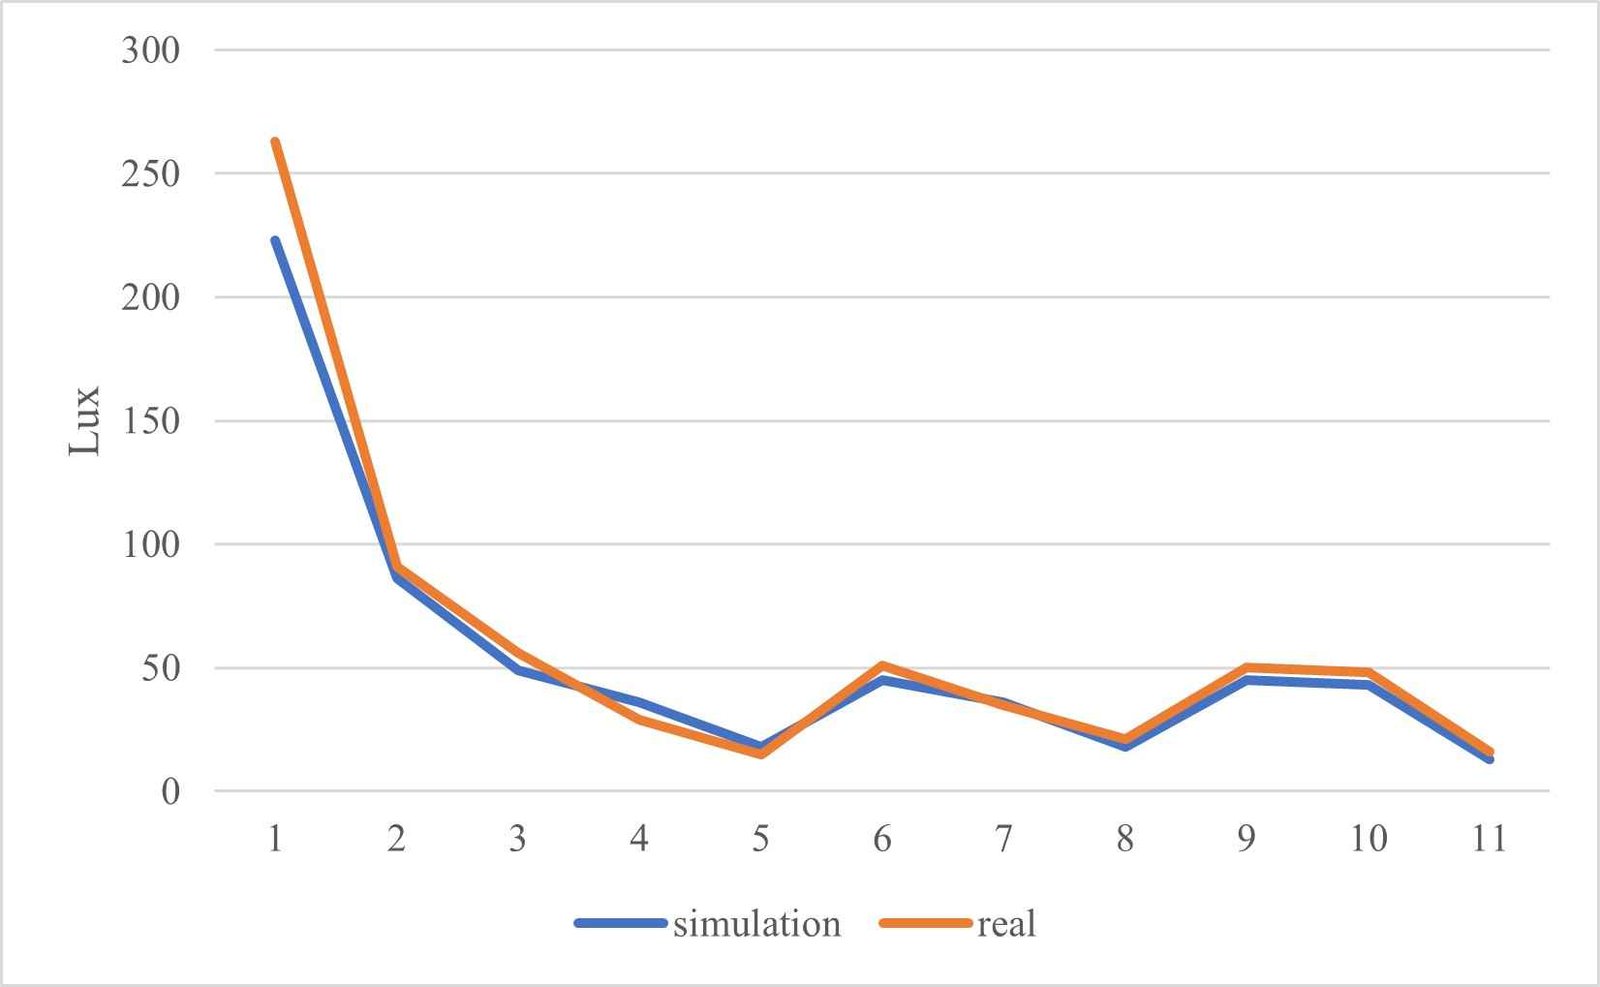
Fig. 6. Comparison between measured and simulated illuminance values.
2.3. Simulation settings
To assess the effectiveness of natural ventilation and daylighting strategies across various design scenarios, this study utilized advanced Computational Fluid Dynamics (CFD) modeling in ANSYS Fluent 2024 R1, alongside the Honeybee and Ladybug plugins in Rhino. The simulations were designed to realistically represent indoor airflow and daylight distribution under actual architectural and climatic conditions.
2.3.1. Ansys fluent settings
The experimental investigation was carried out across multiple design scenarios, initially modeled in Rhino and subsequently imported into ANSYS SpaceClaim. Within SpaceClaim, the solid geometries were systematically cleaned and simplified to remove redundant or overly complex features, thereby optimizing the models for computational efficiency and reducing potential sources of numerical error. Following this process, Boolean operations were performed to subtract the building geometry from a predefined bounding fluid domain. This domain was carefully constructed to include both the internal volume of the computer lab and an external buffer region, ensuring accurate representation of indoor airflow conditions as well as wind-driven effects on the building envelope.
The computational domain and boundary conditions were established in accordance with recognized best practices for CFD simulations of building aerodynamics [41,42]. The domain dimensions were defined using four key parameters: \(l_u\), \(l_d\), \(b\), and \(h\), as illustrated in Fig. 7.
Figure 7
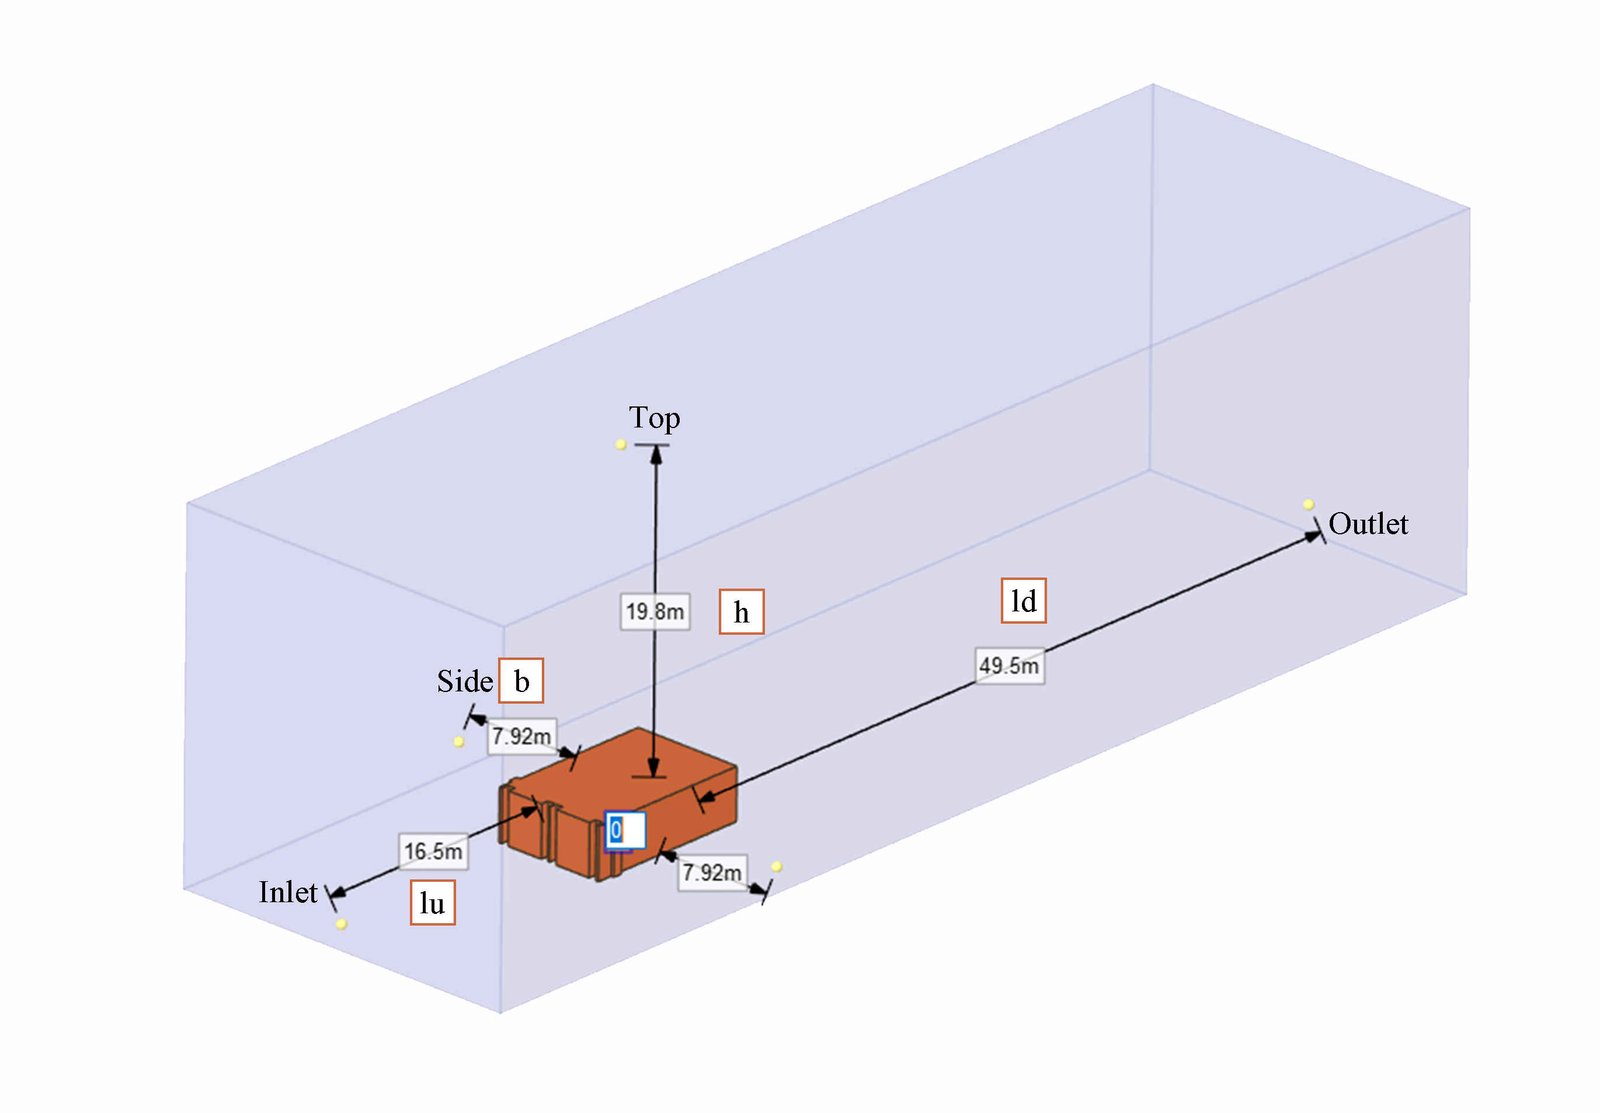
Fig. 7. The computational domain dimensions (h includes the building height).
Specifically, \(l_u\) represents the upstream distance from the inlet to the windward building façade, while l_d corresponds to the downstream length extending from the leeward façade to the outlet plane [41]. The parameter b defines the lateral clearance on both sides of the building, and h denotes the overall height of the computational domain [41,42].
In this study, the adopted values were \(l_u\)=5H, \(l_d\)=15H, b=2.4H, and h=6H, where H is the building height. Given that the building height was 3.3 m, presents the calculated domain dimensions applied consistently across all CFD simulation cases.
The study adopts a controlled methodological framework in which architectural variables (WWR and window configuration) are systematically varied while all other environmental and boundary conditions remain constant, including identical material properties, fixed wind speed and direction based on representative local climate data, absence of surrounding buildings, and consistent CFD boundary settings. This controlled approach enables clear isolation of causal relationships between design parameters and ventilation performance indicators such as airflow rate, velocity distribution, turbulence intensity, and ventilation efficiency. However, it is important to acknowledge that the simulations were conducted under steady-state conditions, representing stabilized airflow rather than transient wind fluctuations, and are based on a single climatic context.
Following geometry preparation, meshing for each scenario was carried out using the ANSYS Fluent Meshing module within Workbench. The mesh strategy was designed to achieve an optimal balance between computational efficiency and solution accuracy. To ensure the reliability of the numerical results, a mesh sensitivity analysis was performed before executing the final CFD simulations. The computational domain was discretized using successive mesh refinements, and the mass flow rate was monitored across an internal plane positioned at 1.2 m above the floor level, corresponding to the breathing zone of a seated occupant. This approach ensured that the airflow predictions remained robust and unaffected by further mesh refinements beyond a critical threshold.
The mesh element count was gradually refined, beginning with 125,758 cells and increasing through 213,881, 417,674, 772,302, and 1,700,906, up to a maximum of 8,533,017 cells. The analysis showed that beyond approximately 1.7 million elements, the solution became mesh-independent, with negligible variations in the results. As the mesh resolution increased, the relative error consistently decreased, and the mass flow rate stabilized within a tolerance of about 1% and Table 1 and Fig. 8 present the mesh sensitivity study.
Table 1
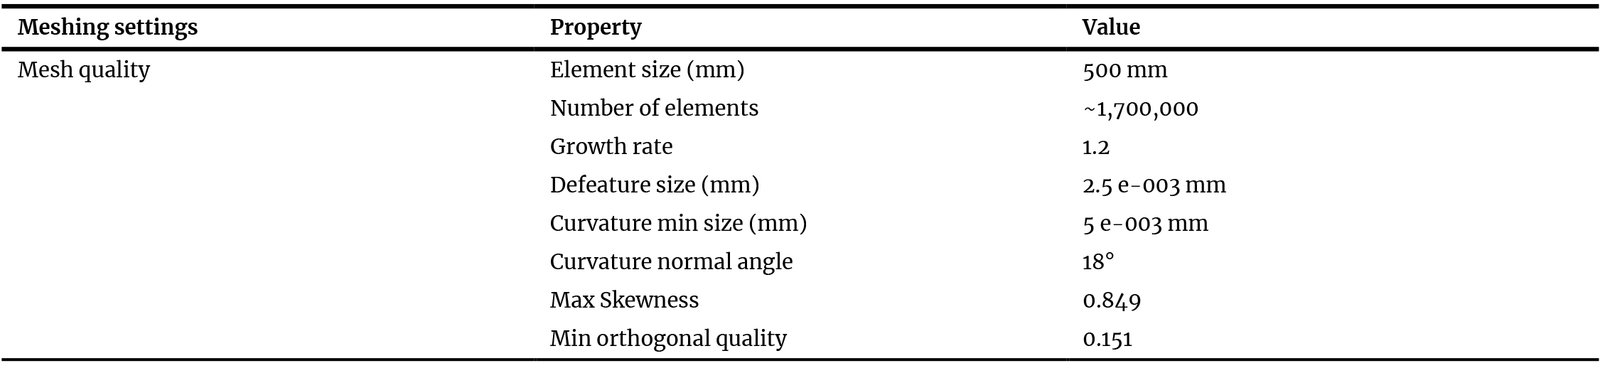
Table 1. Mesh sensitivity analysis.
Figure 8
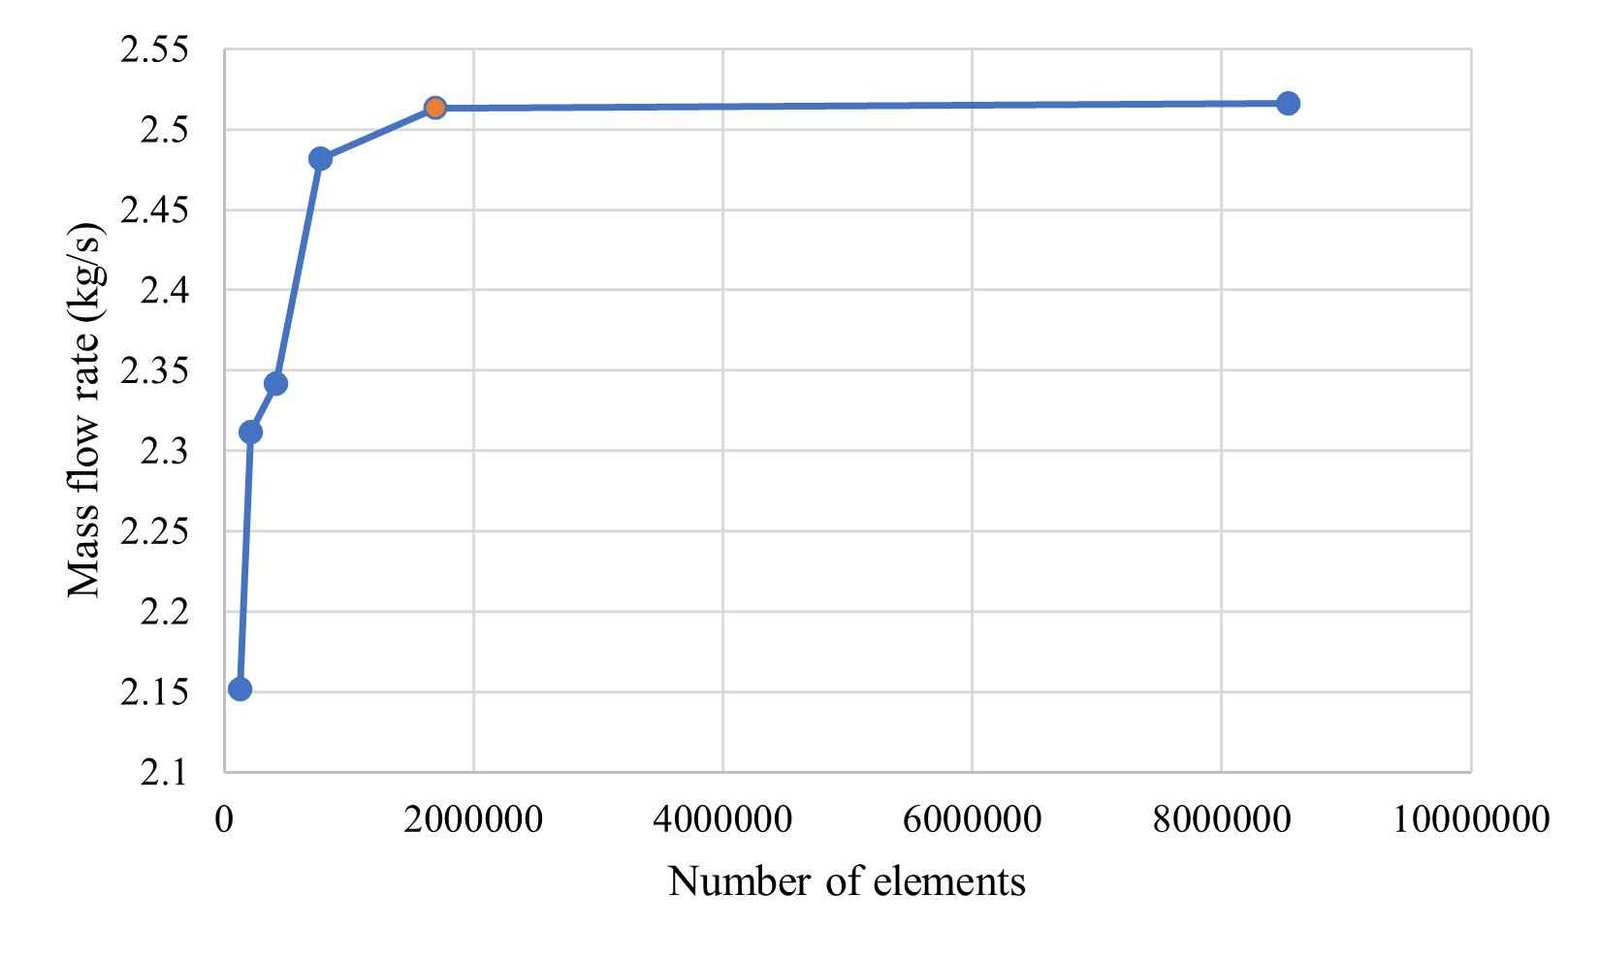
Fig. 8. Mesh sensitivity analysis.
Following the mesh generation of the computational domains and the designation of the inlet, outlet, and wall boundaries, the next stage involved initiating the calculation process in the Fluent solver. This phase required configuring several key settings in Ansys Fluent before running the solver iterations. These settings included the physics and solver setup, the specification of boundary and initial conditions, as well as the solution initialization. The meshing parameters applied across all simulations are summarized in Table 1 , including values such as growth rate, defeature size, minimum curvature size, curvature normal angle, maximum skewness, and minimum orthogonal quality.
After mesh generation, all scenarios were imported into ANSYS Fluent, where a consistent set of physical models, boundary conditions, and numerical schemes were applied. The simulations were carried out using a pressure-based steady-state solver, coupled with the realizable k–ε turbulence model and standard wall functions, which are widely recommended for indoor airflow studies due to their balance between computational efficiency and accuracy.
Air properties were defined according to standard reference conditions, with a density of 1.225 kg/m³ and a dynamic viscosity of 1.789 × 10⁻⁵ kg/m·s [21,43]. Boundary conditions included two velocity inlets at the windward façade, each assigned an inflow velocity of 3.6 m/s, turbulence intensity of 5%, and a viscosity ratio of 10. The leeward façade was modeled as a pressure outlet with zero-gauge pressure and matching turbulence parameters, ensuring a consistent and physically realistic airflow boundary setup. The numerical setup employed the coupled pressure–velocity algorithm. Spatial discretization used a second-order scheme for pressure and second-order upwind schemes for momentum, turbulence kinetic energy, and turbulence dissipation rate. Convergence was achieved when the residuals of continuity, velocity, and turbulence parameters fell below 1 × 10⁻⁶. Standard initialization was used to start the computation process.
The operational performance of the proposed ventilation system across all scenarios was evaluated through both quantitative and qualitative analyses of key performance indicators. These metrics included the actual-to-required ventilation ratio (nQ) and the area-weighted average air velocity for the base configuration and all modified cases.
The ventilation ratio (nQ) was calculated as the ratio between the actual ventilation rate (\(Q_{actual}\)) and the required ventilation rate (\(Q_{required}\)). The actual ventilation rate was computed using the ANSYS Fluent solver, where mass airflow rates (kg/s) were extracted from simulation results. For the modified scenarios, values were obtained at the internal inlet, they were taken at the window opening plane.
The effectiveness of the proposed window design in improving ventilation performance was assessed by comparing the actual ventilation rate (\(Q_{actual}\)) with the required ventilation rate \(operatorname{Q_{required}\)), as specified by the ASHRAE 62 standards for educational facilities such as computer labs. These standards establish the minimum acceptable ventilation levels to ensure indoor air quality, as expressed in Eq. (1).
where \rho= 1.225 kg/m is the outdoor airflow density.
Using Eq. (2), the breathing zone outdoor airflow (Vbz) was calculated to be approximately 0.0944 m³/s.
The actual ventilation rate (Qactual), representing the simulated mass flow rate, was then determined computationally through ANSYS Fluent, following the formulation in Eq. (3).
where \rho= 1.225 kg/m is the outdoor airflow density.
\dot{V}= volumetric flow rate (for each case). To calculate the volumetric flow rate (V), Eq. (4) is used:
where A: is the cross-sectional area of the inlet opening (in m²), v: is the average fluid velocity at the inlet openings (in m/s). The actual-to-required ventilation ratio has benchmarked the ventilation performance as described in the following Eq. (5):
· ACH (Air change per hour)
To evaluate the airflow performance within the computer lab, the Air Changes per Hour (ACH) metric was employed. ACH represents the number of times the total volume of air within a space is replaced in one hour. In other words, it quantifies the rate at which fresh air is supplied to or exhausted from a room, normalized by the room’s volume. The airflow discharge was determined by multiplying the average inlet air velocity by the outlet surface area, as expressed in Eq. (6).
Furthermore, the air change rate within the lab was determined by dividing the discharged airflow, obtained from Eq. (6), by the total volume of the lab. The calculation procedure is presented in Eq. (7).
Finally, the Air Changes per Hour (ACH) value was obtained by multiplying the calculated air change rate by 3600, corresponding to the number of seconds in one hour. This process is expressed in Eq. (8).
2.3.2. Rhino settings
The modeling process began with the creation of the computer lab scenarios in Rhinoceros (Rhino), where the base geometry was developed to represent the test environment. Once the geometry was finalized, it was exported into Grasshopper for parametric manipulation and integration with daylighting analysis tools. The lab geometry was converted into a Honeybee-compatible model using the HB Room from Solid component. Subsequently, windows were defined and inserted through the HB Aperture component, enabling the transformation of the model into Honeybee zones with all necessary physical and optical properties required for daylighting simulations. This setup ensured that the model accurately represented the architectural geometry, window configurations, and boundary conditions essential for conducting reliable simulation analyses.
The case study is located in Irbid, northern Jordan, characterized by a Mediterranean climate with semi-arid features [44]. The region experiences hot, dry summers and mild, wetter winters, with summer temperatures typically ranging from 18°C to 32°C and winter temperatures from 5°C to 15°C. Annual precipitation averages 400–450 mm, occurring primarily between November and March.
Climatic data were obtained from the EnergyPlus Weather Data repository (EPW format), providing hourly information on temperature, humidity, solar radiation, wind speed, and wind direction for a typical meteorological year. These data were used to define the boundary conditions for ventilation and daylight simulations, ensuring that performance assessments reflect representative local climate conditions.
Daylighting simulations were carried out using Ladybug Tools, a widely recognized platform for accurate daylight modeling and performance assessment.
To enhance the reliability of the results, the simulations incorporated climate-based weather data corresponding to the building’s actual geographical location. The illuminance threshold was set at 300 lux, aligning with standard requirements for computer lab environments. (see Fig. 9). The analysis specifically focused on three performance indicators: Useful Daylight Illuminance (UDI), Uniformity of light, and point-based lux measurements useful Daylight Illuminance (UDI), light uniformity, and illuminance level were selected to capture both the quantitative and qualitative aspects of daylighting performance. UDI was specifically employed as an indicator of glare-free daylight conditions, as demonstrated by [45], UDI shows a clear relationship with increased daylight glare probability (DGP). Their study found that higher frequencies of excessive daylight are strongly associated with higher glare probability values, indicating that UDI can serve as a meaningful proxy for glare risk under climate-based daylight modelling. UDI it evaluates whether daylight levels fall within a comfortable and usable range rather than merely measuring brightness. Light uniformity was chosen to assess the even distribution of daylight across work surfaces, which is critical in computer labs to minimize visual fatigue and screen reflections. Illuminance level was included to ensure compliance with recommended lighting standards for educational spaces and to evaluate whether daylighting provides sufficient light for learning activities. Alternative daylighting metrics were not used because they either focus on aesthetic aspects or require subjective assessment, which does not align with the objective performance-based approach of this research.
Figure 9
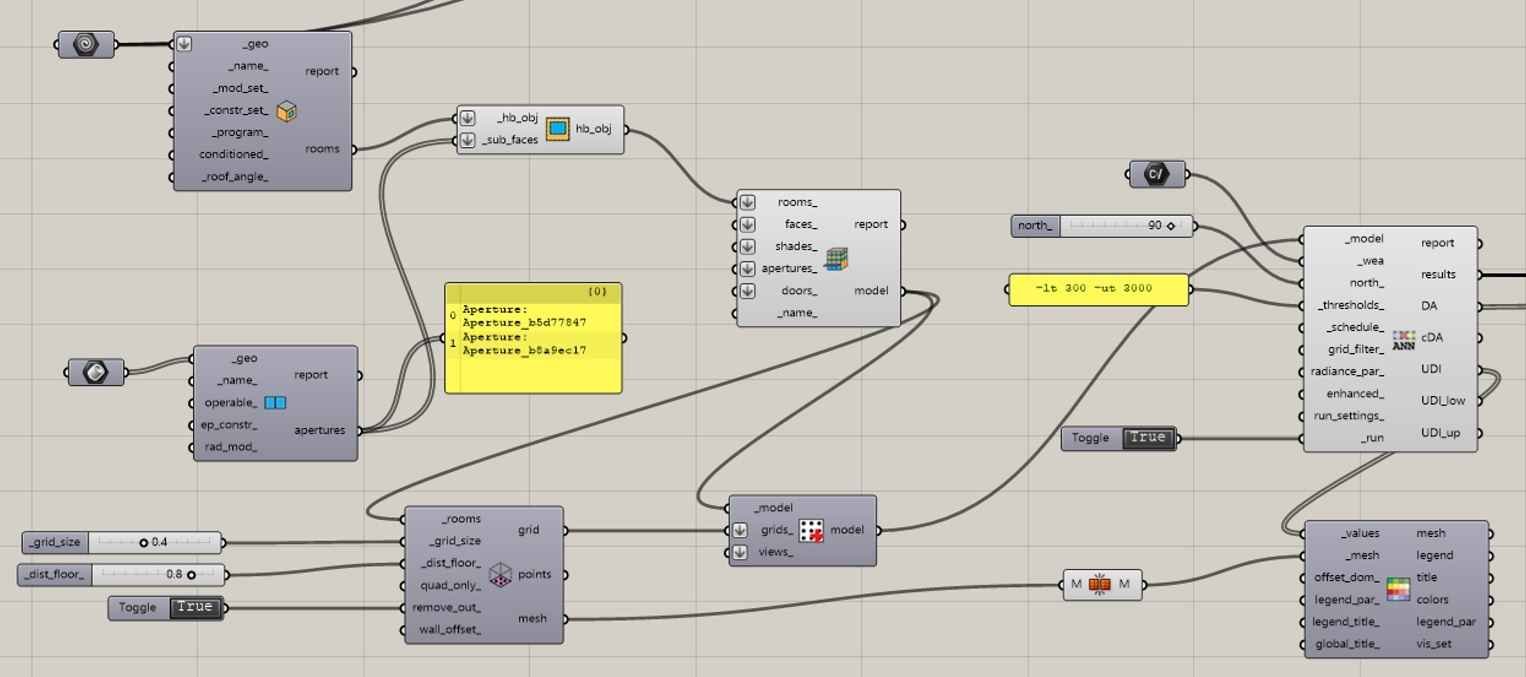
Fig. 6. Daylight simulation.
· UDI
To evaluate daylighting performance, the Honeybee plugin was utilized as the primary simulation tool [56]. For assessing annual daylight performance, the Useful Daylight Illuminance (UDI) metric. UDI is defined as the percentage of occupied time during a year when indoor daylight levels fall within a predefined useful range. This metric distinguishes between three categories: Underlit UDI (below the lower threshold), Overlit UDI (above the upper threshold), and the acceptable range. In this study, the appropriate UDI range is set between 300–500 lux [46], as summarized in Table 2.
Table 2
![Useful daylight illuminance ranges [46].](figures/13-253-20.jpg)
Table 2. Useful daylight illuminance ranges [46].
Glare occurs when the luminance within a space exceeds levels that the human eye can comfortably adapt to during visual tasks, resulting in visual discomfort [47].
· Uniformity of light
Light uniformity refers to the degree to which illumination is evenly distributed across a work or task surface. High uniformity is essential for reducing visual strain, as it minimizes the constant eye adaptation required when moving between overly bright and insufficiently lit areas, thereby lowering the likelihood of visual discomfort. From a technical perspective, light uniformity is assessed through the uniformity of illuminance measured across the task plane. The Illuminance Uniformity or Uniformity Ratio is a commonly used metric for this purpose, defined as the ratio of the minimum illuminance level on a given surface to the average illuminance at that same moment. This metric provides a clear indication of how balanced or uneven the lighting conditions are within space [48,49].
· Illuminance Level
Illuminance level represents the amount of luminous flux incident on a surface per unit area, typically measured in lux (lx), and is a key determinant of visual comfort and task performance in indoor environments. In this study, illuminance was recorded at specific points within the computer labs to capture the spatial distribution of light across different zones. The measurement points were deliberately arranged to reflect three distinct regions: near the windows, the middle zone, and the farthest zone from the windows. This zoning approach enables a comparative assessment of daylight penetration and artificial lighting uniformity, which is essential in evaluating whether lighting conditions satisfy the recommended standards for visual tasks, particularly those involving computer use. Prior studies have emphasized the importance of analyzing illuminance variation across zones, as non-uniform lighting can contribute to discomfort, glare, and reduced productivity [50,51]. By adopting this method, the study ensures that both adequacy and the distribution of illuminance are considered, thereby providing a comprehensive understanding of the indoor environmental quality in the lab.
3. Results
This section presents and analyzes the results of CFD and daylighting simulations conducted to assess the influence of window design variables on natural ventilation and daylighting performance in single-sided computer labs. The analysis examines variations in window-to-wall ratio (WWR) and window placement (single centered versus double-sided windows) and their effects on airflow behavior, ventilation efficiency, air changes per hour (ACH), illuminance distribution, Useful Daylight Illuminance (UDI), daylight uniformity, and point-based lux levels under Jordan’s hot-arid climatic conditions. All scenarios were developed parametrically and evaluated against a baseline case using key performance indicators, including the actual-to-required ventilation ratio (nQ) in accordance with ASHRAE 62.1 and maximum illuminance limits based on ANSI/IESNA guidelines. To ensure consistency with occupant exposure and spatial accuracy, simulation results were extracted at heights of 1.2 m for ventilation analysis and 0.75 m for daylighting analysis, corresponding to the breathing zone and standard work-plane level, respectively.
3.1. Ventilation performance
In computer lab, the airflow is significantly impacted by the window-to-wall ratio (WWR) and window placement as seen in Figs. 10 and 11.
Figure 10
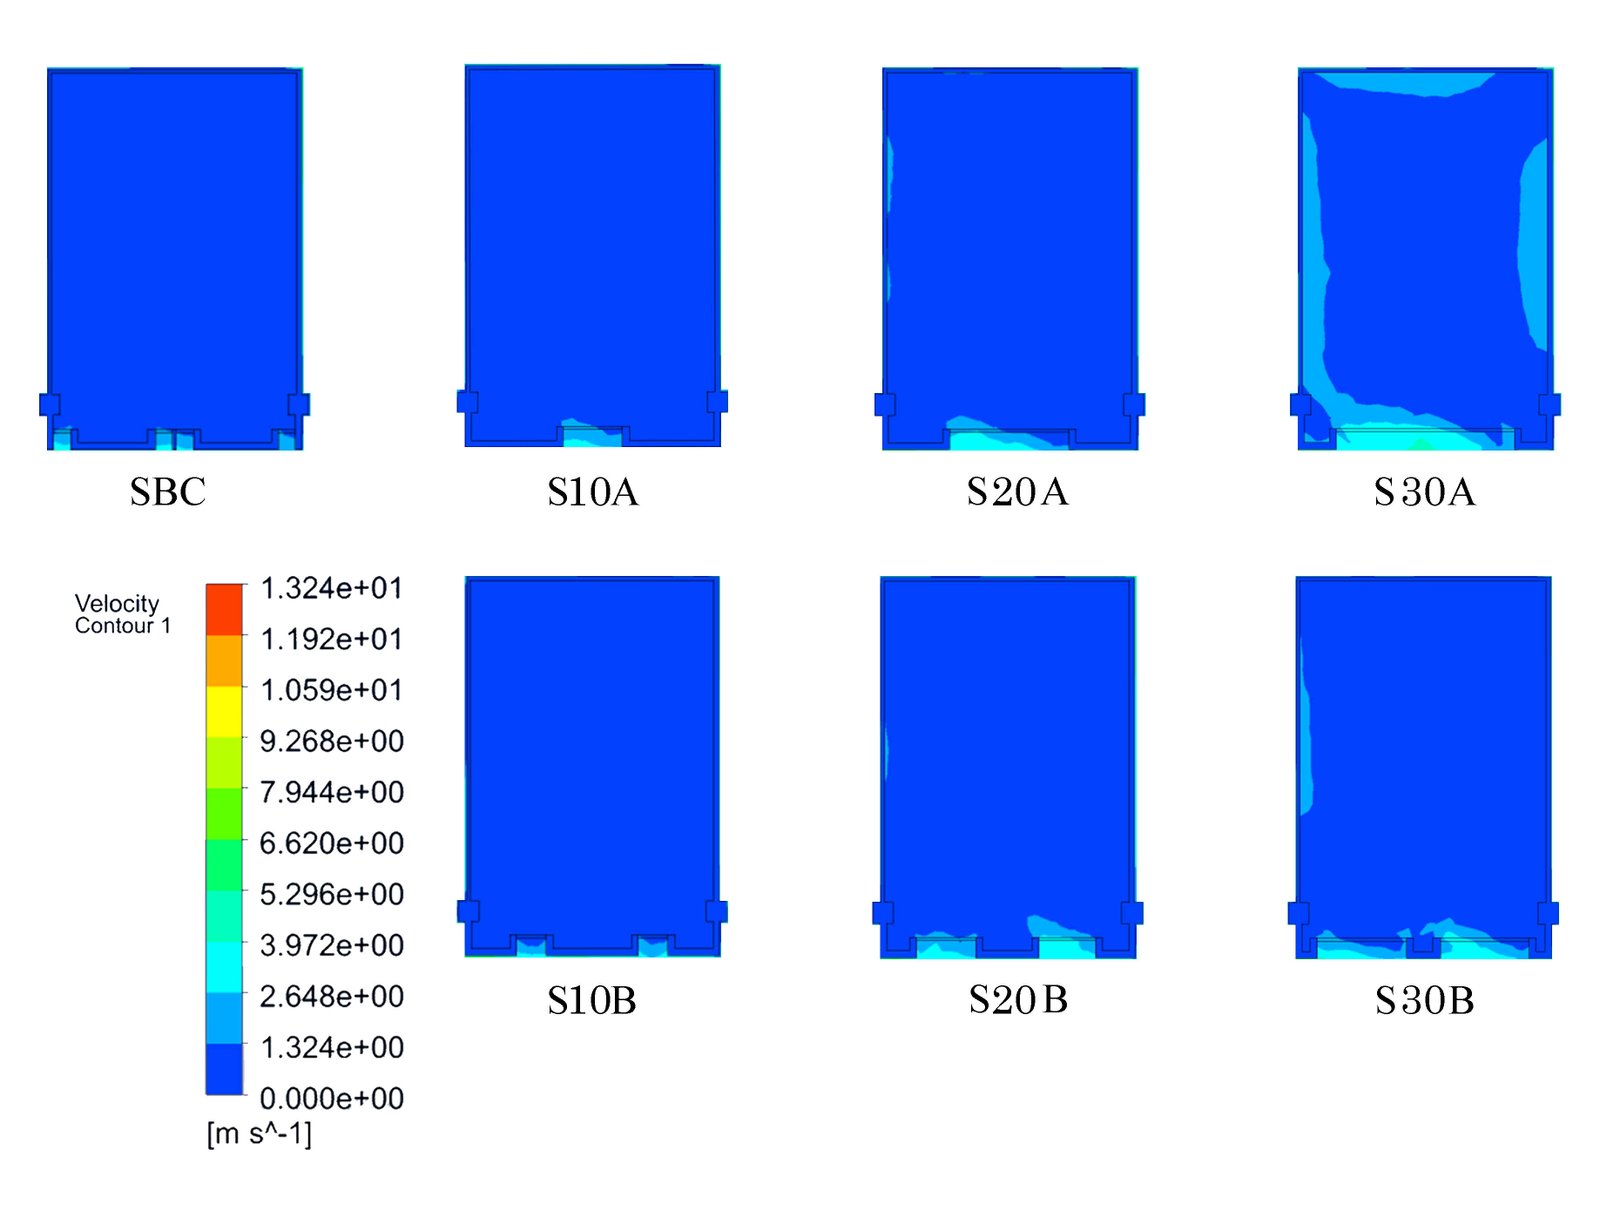
Fig. 10. Single-sided ventilation Velocity profile at 1.2 m interior plane.
Figure 11
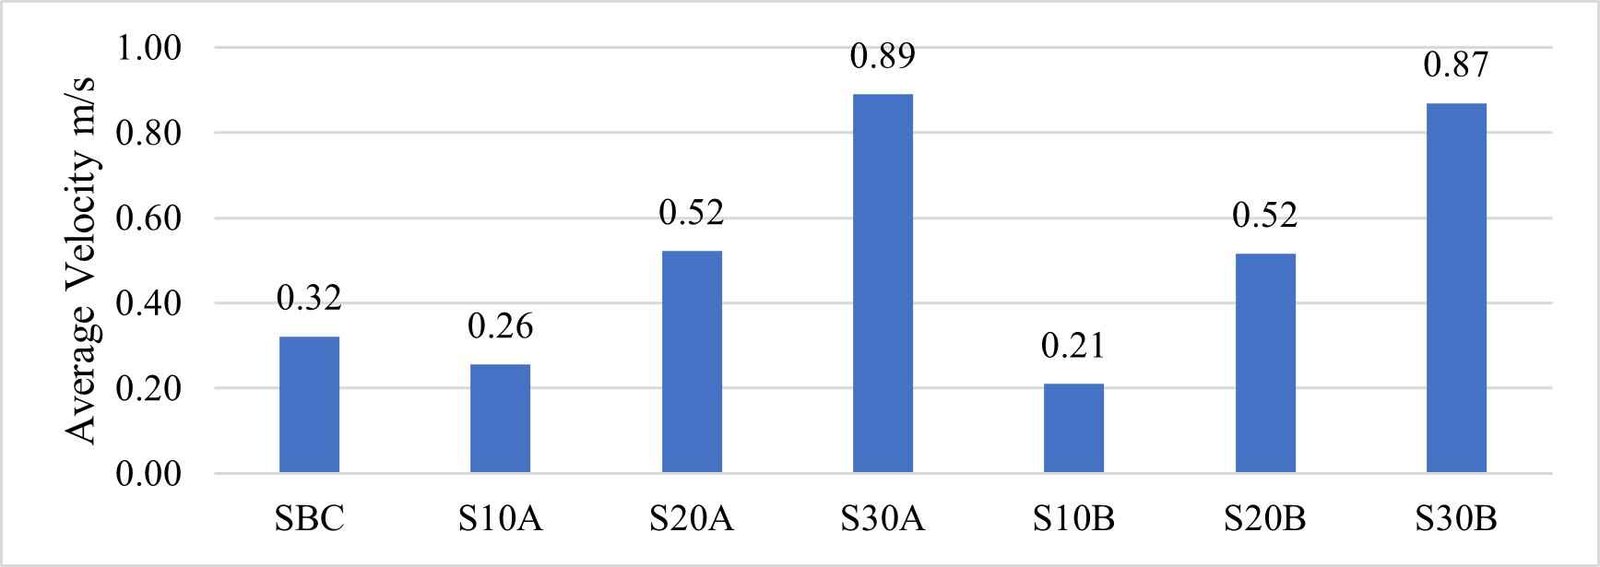
Fig. 11. Single-sided ventilation average velocity at 1.2 meters.
3.1.1. Velocity
The results demonstrate a strong positive relationship between Window-to-Wall Ratio (WWR) and indoor average air velocity when evaluated relative to the base case (SBC = 0.32 m/s). At 10% WWR, airflow performance declines below base case levels, with S10A (0.26 m/s) and S10B (0.21 m/s) showing reductions of approximately 19% and 34%, respectively, indicating that small aperture sizes are insufficient to sustain effective airflow distribution. Increasing WWR to 20% results in a substantial improvement, as both S20A and S20B reach 0.52 m/s, corresponding to a 63% increase compared to SBC, marking a clear transition toward effective ventilation performance. The most pronounced gains occur at 30% WWR, where S30A achieves 0.89 m/s (a 178% increase) and S30B reaches 0.87 m/s (a 172% increase), demonstrating that airflow nearly triples relative to the base case.
At this higher WWR, differences between single-centered and double-sided configurations become minimal (approximately 2%), confirming that airflow performance becomes primarily governed by opening area rather than window arrangement. Overall, increasing WWR from 10% to 30% produces velocity improvements exceeding 170%, whereas configuration-related variations remain comparatively small, reinforcing WWR as the dominant controlling parameter for airflow performance in single-sided spaces.
3.1.2. Mass flow rate, ventilation ratio and ACH (Air change per hour)
The ventilation performance indicators—mass flow rate, ventilation ratio (Q-ratio), and Air Change per Hour (ACH)—collectively confirm that Window-to-Wall Ratio (WWR) is the dominant parameter governing single-sided ventilation, while window configuration exerts a secondary but consistent influence are presented in Fig. 12.
Figure 12
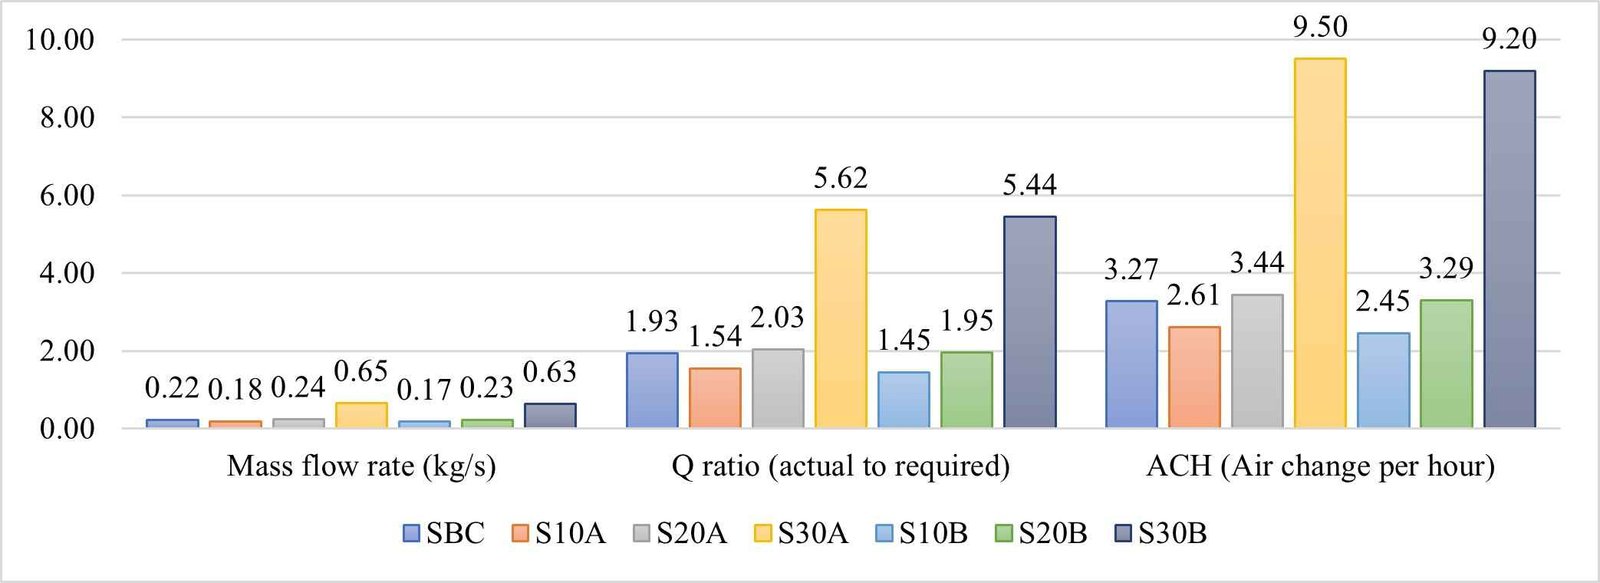
Fig. 12. Single-sided ventilation Mass flow rate, Ventilation Ratio and ACH (Air change per hour).
Across all metrics, increasing WWR results in statistically significant performance gains. At 30% WWR, ventilation performance improves dramatically compared to the base case. The single centered configuration (S30A) increases mass flow rate by approximately 195%, Q-ratio by 191%, and ACH by 190% relative to SBC. The split configuration (S30B) follows closely, with improvements of approximately 186–182%, indicating that at high WWR levels the penalty associated with dividing the opening is limited to less than 10%. These findings demonstrate that once a sufficiently large opening area is provided, airflow performance becomes primarily area-driven rather than configuration-driven.
At the intermediate level (20% WWR), improvements are more modest. Compared to SBC, S20A increases ventilation indicators by approximately 5–9%, while S20B shows only marginal gains (about 1–5%). Although both configurations generally meet ventilation requirements, the single centered opening consistently performs slightly better, confirming its superior aerodynamic efficiency. In contrast, the 10% WWR scenarios perform below the base case across all indicators. Reductions of approximately 18–25% are observed relative to SBC, with the split configuration (S10B) performing worst. At small aperture sizes, dividing the opening exacerbates flow losses, highlighting that insufficient opening area cannot be compensated for by arrangement alone.
Overall, the results quantitatively demonstrate that increasing WWR from 10% to 30% yields performance improvements on the order of 180–195%, whereas configuration-related effects remain within a 2–10% range. This confirms that ventilation robustness in single-sided spaces is primarily governed by opening area, with window arrangement serving as a secondary optimization parameter. Among the tested configurations, a single centralized opening at 30% WWR provides the highest and most reliable ventilation performance.
3.2. Daylighting performance
In the computer lab, the daylight distribution is significantly impacted by the window-to-wall ratio (WWR) and window placement, as presented in Fig. 13.
Figure 13
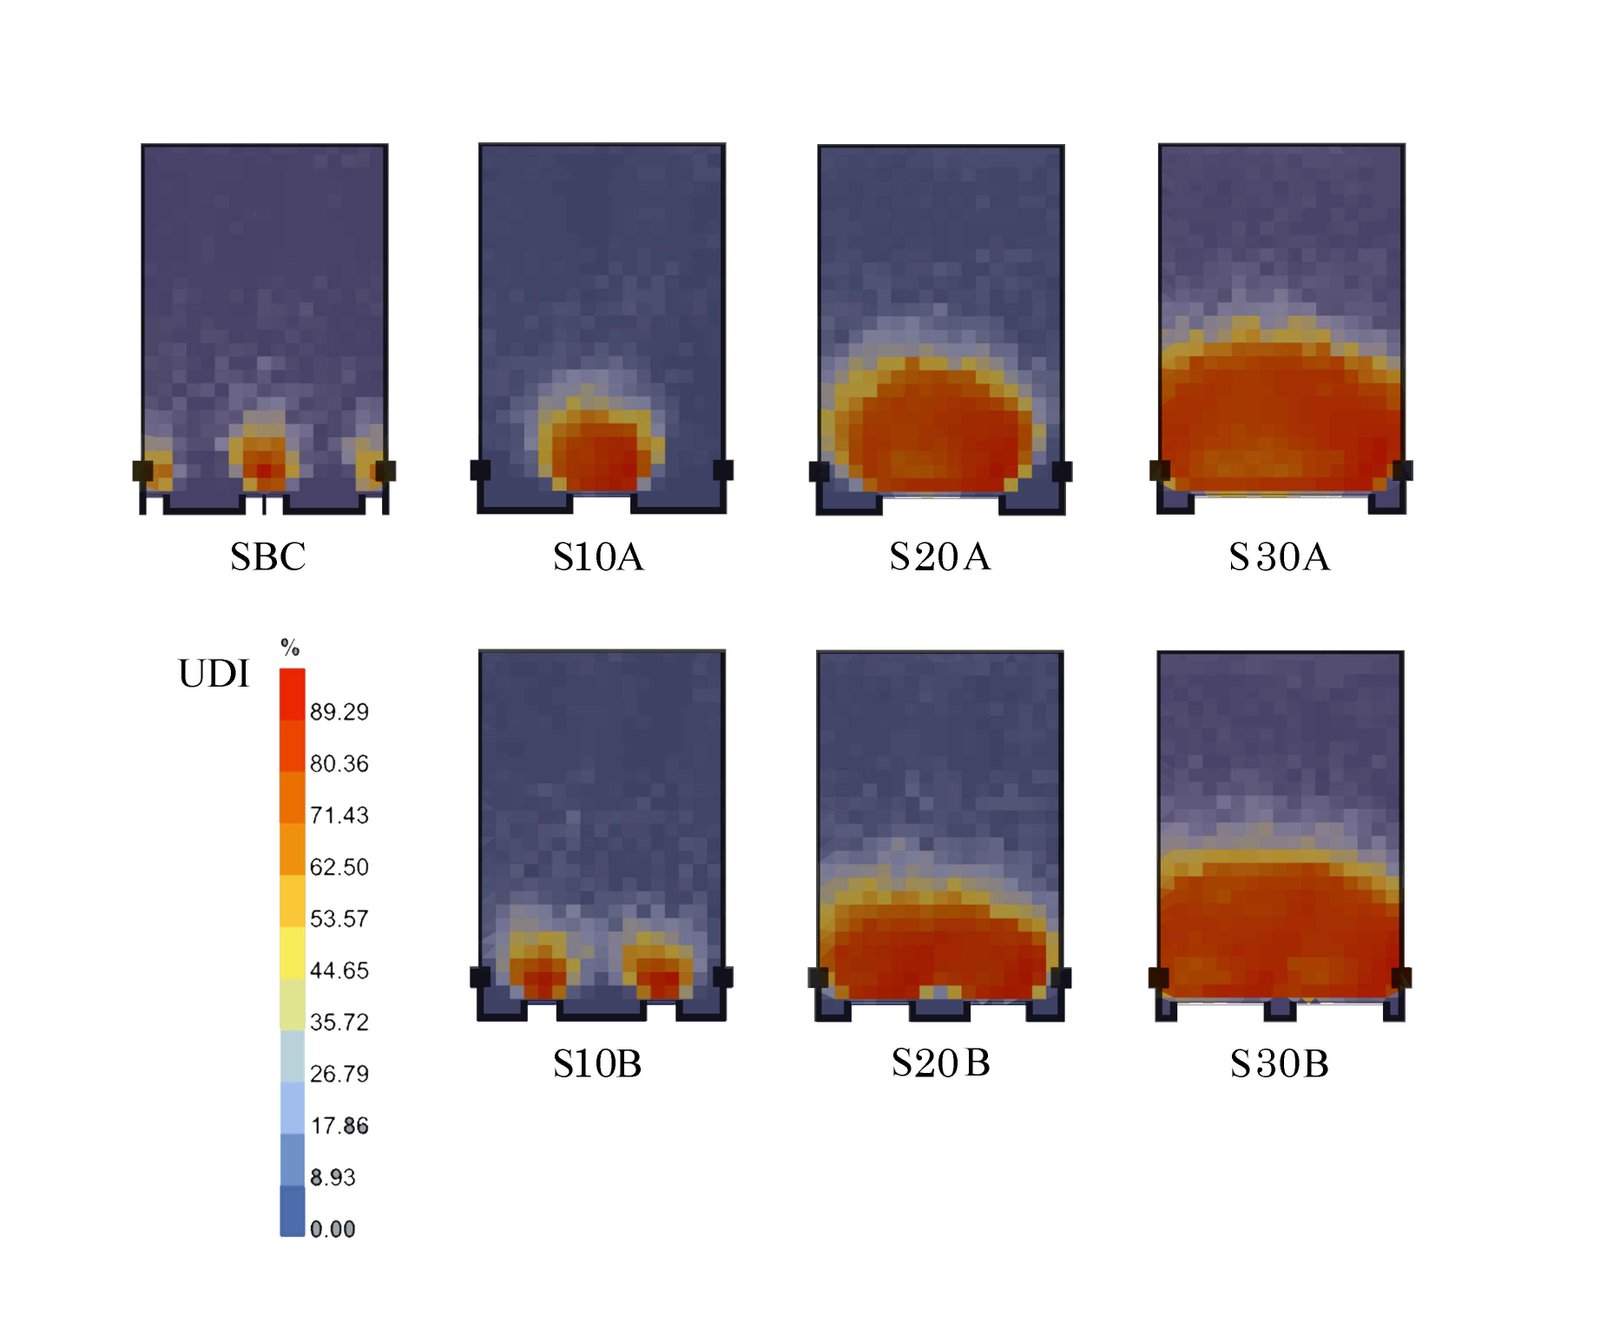
Fig. 13. UDI contour for Single-sided ventilation.
3.2.1. UDI
The Useful Daylight Illuminance (UDI) results show that daylight performance in the single-sided computer lab is strongly influenced by Window-to-Wall Ratio (WWR), while window placement plays a secondary role. The base case exhibits severely underlit conditions throughout the year, with more than 90% of the floor area below 300 lux, confirming inadequate daylight availability.
Increasing WWR improves daylight penetration and reduces underlit areas, particularly in the single centered window configurations (A-series). The 10% WWR cases remain largely underlit, while the 20% WWR configuration provides a noticeable improvement, extending daylight deeper into the space and increasing the proportion of useful daylight without excessive overlighting. The 30% WWR scenarios achieve the highest daylight levels but also introduce substantial overlit areas, significantly increasing glare risk, especially in computer-based environments.
Splitting the opening into two windows (B-series) slightly redistributes daylight laterally but does not significantly enhance overall UDI performance compared with single-window configurations at the same WWR. Seasonal variations follow expected solar path changes, with higher overlighting observed during winter months due to lower solar angles. Overall, the analysis indicates that although larger WWR values increase daylight availability, they also intensify glare-related discomfort. Among the tested configurations, a 20% WWR with a single centered window offers the most balanced daylight performance, achieving meaningful daylight improvement while maintaining acceptable visual comfort for computer lab use. See Table 3.
Table 3
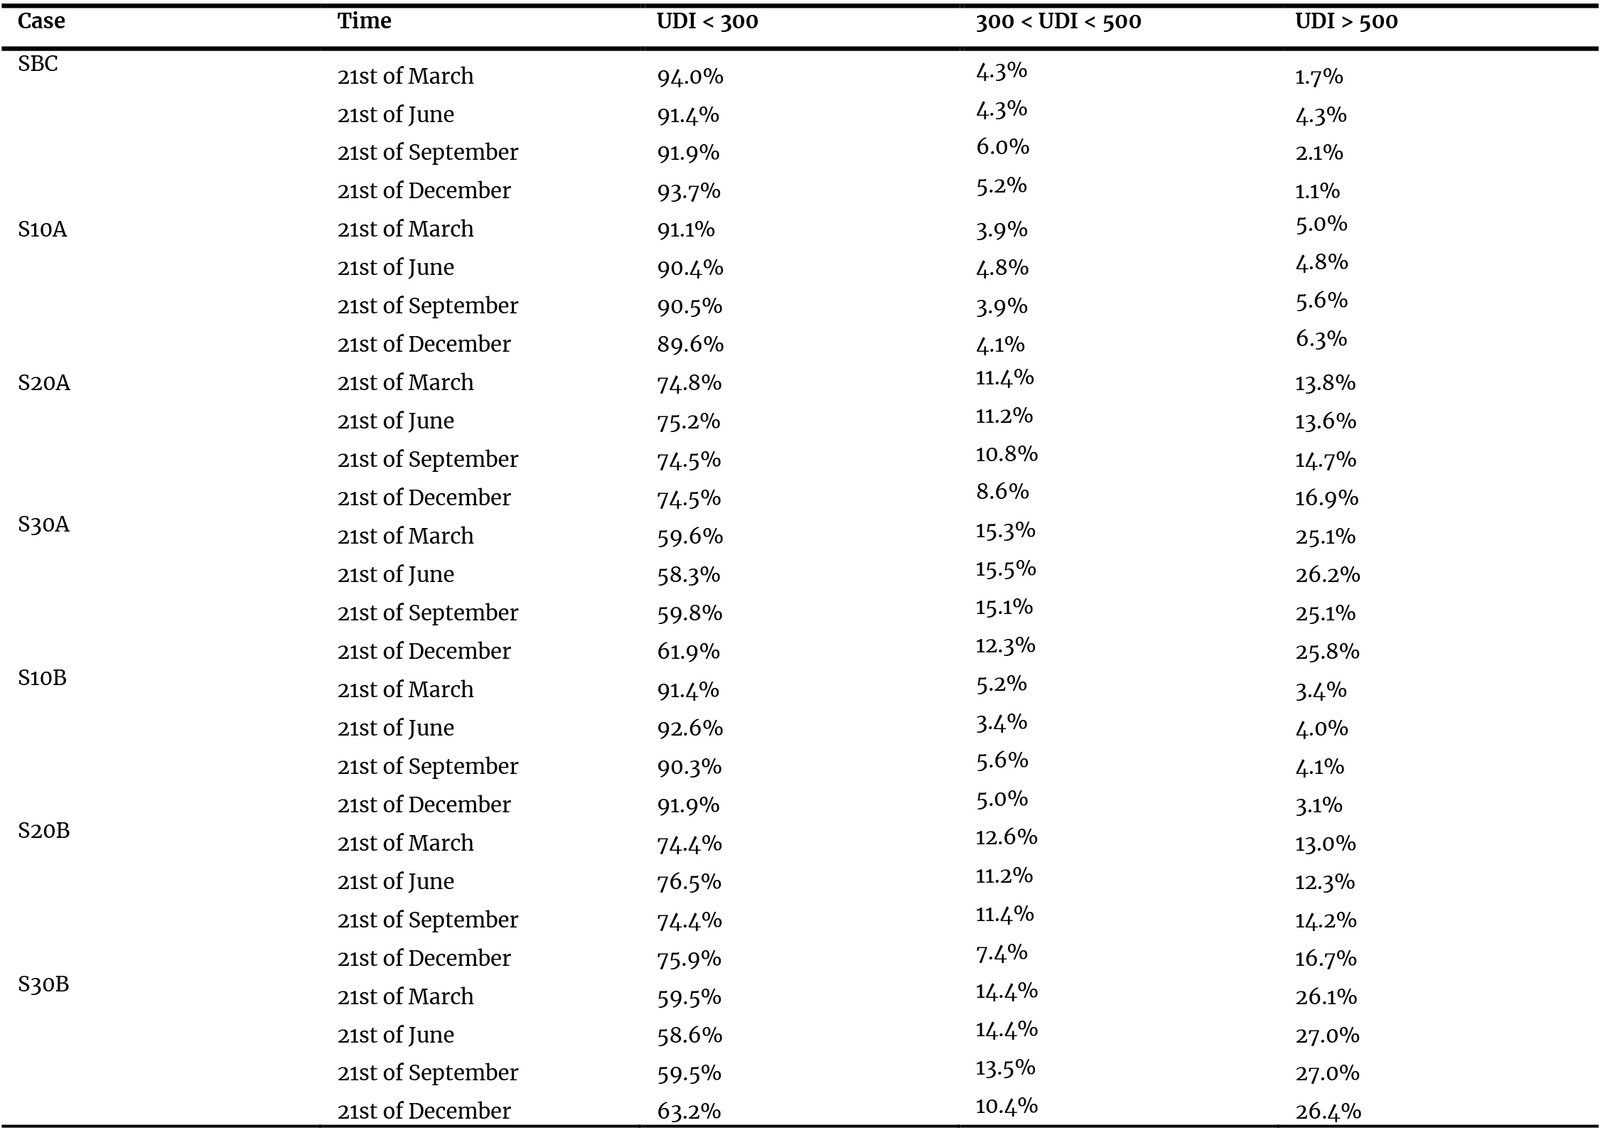
Table 3. UDI values of single-sided ventilation scenarios.
3.2.2. Illuminance Level
The point-based illuminance results reveal that daylight distribution within the computer lab is strongly influenced by both Window-to-Wall Ratio (WWR) and window placement as shown in Figs. 14 and 15. In all scenarios, points closest to the window façade receive the highest illuminance, with single centered window configurations producing pronounced brightness peaks near the front zone, often reaching excessively high levels and increasing glare risk as WWR increases. In contrast, the two-window configurations moderate these peaks by spreading daylight laterally across the façade, resulting in a more balanced and visually comfortable lighting condition for occupants seated near the windows.
Figure 14
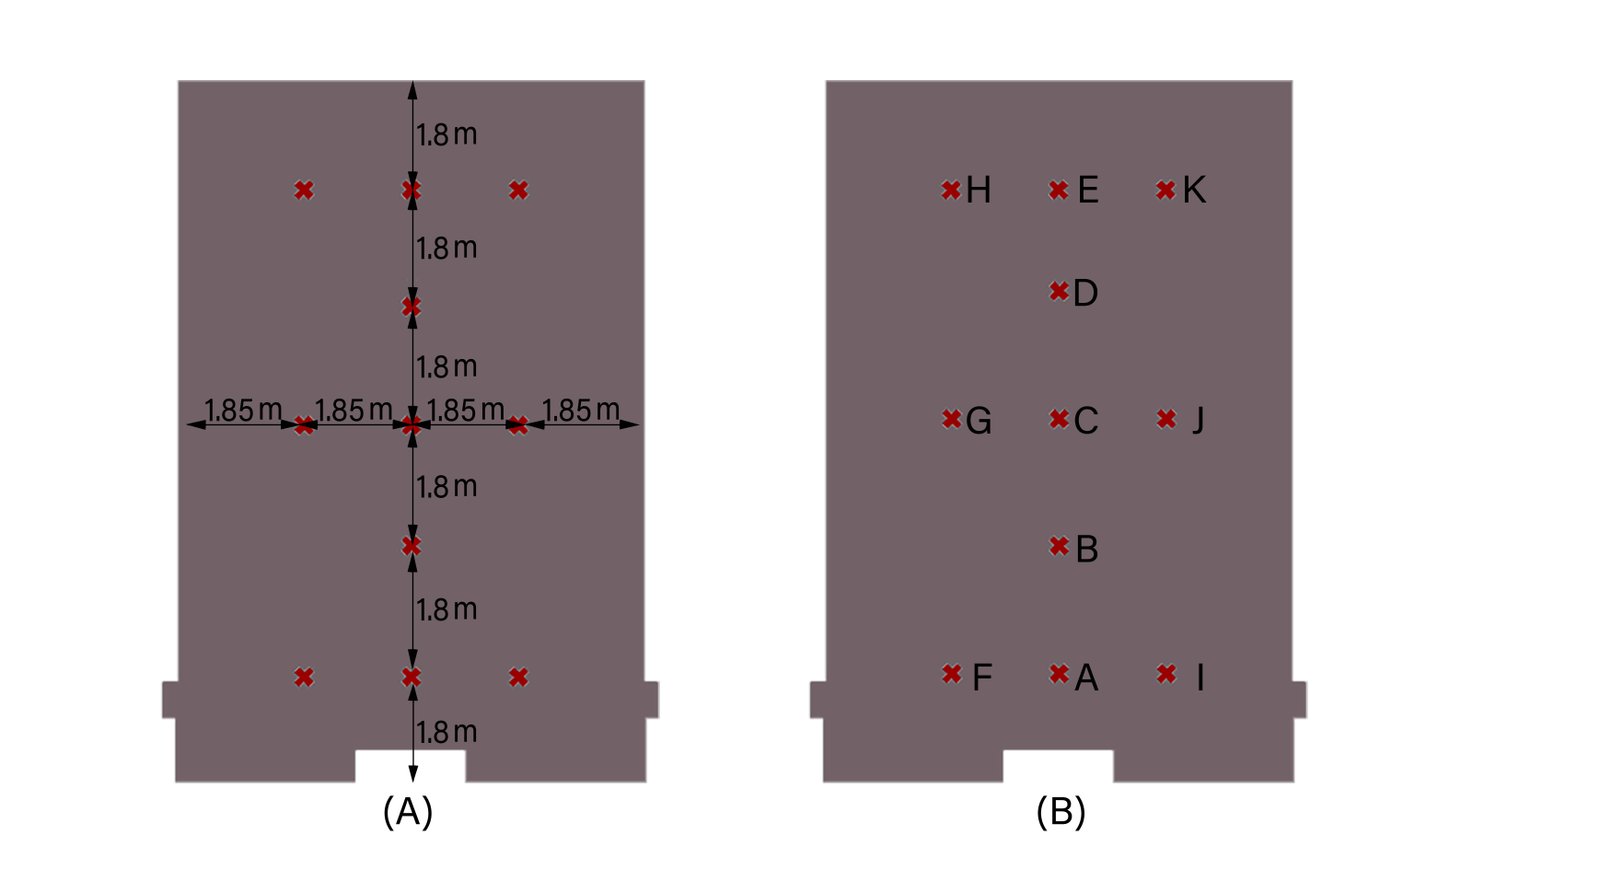
Fig. 14. Single-sided ventilation points (A) points dimensions (B) points name.
Figure 15
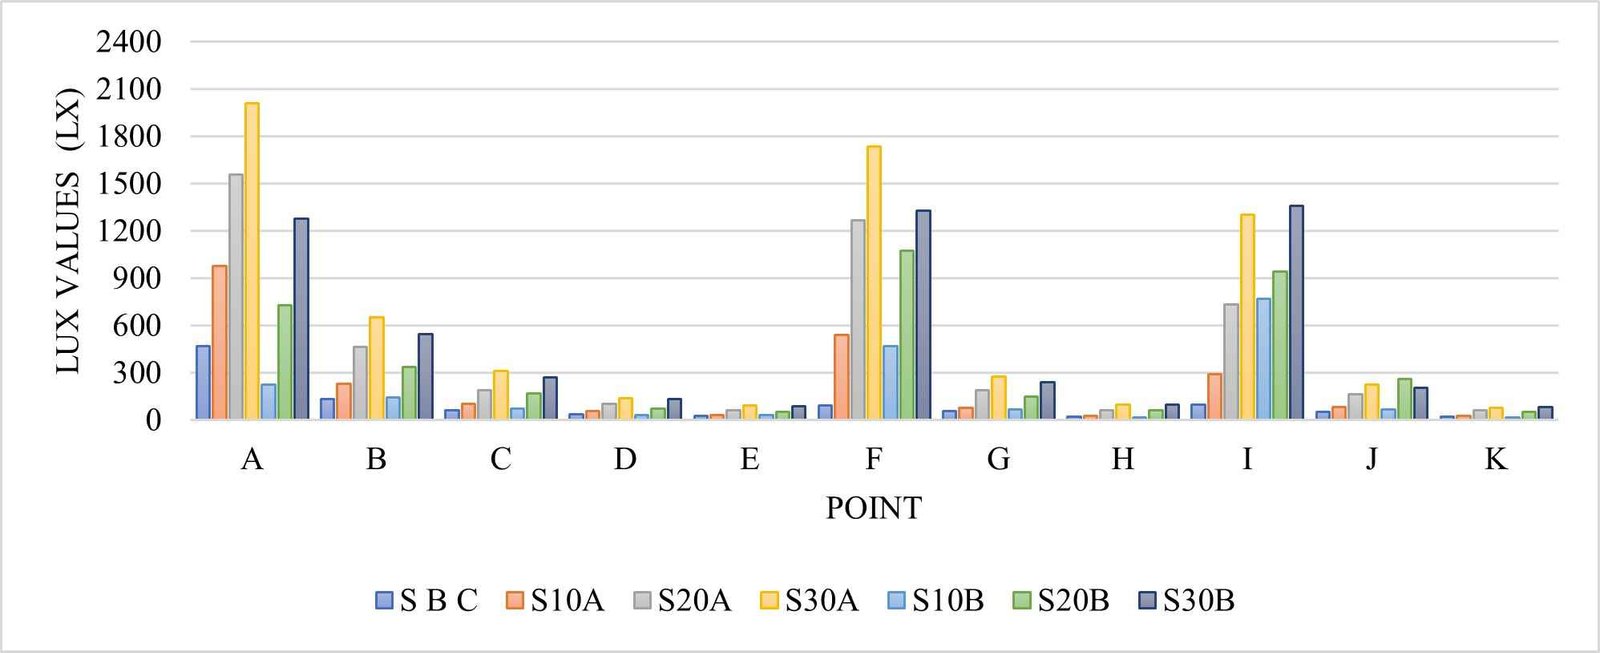
Fig. 15. Lux values for single-sided ventilation points.
Differences between window configurations become more evident toward the middle and rear zones of the room. Single centered windows show a rapid decline in illuminance with depth, leading to uneven lighting and insufficient daylight in mid- and back-row seating areas, even at higher WWR values. The two-window arrangements consistently perform better in these regions by improving horizontal light distribution and extending daylight deeper into space. As a result, configurations with split openings achieve more uniform illuminance across the room depth, reducing reliance on artificial lighting and enhancing overall visual comfort—particularly in areas that typically suffer from low daylight availability in single-sided layouts.
3.2.3. Daylight uniformity
As seen in Fig. 16, the daylight uniformity results reveal measurable variations relative to the base case (SBC = 0.14). Although SBC exhibits a comparatively high uniformity value, this reflects uniformly low illuminance levels rather than balanced daylight performance. At 10% WWR, uniformity decreases by approximately 21% in S10A (0.11) and by 43% in S10B (0.08) compared to the base case, indicating that small apertures lead to uneven light distribution. Increasing WWR to 20% improves performance: S20A (0.13) approaches the base case (−7%), while S20B (0.14) matches it, representing a 75% improvement relative to S10B. The most notable enhancement occurs at 30% WWR in the split-window configuration, where S30B achieves the highest uniformity value (0.16), corresponding to a 14% improvement over the baseline and a 100% increase compared to S10B. In contrast, the single-centered 30% case (S30A = 0.12) remains 14% below base case, suggesting that increasing WWR alone does not guarantee improved uniformity when daylight remains strongly directional. In result, the single centered window configurations (A-series), increasing WWR leads to only modest improvements in uniformity, as daylight remains directional and concentrated along one axis. In contrast, the split-window configurations (B-series) provide a clearer enhancement in daylight uniformity, particularly at higher WWR values.
Figure 16
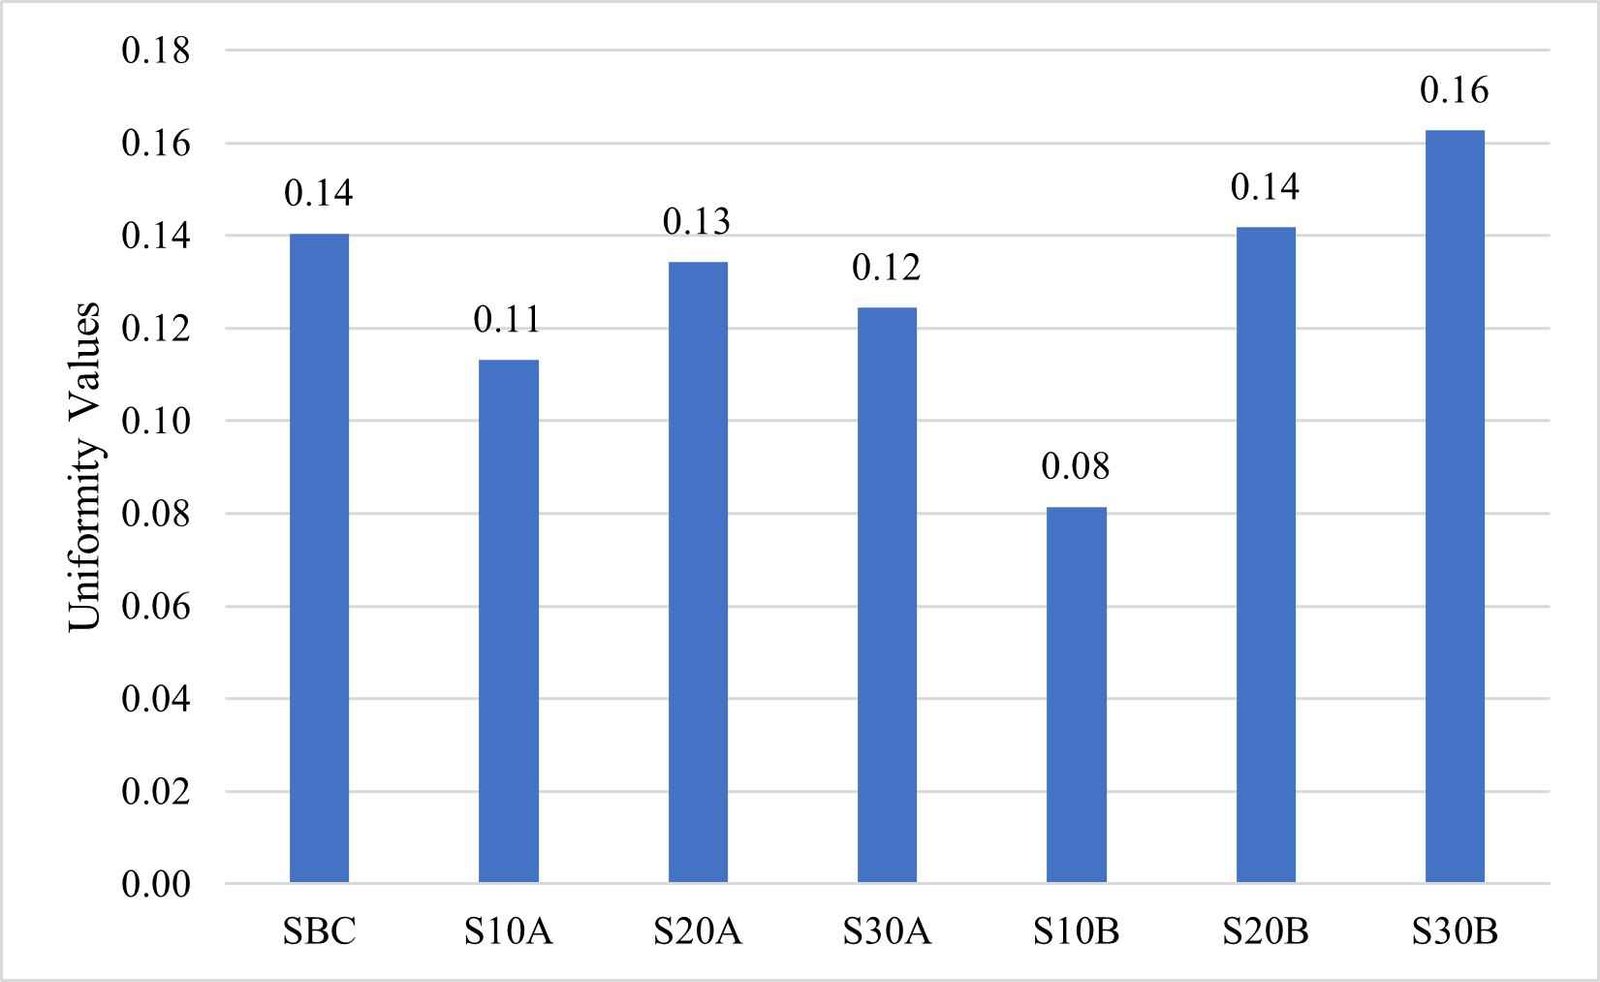
Fig. 16. Daylight uniformity for Single-sided ventilation lab.
3.3. Compromise between ventilation and daylighting
The comparative analysis of single-sided window scenarios demonstrates that optimal ventilation and daylighting performance does not occur within a single discrete configuration, as improvements in one parameter often introduce trade-offs in another. Larger openings enhance airflow and Air Change per Hour (ACH) but tend to increase glare risk, whereas smaller or split openings improve daylight uniformity and glare control at the expense of ventilation effectiveness. This divergence underscores the necessity of a compromise-based approach that systematically balances airflow performance with visual comfort as seen as presented in Fig. 17. Accordingly, a normalized multi-criteria evaluation framework was developed to assess the combined performance of ACH, glare-controlled daylighting (UDI < 500 lux), and daylight uniformity, alongside key geometric parameters such as Window-to-Wall Ratio (WWR) and window spacing.
Figure 17
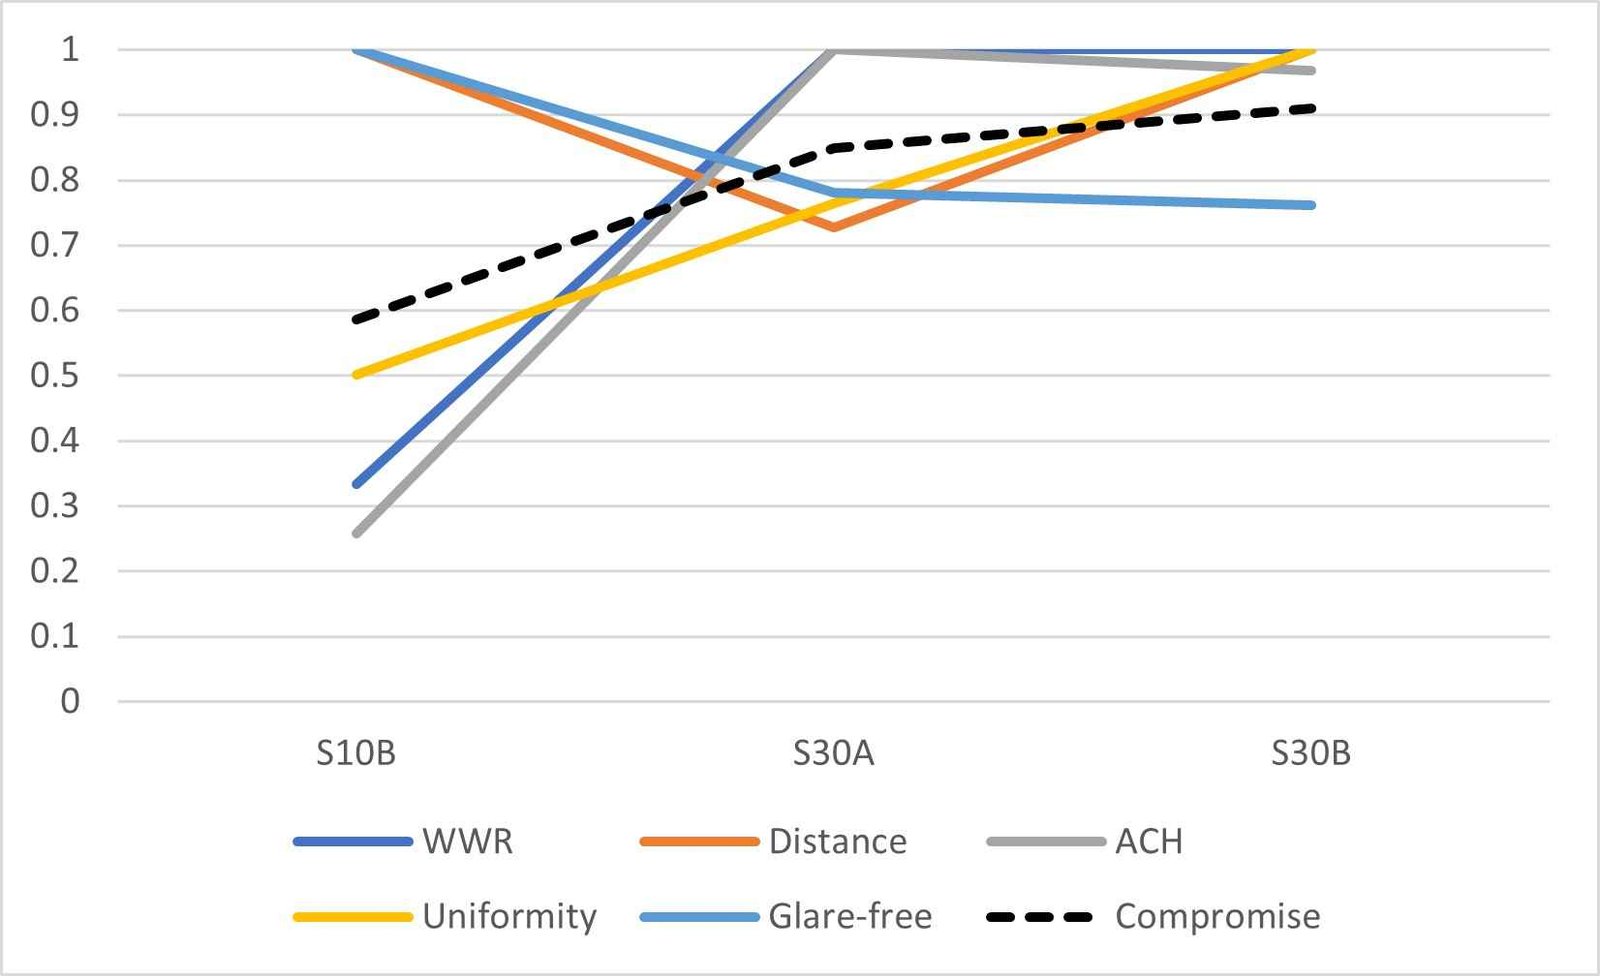
Fig. 17. Single-sided ventilation lab compromise.
The three representative scenarios—S10B, S30A, and S30B—were selected because each demonstrated optimal performance in one of the primary criteria. S10B achieved the highest glare-free daylight percentage, maintaining the largest floor area below the 500-lux threshold recommended for computer-based environments. S30B provided the highest daylight uniformity due to its split-window configuration and increased WWR, which enhanced lateral light distribution. Conversely, S30A delivered the highest ACH, confirming that a large, centralized opening maximizes natural ventilation capacity.
To synthesize these strengths into a unified optimized model, all performance indicators were first normalized using max-value scaling according to Eq. (9):
This transformation converted all variables into dimensionless values within a 0–1 range, eliminating unit inconsistencies and enabling direct comparison. Equal weights were assigned to the three criteria to avoid subjective prioritization and to reflect the equivalent importance of ventilation adequacy and visual comfort in educational environments. Linear regression trendlines were then derived for each normalized variable across the tested WWR cases (10%, 20%, and 30%), following the general linear form Eq. (10):
Given the approximately linear behavior within this range, a unified compromise model was constructed by averaging the slopes and intercepts of the three regression Eq. (11):
This approach yielded the representative compromise Eq. (12):
Because all variables were normalized and equally weighted, the averaged slope and intercept represent the central tendency of the performance envelope, effectively positioning the compromise curve between the three competing trends. A sensitivity reflection indicated that moderate weighting variations would shift the optimal WWR by less than approximately ±2%, confirming the robustness of the solution.
Regression trendlines for the geometric parameters were also derived relative to the same normalized performance spectrum. The resulting equations were:
WWR trendline:
y=0.3333x+0.1111
Distance trendline:
y=0.9093
Compromise trendline:
y= 0.1617x+0.4579
The optimal geometric configuration was determined analytically by solving the intersection between the compromise curve and the geometric trendlines, thereby interpolating between the discrete tested WWR cases. Solving the system yielded:
· Optimal Window-to-Wall Ratio (WWR): 23.54%
· Optimal window spacing: 3.22 m
These values represent the equilibrium point at which ventilation efficiency, glare control, and daylight uniformity achieve their best combined balance—integrating the advantages of S10B, S30A, and S30B while minimizing their respective limitations. The optimized configuration was subsequently adopted to generate a new validation scenario, ensuring that both ventilation and daylighting performance targets are simultaneously satisfied within a single-sided classroom design.
4. Discussion
4.1. Impact of Window-to-Wall Ratio (WWR)
The Window-to-Wall Ratio (WWR) was identified as a key parameter influencing both ventilation and daylighting performance in the analyzed computer laboratories. The simulation results indicate that increasing WWR generally improves airflow rates and daylight penetration; however, these benefits are accompanied by trade-offs related to glare and visual comfort, consistent with previous findings [34,52]. In terms of ventilation performance, larger WWR values resulted in higher Air Change Rates (ACH).
The 30% WWR scenarios (S30A and S30B) achieved the highest ACH among the tested cases, supporting established aerodynamic principles that larger uninterrupted openings increase pressure differentials and volumetric airflow under single-sided ventilation conditions [26]. Conversely, the 10% WWR scenarios consistently exhibited the lowest ventilation performance, reflecting the limited capacity of small openings to drive effective air exchange, as also reported by [53], who found that increasing window opening percentages significantly improves air exchange efficiency. Similar improvements in airflow with larger window sizes were reported by [21], with increases reaching approximately 40%. Despite these improvements, none of the single-sided configurations in this study achieved the recommended 15–20 ACH for computer rooms (EngineeringToolbox), highlighting the inherent limitations of relying solely on single-sided ventilation in high-occupancy, equipment-intensive spaces.
From a daylighting perspective, WWR strongly influenced indoor illuminance levels and daylight penetration depth in single-sided configurations. Increasing WWR reduced underlit zones and improved daylight availability, with the 30% WWR cases (S30A and S30B) demonstrating the deepest daylight penetration and the widest Useful Daylight Illuminance (UDI) coverage near the façade, consistent with [22]. However, larger WWR values also increased the proportion of overlit areas (UDI > 500 lux), thereby intensifying glare risks, which is particularly problematic in computer-based learning environments [27]. Previous studies suggest that daylight performance improves with increasing WWR up to an optimal threshold of around 30%, beyond which visual discomfort and other negative effects become more prominent [54,55]. For instance, [34] reported that WWR values below 20% may result in insufficient daylight at the rear of the room, while windows exceeding 30% WWR may contribute to overheating. Additionally, research conducted in hot and dry climates recommends maintaining relatively lower WWR values to control thermal loads; [56] suggested that optimal WWR should remain below 25%, and around 20% for southeast and southwest building façades. Similarly, [55] proposed optimal WWR ranges of 18–24% for north–south oriented classrooms and 25–30% for east–west orientations to maintain adequate daylight levels without excessive glare.
4.2. Impact of window placement
Window placement significantly influenced airflow performance beyond the effect of the total Window-to-Wall Ratio (WWR). The results show that the A-series configurations, characterized by a single centrally located opening, consistently achieved higher Air Change Rates (ACH) than the split-window B-series, particularly at larger WWR values. This observation aligns with previous research indicating that shifting the front-wall opening away from the central position reduces the amount of ventilation air entering the space [57]. Among all tested scenarios, S30A recorded the highest ACH, demonstrating that ventilation efficiency is governed not only by the opening area but also by window position and the resulting façade pressure distribution. A centrally positioned opening benefits from a more balanced pressure field, which promotes deeper airflow penetration and stronger pressure differentials under wind-driven single-sided ventilation. Similar conclusions have been reported in CFD-based studies showing that indoor airflow patterns are highly sensitive to window location in addition to opening size [28–30]. For instance, [28] found that modifying window placement can increase indoor air movement and improve thermal comfort, particularly when window size and placement are optimized simultaneously. Differences from studies that favor split openings, such as [58], may be attributed to variations in opening location, since asymmetrically placed windows often experience less favorable pressure conditions compared to centrally positioned openings.
From a daylighting perspective, window placement exerted an even stronger influence on indoor light distribution, uniformity, and glare potential in single-sided configurations. The A-series generated concentrated daylight penetration along the central axis, producing high illuminance levels near the façade followed by a rapid reduction toward the rear of the room.
At higher WWR values, particularly in S30A, this concentration resulted in extensive overlit zones (UDI > 500 lux) and increased glare risk, highlighting that daylight performance depends not only on glazing area but also on window location [59,60]. In contrast, the B-series improved horizontal daylight distribution by spreading daylight across the façade, resulting in better spatial uniformity and lower peak illuminance levels, as observed in S30B. These findings are consistent with previous studies indicating that distributed openings enhance daylight balance and improve Useful Daylight Illuminance (UDI) distribution in educational spaces [29,61,62]. For example, [29] reported that side windows alone may struggle to meet daylight performance standards even when WWR is increased to 35–50%, suggesting that window configuration and placement are critical for achieving balanced daylighting conditions. Similarly, [59] concluded that an optimal window configuration for visual comfort in hot and dry climates involves careful control of window placement combined with moderate WWR values, emphasizing the importance of façade design in achieving both daylight quality and visual comfort.
4.3. Ventilation and daylighting compromise
As shown in Fig. 18, The compromise scenario illustrates the effectiveness of a multi-variable optimization approach in achieving balanced environmental performance compared with extreme single-parameter solutions. It achieves a 60% ACH, representing a significant improvement over the single-sided base case (34%) while avoiding the excessive window sizes and glare risks associated with high-ACH cases such as S30A and S30B. In terms of daylighting, the compromise configuration maintains high uniformity (82%), only slightly lower than the base case, while providing substantially improved daylight penetration and more functionally useful illumination. Glare control is also balanced, with 81% glare-free area—positioned between low-WWR scenarios with minimal glare and high-WWR cases with increased visual discomfort. Overall, the compromise scenario successfully integrates enhanced ventilation, adequate daylight availability, and acceptable glare control, demonstrating its suitability as an optimized solution for single-sided computer lab design.
Figure 18
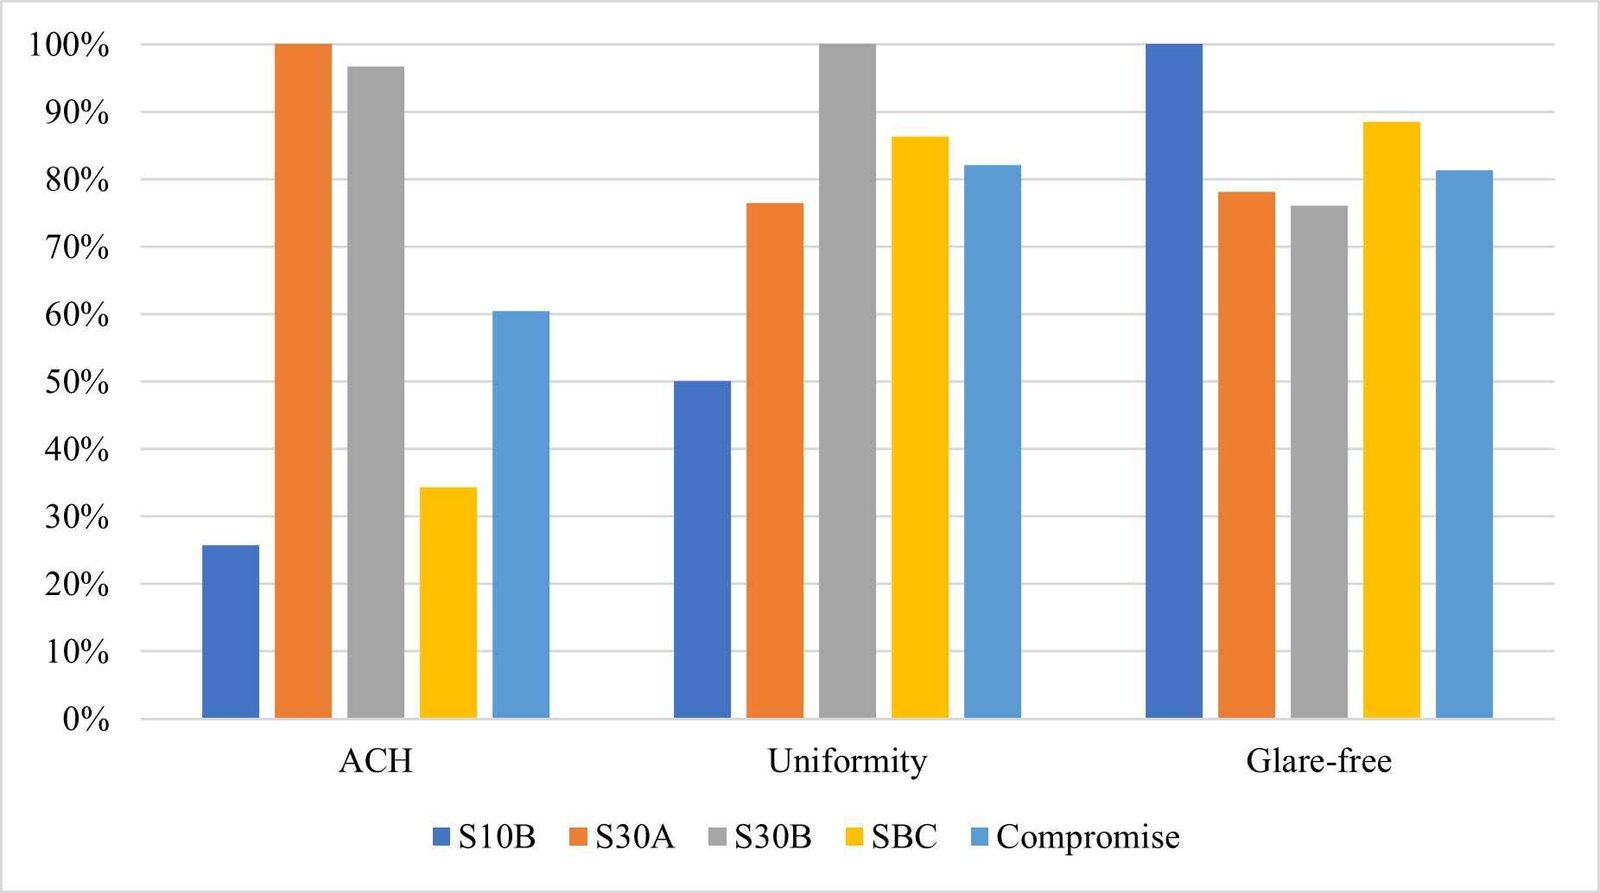
Fig. 18. Comparison of Key Ventilation and Daylighting Metrics for Single-Sided Lab Scenarios.
It is important to interpret the results within the broader climatic context of hot-arid environments. Although increasing the window-to-wall ratio improves natural ventilation potential and daylight availability, larger façade openings may also introduce additional solar heat gains during extreme summer conditions characterized by high solar radiation and elevated outdoor air temperatures. In such climates, the effectiveness of natural ventilation depends not only on airflow capacity but also on the temperature of incoming air. Furthermore, airborne dust is a common environmental factor in many hot-arid regions, which may present operational challenges for naturally ventilated computer laboratories containing sensitive electronic equipment. It should also be noted that the ventilation analysis in this study was conducted using steady-state CFD simulations under a fixed wind speed and direction, allowing controlled comparison between design scenarios under identical boundary conditions. Consequently, transient wind variations and buoyancy-driven airflow effects were not explicitly modeled, and the results should therefore be interpreted as indicating relative performance trends rather than providing full climatic predictability. Accordingly, the optimal WWR value identified in this study ( 23.5%) should be understood as a compromise solution derived primarily from ventilation and daylight performance criteria rather than a comprehensive thermal or environmental optimization. Future research may extend this work by integrating transient airflow modeling, thermal comfort analysis, adaptive shading strategies, and dust mitigation measures to further refine façade design recommendations for hot-arid climates.
5. Conclusion
This study investigated the combined effects of Window-to-Wall Ratio (WWR) and window placement on natural ventilation and daylighting performance in a single-sided computer lab located in a hot-arid climate. Using an integrated simulation framework combining CFD and climate-based daylighting analysis, the research demonstrated that window design plays a critical role in shaping indoor environmental quality in highly constrained educational spaces.
The results confirm that increasing WWR significantly improves ventilation performance and daylight penetration; however, excessive WWR introduces visual discomfort due to glare and uneven illuminance, particularly in single large openings. While single centered windows maximize airflow efficiency, split-window configurations enhance daylight uniformity and reduce glare by distributing light more evenly across the space. These findings highlight that opening geometry, in addition to opening size, is essential in achieving balanced performance.
To address the inherent trade-offs between ventilation and daylighting, a multi-criteria compromise analysis was developed. The optimized configuration—characterized by a WWR of approximately 23.5% and a window spacing of about 3.2 m—achieved improved ventilation, adequate daylight availability, and acceptable glare control simultaneously.
Overall, the study demonstrates that balanced, performance-based window design can significantly enhance indoor environmental quality in single-sided computer labs, providing practical design guidance for educational buildings in hot-arid regions.
Funding
The authors acknowledge the support for this paper provided by the Jordan University of Science and Technology, as well as funding from the Ministry of Higher Education and Research (grant number ENE/01/07/2016), titled “Energy Efficiency Measures to Integrate into Remodeling Public Buildings.
Author Contributions
Rahaf M. AlMomani: Writing – review & editing, Writing – original draft, Visualization, Validation, Supervision, Software, Resources, Project administration, Methodology, Investigation, Funding acquisition, Formal analysis, Data curation, Conceptualization. Ahmed A. Freewan: Writing – review & editing, Writing – original draft, Visualization, Validation, Supervision, Software, Resources, Project administration, Methodology, Investigation, Funding acquisition, Formal analysis, Data curation, Conceptualization. All authors have read and agreed to the published version of the manuscript.
Declaration of competing interest
The authors have no relevant financial or non-financial interests to disclose. The authors have no conflicts of interest to declare that are relevant to the content of this article. All authors certify that they have no affiliations with or involvement in any organization or entity with any financial interest or non-financial interest in the subject matter or materials discussed in this manuscript. The authors have no financial or proprietary interest in any material discussed in this article.
References
- M. Frontczak, P. Wargocki, Literature survey on how different factors influence human comfort in indoor environments, Build. Environ. 46 (2011) 922-937. https://doi.org/10.1016/j.buildenv.2010.10.021
- Y. Al Horr, M. Arif, A. Kaushik, A. Mazroei, M. Katafygiotou, E. Elsarrag, Occupant productivity and office indoor environment quality: A review of the literature, Build. Environ. 105 (2016) 369-389. https://doi.org/10.1016/j.buildenv.2016.06.001
- F.H. Chang, Y.Y. Li, C.Y. Tsai, C.R. Yang, Specific indoor environmental quality parameters in college computer classrooms, (2009).
- D. Norbäck, K. Nordström, Z. Zhao, Carbon dioxide (CO 2) demand-controlled ventilation in university computer classrooms and possible effects on headache, fatigue and perceived indoor environment: an intervention study, Int. Arch. Occup. Environ. Health 86 (2013) 199-209. https://doi.org/10.1007/s00420-012-0756-6
- A. Kabirikopaei, J. Lau, J. Nord, J. Bovaird, Identifying the K-12 classrooms' indoor air quality factors that affect student academic performance, Science of the Total Environment 786 (2021) 147498. https://doi.org/10.1016/j.scitotenv.2021.147498
- S. Deng, J. Lau, Seasonal variations of indoor air quality and thermal conditions and their correlations in 220 classrooms in the Midwestern United States, Build. Environ. 157 (2019) 79-88. https://doi.org/10.1016/j.buildenv.2019.04.038
- G. PĒLMANIS, G. VITOLS, AIR QUALITY IN COMPUTER LABORATORIES: CO2 SENSOR SOLUTIONS, in: 18th International Scientific Conference STUDENTS ON THEIR WAY TO SCIENCE (Undergraduate, Graduate, Post-Graduate Students) Collection of Abstracts April 21, 2023, 2023: p. 22.
- W.U. Danjuma, O.O. Ajayi, A.S. Daramola, Assessment of building forms and orientation techniques that enhance natural ventilation and light for improved indoor air quality, African Journal of Environmental Sciences and Renewable Energy 19 (2025) 308-323. https://doi.org/10.62154/ajesre.2025.019.01029
- K. Bamdad, S. Matour, N. Izadyar, S. Omrani, Impact of climate change on energy saving potentials of natural ventilation and ceiling fans in mixed-mode buildings, Build. Environ. 209 (2022) 108662. https://doi.org/10.1016/j.buildenv.2021.108662
- H.B. Awbi, -ventilation, Renewable and Sustainable Energy Reviews 2 (1998) 157-188. https://doi.org/10.1016/S1364-0321(98)00015-X
- Y. Chen, Z. Tong, W. Wu, H. Samuelson, holly samuelson, Achieving natural ventilation potential in practice: Control schemes and levels of automation, Appl. Energy (2019). https://doi.org/10.1016/j.apenergy.2018.11.016. https://doi.org/10.1016/j.apenergy.2018.11.016
- R. Yao, V. Costanzo, X. Li, Q. Zhang, B. Li, The effect of passive measures on thermal comfort and energy conservation. A case study of the Hot Summer and Cold Winter climate in the Yangtze River region, Journal of Building Engineering 15 (2017). https://doi.org/10.1016/j.jobe.2017.11.012. https://doi.org/10.1016/j.jobe.2017.11.012
- H. Zhang, D. Yang, V.W.Y. Tam, Y. Tao, G. Zhang, S. Setunge, L. Shi, A critical review of combined natural ventilation techniques in sustainable buildings, Renewable and Sustainable Energy Reviews 141 (2021) 110795. https://doi.org/10.1016/j.rser.2021.110795
- S.N. Ma'bdeh, A. Al-Zghoul, T. Alradaideh, A. Bataineh, S. Ahmad, Simulation study for natural ventilation retrofitting techniques in educational classrooms-A case study, Heliyon 6 (2020). https://doi.org/10.1016/j.heliyon.2020.e05171
- L.S. Birnbaum, D.F. Staskal, Brominated flame retardants: cause for concern?, Environ. Health Perspect. 112 (2004) 9-17. https://doi.org/10.1289/ehp.6559
- M. Telejko, Attempt to improve indoor air quality in computer laboratories, Procedia Eng. 172 (2017) 1154-1160. https://doi.org/10.1016/j.proeng.2017.02.134
- W.K.E. Osterhaus, Discomfort glare assessment and prevention for daylight applications in office environments, Solar Energy 79 (2005) 140-158. https://doi.org/10.1016/j.solener.2004.11.011
- K. Yildirim, M.L. Hidayetoglu, A. Capanoglu, Effects of interior colors on mood and preference: comparisons of two living rooms, Percept. Mot. Skills 112 (2011) 509-524. https://doi.org/10.2466/24.27.PMS.112.2.509-524
- Z. Argunhan, A.S. Avci, Statistical evaluation of indoor air quality parameters in classrooms of a university, Advances in Meteorology 2018 (2018) 4391579. https://doi.org/10.1155/2018/4391579
- D. Palanisamy, B.K. Ayalur, Development and testing of condensate assisted pre-cooling unit for improved indoor air quality in a computer laboratory, Build. Environ. 163 (2019) 106321. https://doi.org/10.1016/j.buildenv.2019.106321
- S.N. Ma'bdeh, A.A. Hamasha, M. Al-Shawabkeh, R.O. Alali, R.M. Almomani, L.M. Obeidat, O.F. Alrebei, Enhancing office air quality: The role of window to wall ratio with window-wind catchers using CFD analysis, Energy Reports 13 (2025) 1508-1524. https://doi.org/10.1016/j.egyr.2025.01.038
- J. Jayaram, L. Sundaram, Evaluation of Window-to-Wall Ratio, Shading Devices, and Site Vegetation for Enhanced Daylight Availability-Optimization of Fenestration for School Classrooms in Chennai, (2025). https://doi.org/10.20944/preprints202502.1494.v2
- H. Nazer, Developing an energy benchmark for residential apartments in Amman, Jordan Green Building Council, 2019.
- S. V Ershov, V.G. Sokolov, A.G. Voloboy, V.A. Galaktionov, Effective Simulation of Spatial Daylight Autonomy and Annual Sunlight Exposure, in: Graphicon-Conference on Computer Graphics and Vision, 2022: pp. 64-72. https://doi.org/10.20948/graphicon-2022-64-72
- C. Eckes, The autonomy of the EU legal order, C. Eckes,'The Autonomy of the EU Legal Order'4 (2020) 1. https://doi.org/10.14324/111.444.ewlj.2019.19
- A. Alsehail, A. Almhafdy, The effect of Window-To-Wall ratio (WWR) and window orientation (WO) on the thermal performance: a preliminary overview, Environment-Behaviour Proceedings Journal 5 (2020) 165-173. https://doi.org/10.21834/ebpj.v5i15.2500
- O.S. Asfour, A comparison between the daylighting and energy performance of courtyard and atrium buildings considering the hot climate of Saudi Arabia, Journal of Building Engineering 30 (2020) 101299. https://doi.org/10.1016/j.jobe.2020.101299
- G. Elshafei, A. Negm, M. Bady, M. Suzuki, M.G. Ibrahim, Numerical and experimental investigations of the impacts of window parameters on indoor natural ventilation in a residential building, Energy Build. 141 (2017) 321-332. https://doi.org/10.1016/j.enbuild.2017.02.055
- Z.S. Zomorodian, S.S. Korsavi, M. Tahsildoost, The effect of window configuration on daylight performance in classrooms: A field and simulation study, International Journal of Architectural Engineering and Urban Planning 26 (2016) 15-24.
- N. Yoon, M.A. Piette, J.M. Han, W. Wu, A. Malkawi, Optimization of window positions for wind-driven natural ventilation performance, Energies (Basel). 13 (2020) 2464. https://doi.org/10.3390/en13102464
- M.A. Tomić, B.B. Milutinović, P.M. Živković, P.S. Đekić, A.D. Boričić, Measurement and improvement of indoor air quality in an information technology classroom, Thermal Science 18 (2014) 915-924. https://doi.org/10.2298/TSCI1403915T
- K. Yildirim, A. Capanoglu, K. Cagatay, The effects of physical environmental factors on students' perceptions in computer classrooms, Indoor and Built Environment 20 (2011) 501-510. https://doi.org/10.1177/1420326X11411135
- H.B. Awbi, Design considerations for naturally ventilated buildings, Renew. Energy 5 (1994) 1081-1090. https://doi.org/10.1016/0960-1481(94)90135-X
- W.N.H.W. Abdullah, A. Ismail, A.H.A. Tharim, F.S. Ibrahim, W.N.S.W. Mohammad, Identifying Optimal Window-To-Wall Ratio (Wwr) and Window-to-Floor Ratio (WFR) For Typical Higher Educational Classrooms to Address Deficiencies in Daylighting Design, Malaysian Journal of Sustainable Environment 12 (2025) 81-102. https://doi.org/10.24191/myse.v12i2.7059
- S.S. Alrwashdeh, Investigation of wind energy production at different sites in Jordan using the site effectiveness method, Energy Engineering 116 (2019) 47-59. https://doi.org/10.1080/01998595.2019.12043338
- D.W. Etheridge, M. Sandberg, Building ventilation: theory and measurement, John Wiley & Sons Chichester, UK, 1996.
- P. Heiselberg, K. Svidt, P. V Nielsen, Characteristics of airflow from open windows, Build. Environ. 36 (2001) 859-869. https://doi.org/10.1016/S0360-1323(01)00012-9
- A. Sahu, S. Sahu, Y. Verma, V. Banjare, A.K. Garg, S. Panda, Optimizing Energy Efficiency in Indian Buildings: A Comprehensive Analysis of Current Norms and Proposed Guidelines for Strategic Placement and Orientation, (2024).
- F. Musau, K. Steemers, Space planning and energy efficiency in laboratory buildings: the role of spatial, activity and temporal diversity, Archit. Sci. Rev. 50 (2007) 281-292. https://doi.org/10.3763/asre.2007.5034
- E.M. Ahmad, K. Kaharuddin, J. Jufriadi, Learning Space Transformation, International Journal of Asian Education 4 (2023) 223-234. https://doi.org/10.46966/ijae.v4i4.355
- Y. Abu-Zidan, P. Mendis, T. Gunawardena, Optimising the computational domain size in CFD simulations of tall buildings, Heliyon 7 (2021). https://doi.org/10.1016/j.heliyon.2021.e06723
- L.M. Obeidat, J.R. Jones, D.M. Mahaftha, A.I. Amhamed, O.F. Alrebei, Optimizing indoor air quality and energy efficiency in multifamily residences: Advanced passive pipe system parametrics study, International Journal of Environmental Science and Technology (2024). https://doi.org/10.1007/s13762-024-05624-6
- L.M. Obeidat, J.R. Jones, D.M. Mahaftha, A.I. Amhamed, O.F. Alrebei, Optimizing indoor air quality and energy efficiency in multifamily residences: Advanced passive pipe system parametrics study, International Journal of Environmental Science and Technology 21 (2024) 10003-10026. https://doi.org/10.1007/s13762-024-05624-6
- F. Abdulla, S. Farahat, Impact of Climate Change on the Performance of Wastewater Treatment Plant: Case study Central Irbid WWTP (Jordan), Procedia Manuf. 44 (2020) 205-212. https://doi.org/10.1016/j.promfg.2020.02.223. https://doi.org/10.1016/j.promfg.2020.02.223
- J. Mardaljevic, M. Andersen, N. Roy, J. Christoffersen, Daylighting metrics: is there a relation between useful daylight illuminance and daylight glare probabilty?, in: Proceedings of the Building Simulation and Optimization Conference BSO12 , UK, (10-11/9/ 2012) 189-197.
- U.S.G.B. Council, LEED v4 for building design and construction, USGBC Inc 332 (2014).
- S. Carlucci, F. Causone, F. De Rosa, L. Pagliano, A review of indices for assessing visual comfort with a view to their use in optimization processes to support building integrated design, Renewable and Sustainable Energy Reviews 47 (2015) 1016-1033. https://doi.org/10.1016/j.rser.2015.03.062
- S. Szentesi-Nejur, F. De Luca, K. Flamand, Simulation based daylight uniformity optimizations for elementary school projects in Quebec province, in: Proceedings of the 40th ECAADe Conference, Belgium, 16/9/2022: pp. 13-16.
- S. Carlucci, F. Causone, F. De Rosa, L. Pagliano, A review of indices for assessing visual comfort with a view to their use in optimization processes to support building integrated design, Renewable and Sustainable Energy Reviews 47 (2015) 1016-1033. https://doi.org/10.1016/j.rser.2015.03.062
- M.-C. Dubois, Å. Blomsterberg, Energy saving potential and strategies for electric lighting in future North European, low energy office buildings: A literature review, Energy Build. 43 (2011) 2572-2582. https://doi.org/10.1016/j.enbuild.2011.07.001
- C.F. Reinhart, D.A. Weissman, The daylit area-Correlating architectural student assessments with current and emerging daylight availability metrics, Build. Environ. 50 (2012) 155-164. https://doi.org/10.1016/j.buildenv.2011.10.024
- T.S. Wei, M.H.A. Nasir, A.S. Hassan, H.S. Basher, M.N.M. Nawi, T.D. Mustapha, The Influence of Window-To-Wall Ratio (WWR) on Airflow Profile for Improved Indoor Air Quality (IAQ) in a Naturally-Ventilated Workshop in a Hot-Humid Climate, Journal of Advanced Research in Fluid Mechanics and Thermal Sciences 116 (2024) 139-157. https://doi.org/10.37934/arfmts.116.1.139157
- X. Liu, H. Wang, Z. Li, J. Zhao, C. Li, D. Xie, Effectiveness of natural ventilation through single-sided window opening in air-conditioning rooms, Energy Build. 314 (2024) 114260. https://doi.org/10.1016/j.enbuild.2024.114260
- M.I. Ayoosu, Y.-W. Lim, P.C. Leng, O.M. Idowu, Daylighting evaluation and optimisation of window to wall ratio for lecture theatre in the tropical climate, Journal of Daylighting 8 (2021) 20-35. https://doi.org/10.15627/jd.2021.2
- J. Jeyaradha, S. Lakshmi, Evaluation of Window-to-Wall Ratio, Shading Devices, and Site Vegetation for Enhanced Daylight Availability-Optimizing Fenestration Design in Chennai School Classrooms, (2025). https://doi.org/10.20944/preprints202502.1494.v1
- M. Alwetaishi, A. Taki, Investigation into energy performance of a school building in a hot climate: Optimum of window-to-wall ratio, Indoor and Built Environment 29 (2020) 24-39. https://doi.org/10.1177/1420326X19842313
- M.A. Hassan, M.R. Shaalan, K.M. El-Shazly, Effects of window size and location and wind direction on thermal comfort with single-sided natural ventilation, in: World Renewable Energy Congress VIII (WREC 2004). Copyright, 2004.
- J. Cho, C. Yoo, Y. Kim, Effective opening area and installation location of windows for single sided natural ventilation in high-rise residences, Journal of Asian Architecture and Building Engineering 11 (2012) 391-398. https://doi.org/10.3130/jaabe.11.391
- M. Rais, S. Elhadad, A. Boumerzoug, B. Baranyai, Optimum window position in the building façade for high day-light performance: Empirical study in hot and dry climate, Pollack Periodica 15 (2020) 211-220. https://doi.org/10.1556/606.2020.15.2.19
- S. Ma'bdeh, H. Matar, Designing a dynamic fenestration to improve visual performance in educational spaces using daylight, Periodicals of Engineering and Natural Sciences 8 (2020) 1898-1910. https://doi.org/10.21533/pen.v8.i3.1222
- A. Maurya, R. Kumar, A. Kumar, Assessing Window Design's Impact on Daylight Uniformity in Classrooms in Patna, India, Engineering, Technology & Applied Science Research 13 (2023) 11898-11903. https://doi.org/10.48084/etasr.6212
- S. Farivar, S. Teimourtash, Impact of window design on dynamic daylight performance in an office building in Iran, Journal of Daylighting 10 (2023) 31-44. https://doi.org/10.15627/jd.2023.3
2383-8701/© 2026 The Author(s). Published by solarlits.com. This is an open access article distributed under the terms and conditions of the Creative Commons Attribution 4.0 License.

668
Total views
Citations
SHARE ON


