Article | 14 June 2026
Volume 13 Issue 1 pp. 333-346 • doi: 10.15627/jd.2026.19
Optimising Daylight Performance in Healthcare Buildings with a Computational Framework Under the Impact of the Climate Crisis
Mustafa Serhan ÜNLÜTÜRK,* Resul ÖZLÜK
Author affiliations
Balikesir University, Department of Architecture, Cagis Campus, 10100, Altieylul, Balikesir, Turkey
*Corresponding author.
serhan.unluturk@balikesir.edu.tr (M. S. Ünlütürk)
resul.ozluk@balikesir.edu.tr (R. Özlük)
History: Received 8 February 2026 | Revised 23 April 2026 | Accepted 26 April 2026 | Published online 14 June 2026
2383-8701/© 2026 The Author(s). Published by solarlits.com. This is an open access article distributed under the terms and conditions of the Creative Commons Attribution 4.0 License.
Citation: Mustafa Serhan ÜNLÜTÜRK, Resul ÖZLÜK, Optimising Daylight Performance in Healthcare Buildings with a Computational Framework Under the Impact of the Climate Crisis, Journal of Daylighting, 13:1 (2026) 333-346. doi: 10.15627/jd.2026.19
Figures and tables
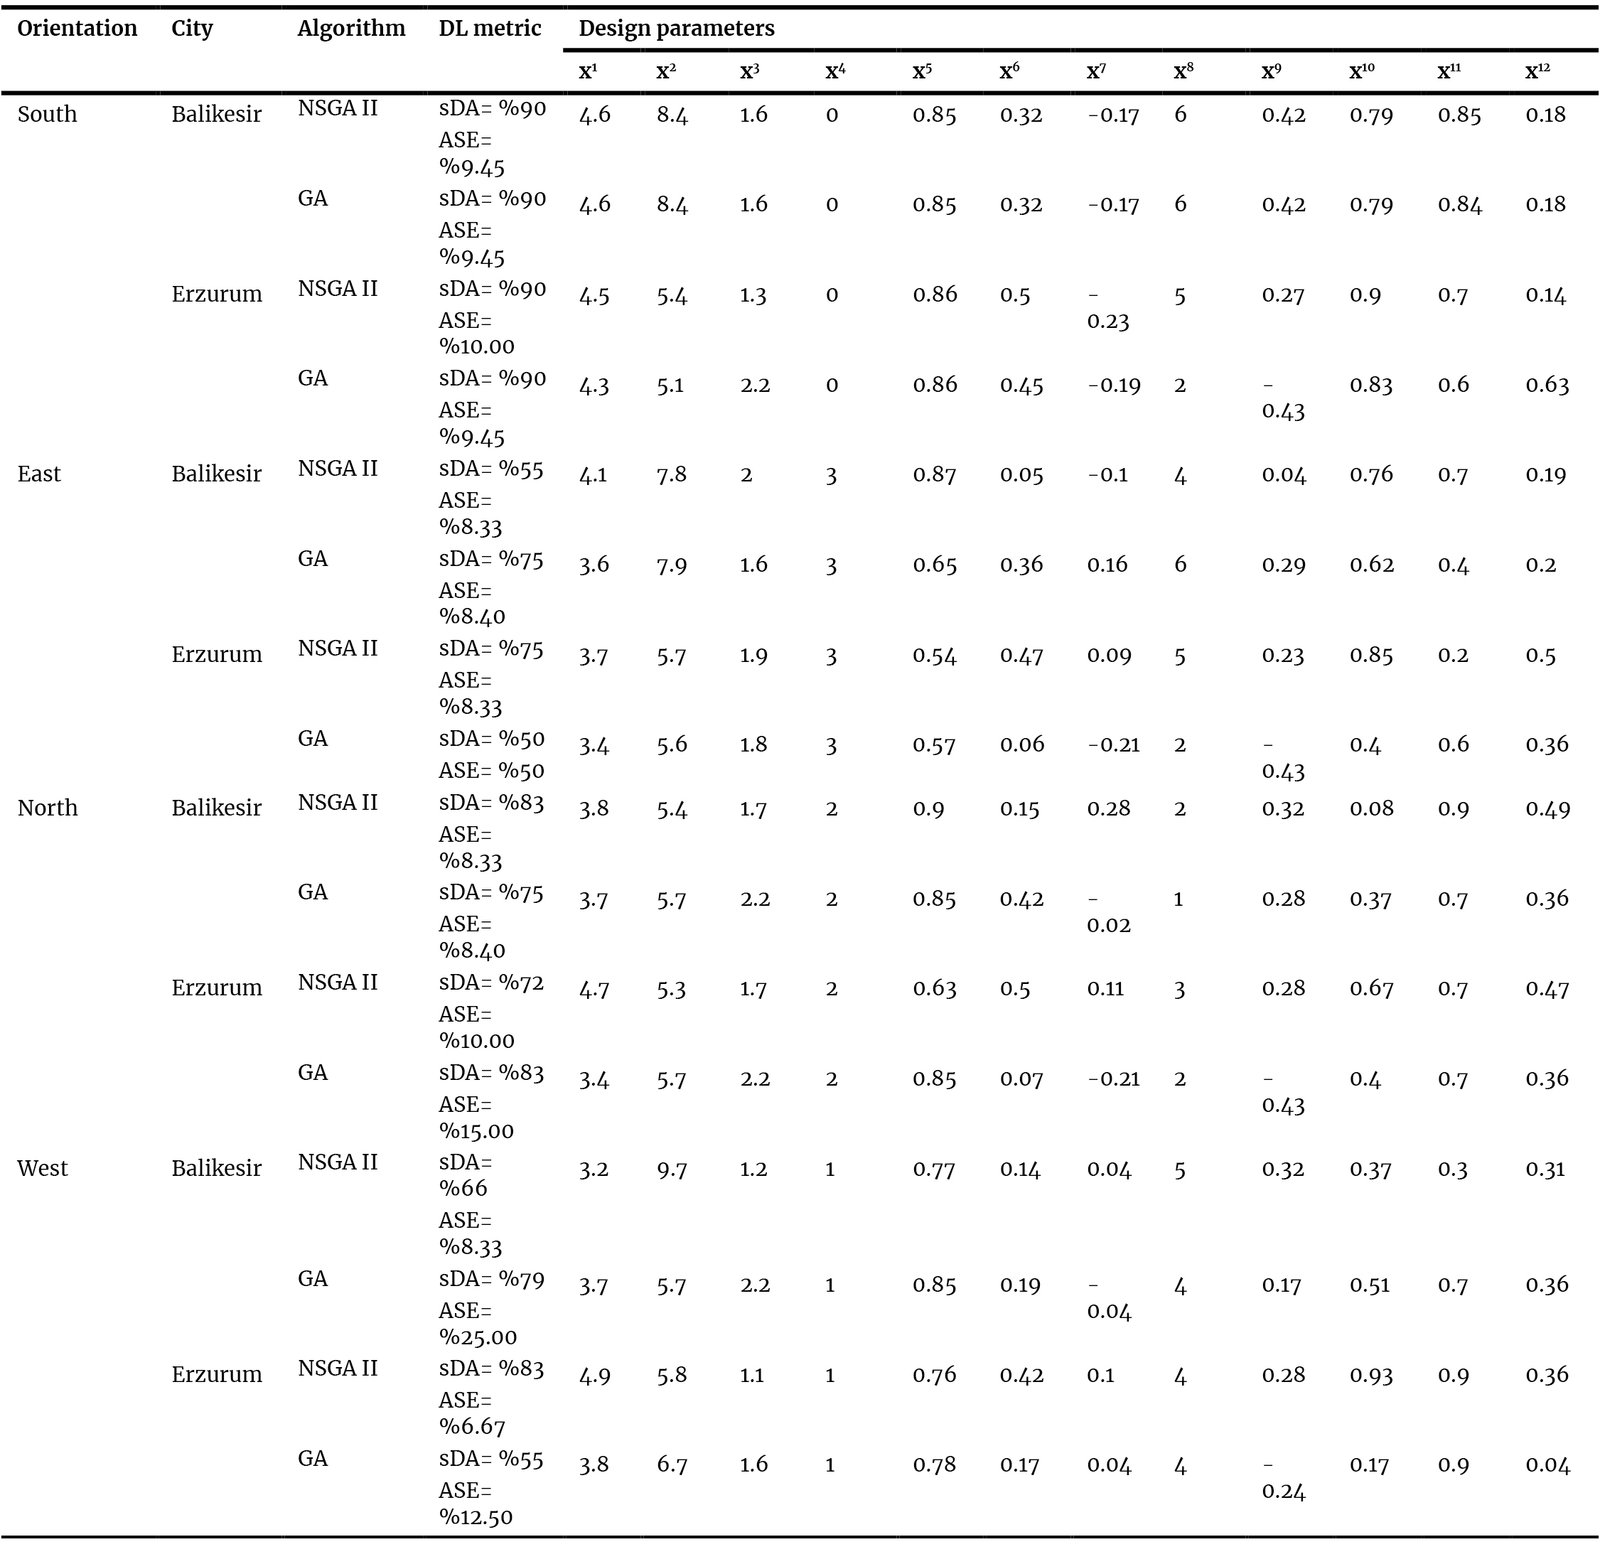 Table 3
Abstract
Daylight has a direct impact on patient comfort and building energy consumption in healthcare facilities. It is essential to design healthcare facilities using strategies that prioritise individual health and account for time constraints, in line with the European Union Sustainable Development Goals. The design process for these structures requires orientation and sunlight exposure decisions to be performance-based. The parameters defined during the design process have a direct impact on daylight performance. This condition results in a reduction of spatial Daylight Autonomy (sDA) metric, which indicates the brightness level of a space throughout the year, while increasing the Annual Sunlight Exposure (ASE). This study evaluated the sDA and ASE metrics in the scope of LEED v4 and IES LM-83 standards. This study proposes a computational optimisation-based patient room design strategy for two regions in Türkiye's different climate zones. The developed parametric model is designed within a multi-objective performance evaluation framework and aims to analyse 12 design variables that affect indoor daylight performance, including room depth, room width, shading elements, and surface reflectance, using sDA and ASE daylight criteria. Within the scope of the study's objective, the design parameters of healthcare buildings exhibiting optimal visual performance for the Mediterranean (CSA) and Continental (DFB) climate zones at mid-latitudes will be regionally classified. The computational optimisation used in the study tests the sensitivity of performance outputs to climate variability by integrating future climate projections into the model in line with the climate-responsive design approach. The study optimised and compared results using the Galapagos Genetic Algorithm and the Wallacei NSGA-II algorithm. The study found that the patient room orientation and the plan depth are decisive factors in the performance of interior daylight. The study found the optimum sDA value in the Mediterranean climate with more shading elements in wider, deeper plans, while in the continental climate, wide-window solutions in shallow plan depths achieved 90% sDA. In the optimised models, ASE remained within the 9-10% threshold. The study defines threshold values for daylight-centred designs in patient rooms across different climate zones and provides a quantitative decision-support framework for performance-oriented design in future climate projections.
Keywords
daylight, optimisation, healthcare buildings, computational framework
Nomenclature
| ANN | Artificial neural network |
| ASE | Annual sunlight exposure |
| DA | Daylight autonomy |
| DF | Daylight factor |
| DGP | Daylight glare probability |
| MOO | Multi objective optimisation |
| sDA | Spatial daylight autonomy |
| SOO | Single objective optimisation |
| TEC | Total energy consumption |
| UDI | Useful daylight illuminance |
| WWR | Window to Wall Ratio |
1. Introduction
The design of healthcare buildings is a critical issue in terms of both reducing energy consumption and ensuring user comfort by providing daylight performance within the interior space. Unlike other building types, healthcare facilities accommodate users for extended periods, and recovery processes are directly influenced by environmental conditions [1]. This study examines the relationship between visual and physiological comfort in patient rooms and the recovery process. Healthcare buildings, which are in constant use, have high energy demands. The U.S. Energy Information Administration [2] and Burpee [3] state that healthcare facilities account for 10.3% of the total energy consumption of commercial buildings.
Insufficient daylight levels indoors due to planning during the design process increases the use of artificial lighting, leading to greenhouse gas emissions [4]. These data show that a healthcare building has a significant impact on its carbon footprint and energy costs. Due to the climate crisis, increases in air temperatures and hours of sunshine will affect energy consumption and user comfort [5]. As the hours of sunshine increase, visual discomfort in indoor spaces will also increase [6]. In particular, the lack of sufficient natural light in patient rooms significantly increases the need for artificial lighting and has a negative impact on visual comfort [7]. Since indoor daylight performance affects not only energy use but also constitutes a fundamental aspect of the 'healing environment' paradigm, it is recognised as a core performance criterion in health-oriented assessment frameworks such as the WELL Building Standard [8]. The assessment of natural light in patient rooms, which influences both physical and psychological recovery, is a critical design challenge that must be addressed in terms of both quantity and quality. Previous studies have shown that the performance of indoor daylight positively influences patients’ recovery times and improves their psychological well-being by reducing stress levels [1,9]. Unlike similar studies, this work has developed a computational optimisation that combines spatial Daylight Autonomy (sDA) and Annual Sunlight Exposure (ASE) metrics to increase daylight performance in patient rooms using future climate projections. However, in this study, the performance assessment is limited to the sDA and ASE metrics, which address both daylight performance and the risk of excessive solar gain. Although metrics such as UDI and DA are widely used in the literature, they cannot directly represent the risks of glare and excessive solar exposure when not evaluated in conjunction with ASE. The study opted for sDA because it represents the proportion of areas demonstrating adequate daylight performance throughout the year and is one of the key performance indicators recommended in the LEED v4 [10] and Illuminating Engineering Society LM-83 [11] standards. Table 1 shows that existing studies mainly use current climate data. Both [12], which optimised geometry and shading for a healthcare building in 2022, and [13], which adjusted design parameters by façade orientation in 2025, overlooked longer sunshine duration from the climate crisis. This study aims to fill this gap and highlight the value of future climate scenarios in design.
Table 1
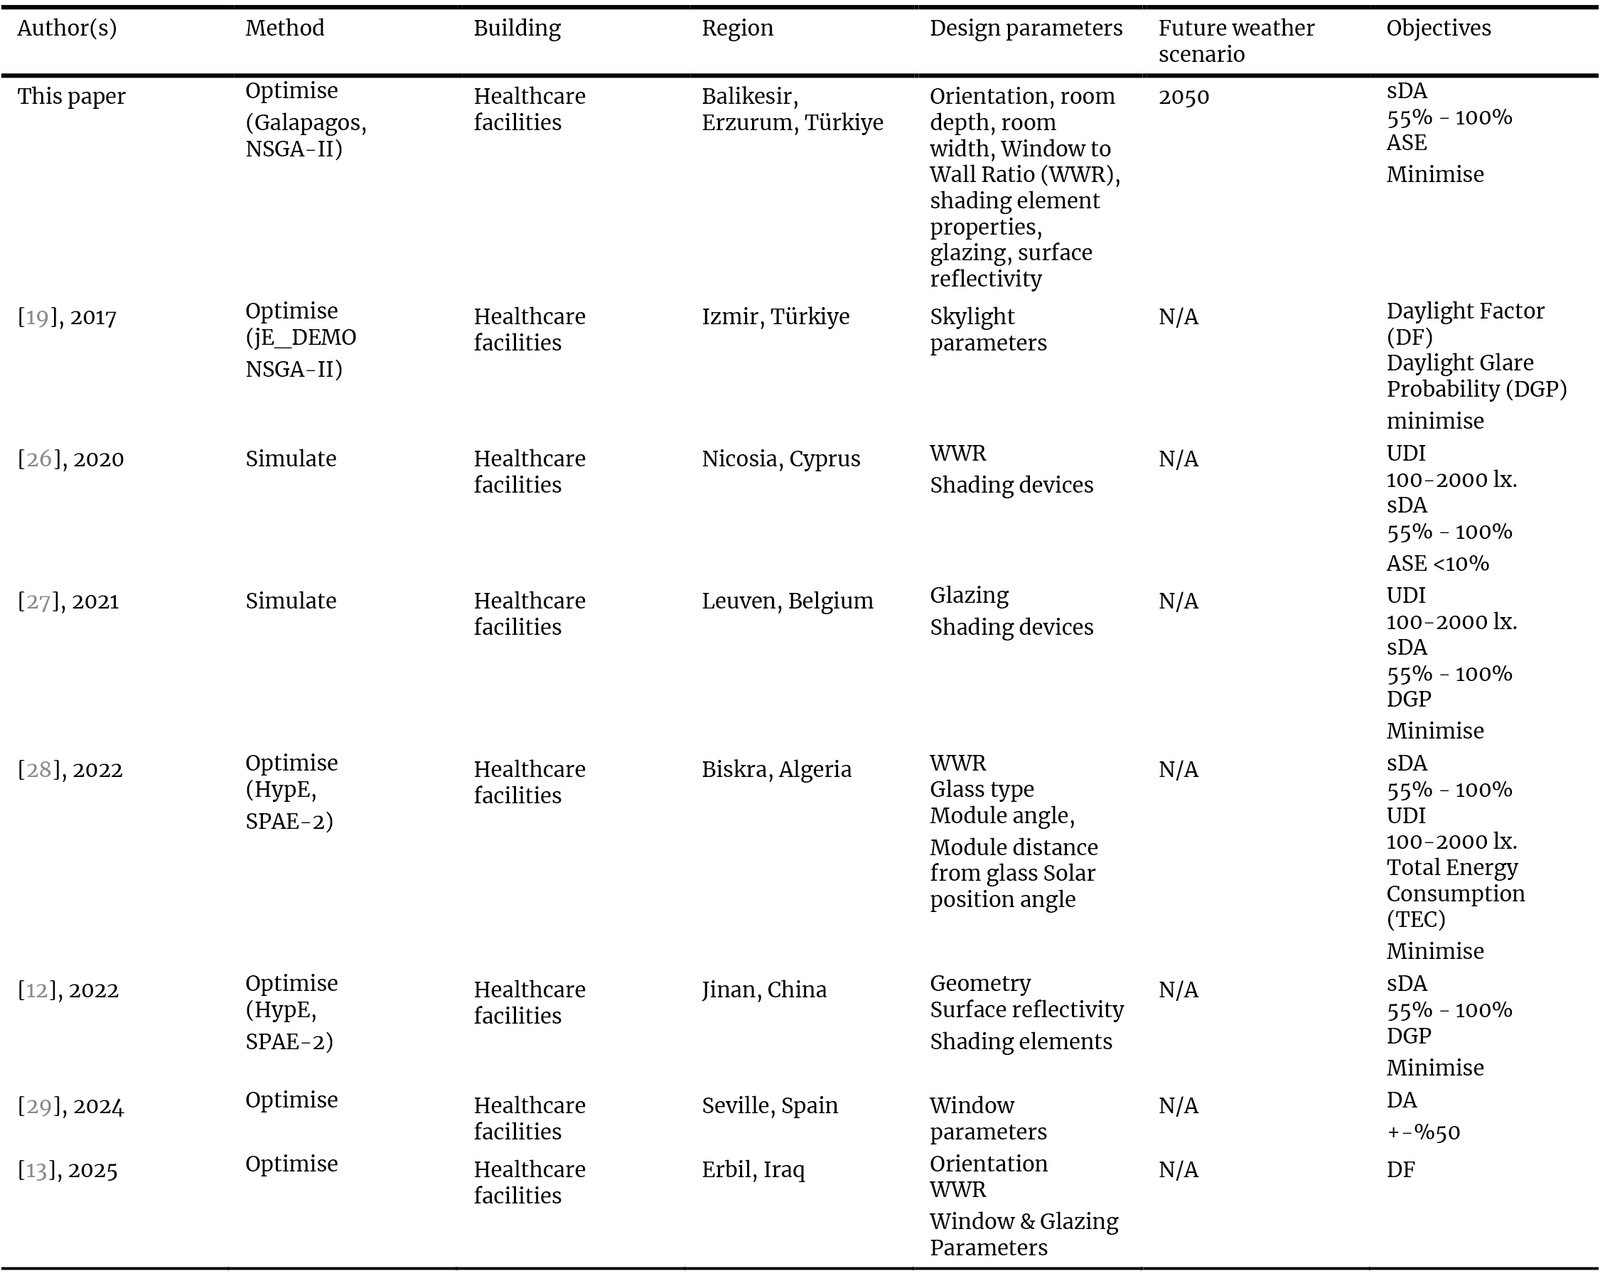
Table 1. Overview of previous works.
Studies examining patient rooms in the literature indicate that providing thermal comfort and sufficient daylight in these spaces has positive effects on patients' recovery [14,15]. Knoop's study shows that daylight contributes to the healing process not only by providing visual comfort but also through its melanopic effect [16]. Furthermore, a survey conducted by Salaheldin et al. in healthcare facilities found that well-designed spaces have a significant impact on user satisfaction [17]. In cases where daylight is insufficient in in-patient rooms, sleep disturbances, stress, and irregularities in the melatonin hormone can occur [18].
Environmental conditions in patient rooms affect patient health and the total energy consumption and carbon emissions of healthcare facilities. Therefore, patient rooms should be designed with climate-conscious approaches within the scope of sustainability goals. A 2017 study on the entrance areas of healthcare buildings in Izmir used an optimisation method to improve the indoor comfort conditions of skylights in such buildings [19]. Cesari et al. aimed to investigate the effect of a high WWR ratio on daylight use and energy performance in the interiors of patient rooms across 3 regions with cold, temperate, and hot climates. The results show that increasing the WWR ratio reduces the amount of energy required for lighting, while cooling loads may increase due to the non-use of glass with suitable thermal properties [20].
Khelil et al. aimed to design a patient room that achieves optimal daylight and energy performance through a responsive facade system in regions with hot climates in Algeria. The use of a responsive facade increased DA and UDI values by 25–50% while significantly reducing glare risk and cooling load [21]. Willekens, on the other hand, addressed the planning of entrances, health centres, and typical patient rooms in healthcare buildings with respect to daylight access, orientation, and acoustic comfort. The results of the study show that the user's stress level is significantly reduced in healthcare building spaces that efficiently utilise daylight and have high visual comfort [22]. Latha et al. aimed to systematically investigate the relationship between spatial arrangement and building energy performance in residential, office, educational, and healthcare buildings. The results highlight that the design of spatial organisation directly affects daylight access to the interior [23]. Therefore, the holistic design of the plan and facade is important in optimising indoor comfort conditions. In addition to the orientation, WWR, and orientation parameters determined during the design phase of healthcare buildings, studies in the literature investigate the effects of surface materials on user satisfaction. In 2022, Ismael’s study examined the effect of floor/wall/ceiling covering materials in patient rooms, waiting areas, and outpatient clinics on indoor air quality, acoustics, and visual performance.
The studies showed that the use of low-Volatile Organic Component (VOC)-emitting materials increased user comfort and that the sustainability of indoor surface materials improved energy performance and user satisfaction [24]. The results of Oduntan et al.’s study also support this study [25]. Table 1 compares this study with studies in the literature that optimise healthcare buildings.
In recent years, studies on daylight optimisation for healthcare buildings have increased. However, these studies generally focus on daylight performance metrics while neglecting visual comfort metrics. Although this study examines the ASE metric with a view to balancing visual comfort, its limitation lies in the fact that it does not analyse Daylight Glare Probability (DGP). Although studies in the literature focus on facade design, floor depth or daylight performance, there are relatively few studies that address facade orientation, floor depth, facade parameters and interior surface properties within a comprehensive optimisation framework. Furthermore, although environmental changes caused by the climate crisis directly affect the energy performance of healthcare facilities and patient recovery processes, research linking future climate projections to design parameters is limited. This study aims to address this gap in the literature by developing an artificial neural network (ANN)-based computational framework sensitive to future climate projections. The computational optimisation approach in this study simultaneously models the non-linear relationships between façade design, plan parameters, interior surface properties, and daylight performance. Single Objective Optimisation (SOO) algorithms evaluate 1012 different design alternatives separately. The study also aims to demonstrate the generalisability of computational optimisation by comparing the effect of climate type on patient room design parameters using the examples of Balikesir (CSA) and Erzurum (DFB), which are located at the same latitude but have different climate types.
The study distinguishes itself by offering an innovative decision-support mechanism to determine optimal daylight performance across different climate projections, unlike the single-scenario analyses commonly used in the design process of healthcare facilities. Furthermore, the study utilised evolutionary algorithms, namely Galapagos and NSGA-II, in the optimisation process and documented the results. By comparing the performance of these algorithms, the study also evaluates climate sensitivity at the algorithmic level. Consequently, the study presents a daylight-focused and climate-sensitive optimisation framework for the early design stage of patient rooms.
2. Material and method
The study aimed to obtain a patient room design that exhibits optimal visual performance in future climate projections for warm (CSA) and cold (DFB) climate types between 39-45°N latitude using computational optimisation as shown in Fig. 1. Figure 1 illustrates the seven-step computational optimisation method.
Figure 1
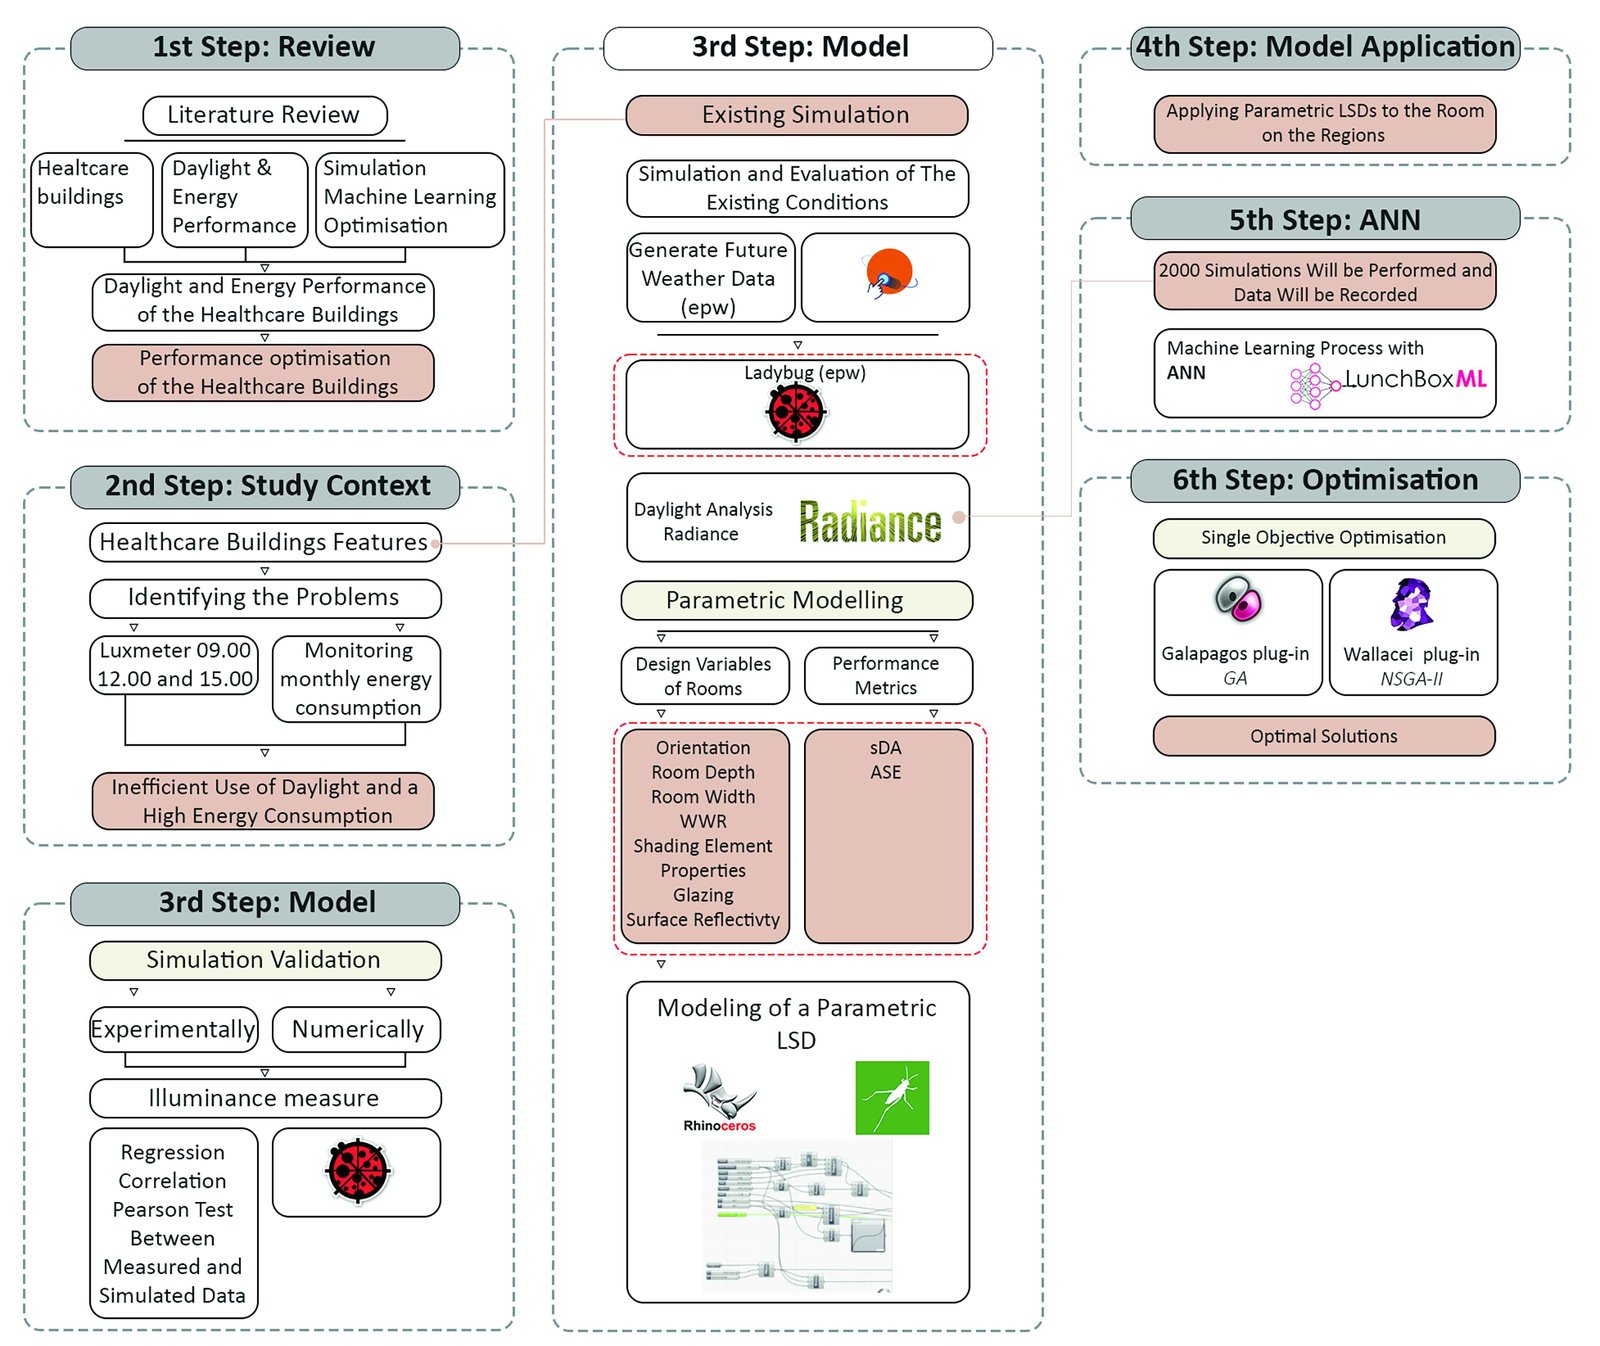
Fig. 1. PRISMA-based flow diagram illustrating the selection process for the literature review.
2.1. Climate conditions and patient room
The Mediterranean (CSA) and continental (DFB) climate types in the Köppen-Geiger climate classification exhibit different climatic characteristics. However, it is not the region’s temperature but rather sky conditions, solar radiation and annual daylight availability that influence indoor daylight performance [30]. The Meteonorm v8 programme has generated diffuse and global radiation graphs for the current conditions and 2050 climate projections under the Representative Concentration Pathway 4.5 (RCP4.5) scenario, using Typical Meteorological Year (TMY) climate data for Balikesir and Erzurum (Fig. 2). The reason for selecting the RCP4.5 scenario, which represents a medium-level emissions pathway, is that it aligns with Türkiye’s per capita CO₂ emissions levels. Türkiye’s per capita CO₂ emissions make RCP4.5 a reasonable and realistic basis for future climate projections. The study opted for the Perez All-Weather Sky Model, which generates a dynamic sky distribution from hourly global and diffuse radiation data and is frequently used in Radiance-based simulations [31].
Figure 2
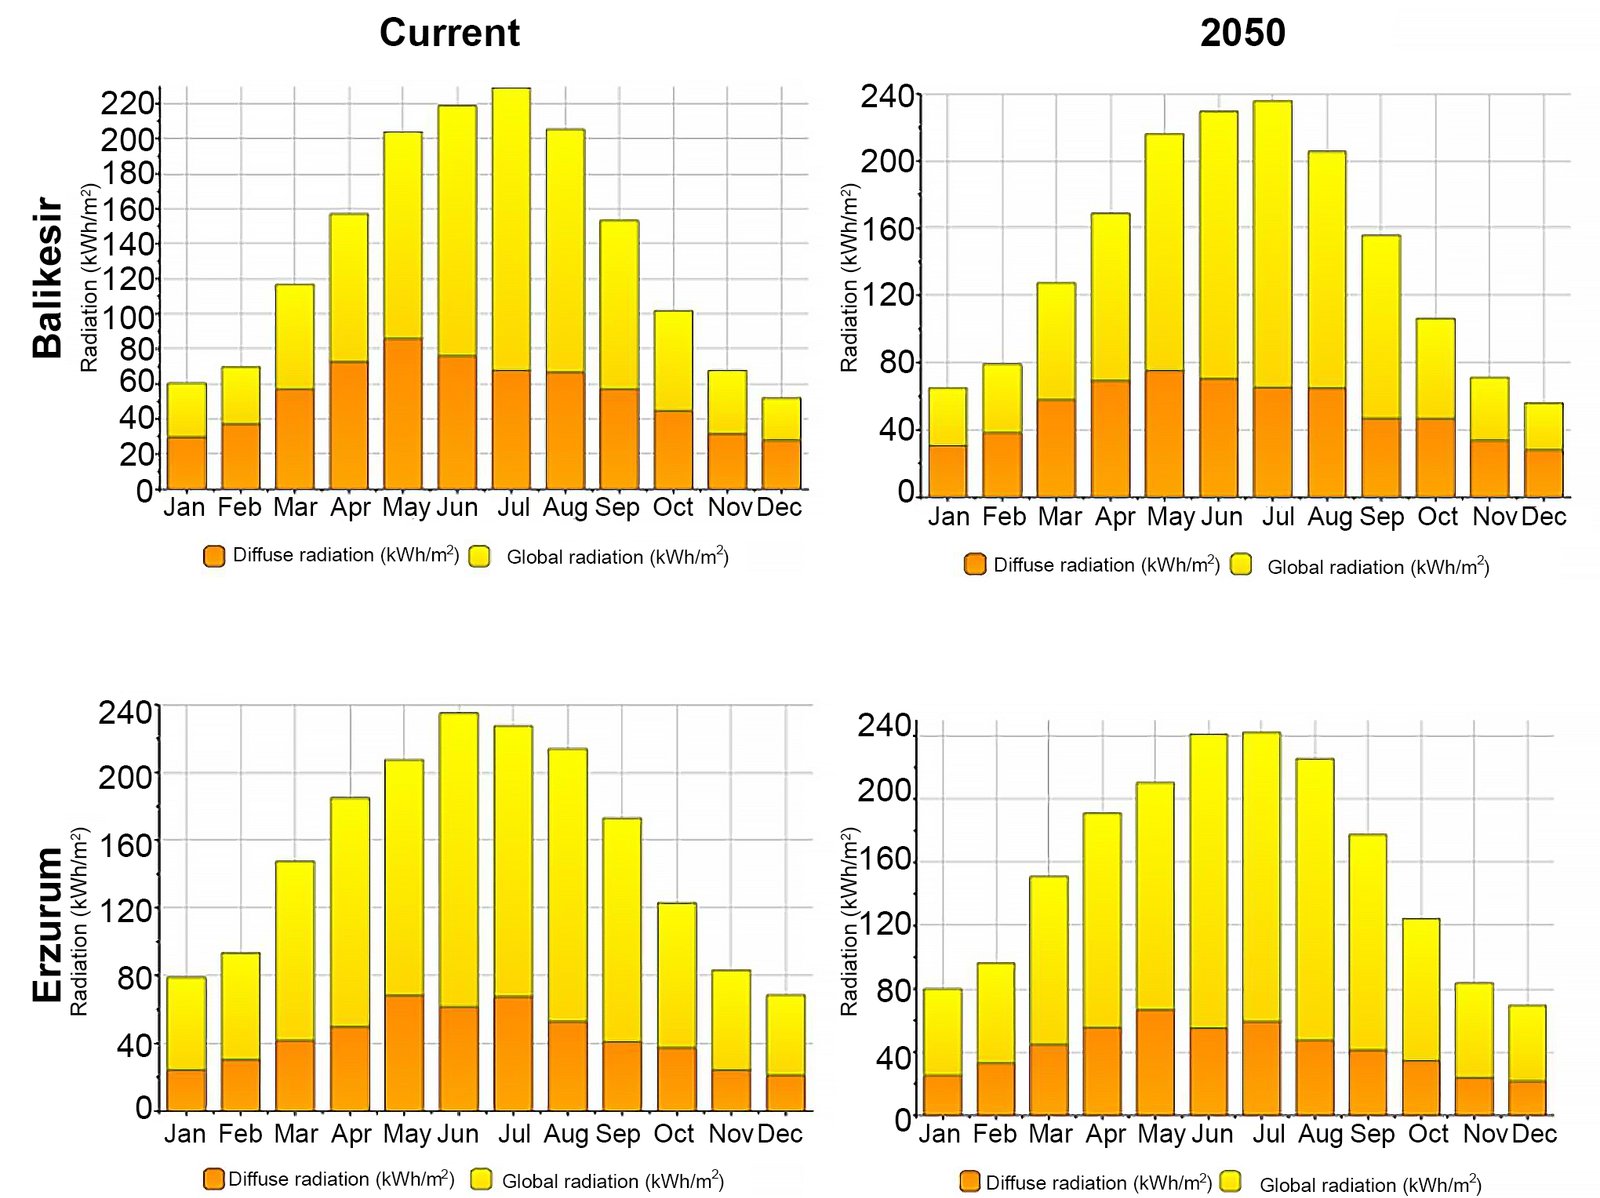
Fig. 2. Diffuse and global radiaton of Balikesir and Erzurum.
The study generated climate projections for the regions for the year 2050 using this sky model. Diffuse radiation refers to sunlight scattered by the atmosphere, while global radiation is the total of both direct sunlight and diffuse sunlight. The figure shows that diffuse radiation is higher in Balikesir, where the Mediterranean climate prevails, while global radiation is higher in Erzurum. Furthermore, due to the effects of the climate crisis, both diffuse and solar radiation values have increased in both regions by 2050.
The patient room used for model validation is located at Balikesir University Faculty of Medicine Hospital in Balikesir (39o 40' N, 26o 28' E). The south-facing room is 3.75 m wide and 8.10 m deep (Fig. 3). The climate data used by Ladybug in its daylight analyses are derived from EPW weather files defined for the relevant cities; these files contain data on sky conditions and solar radiation components. The algorithms performed the optimisations independently of this patient room. The study excludes the effects of urban shading caused by surrounding structures. This approach aims to assess the impact of building design parameters on indoor daylight performance in a controlled environment.
Figure 3
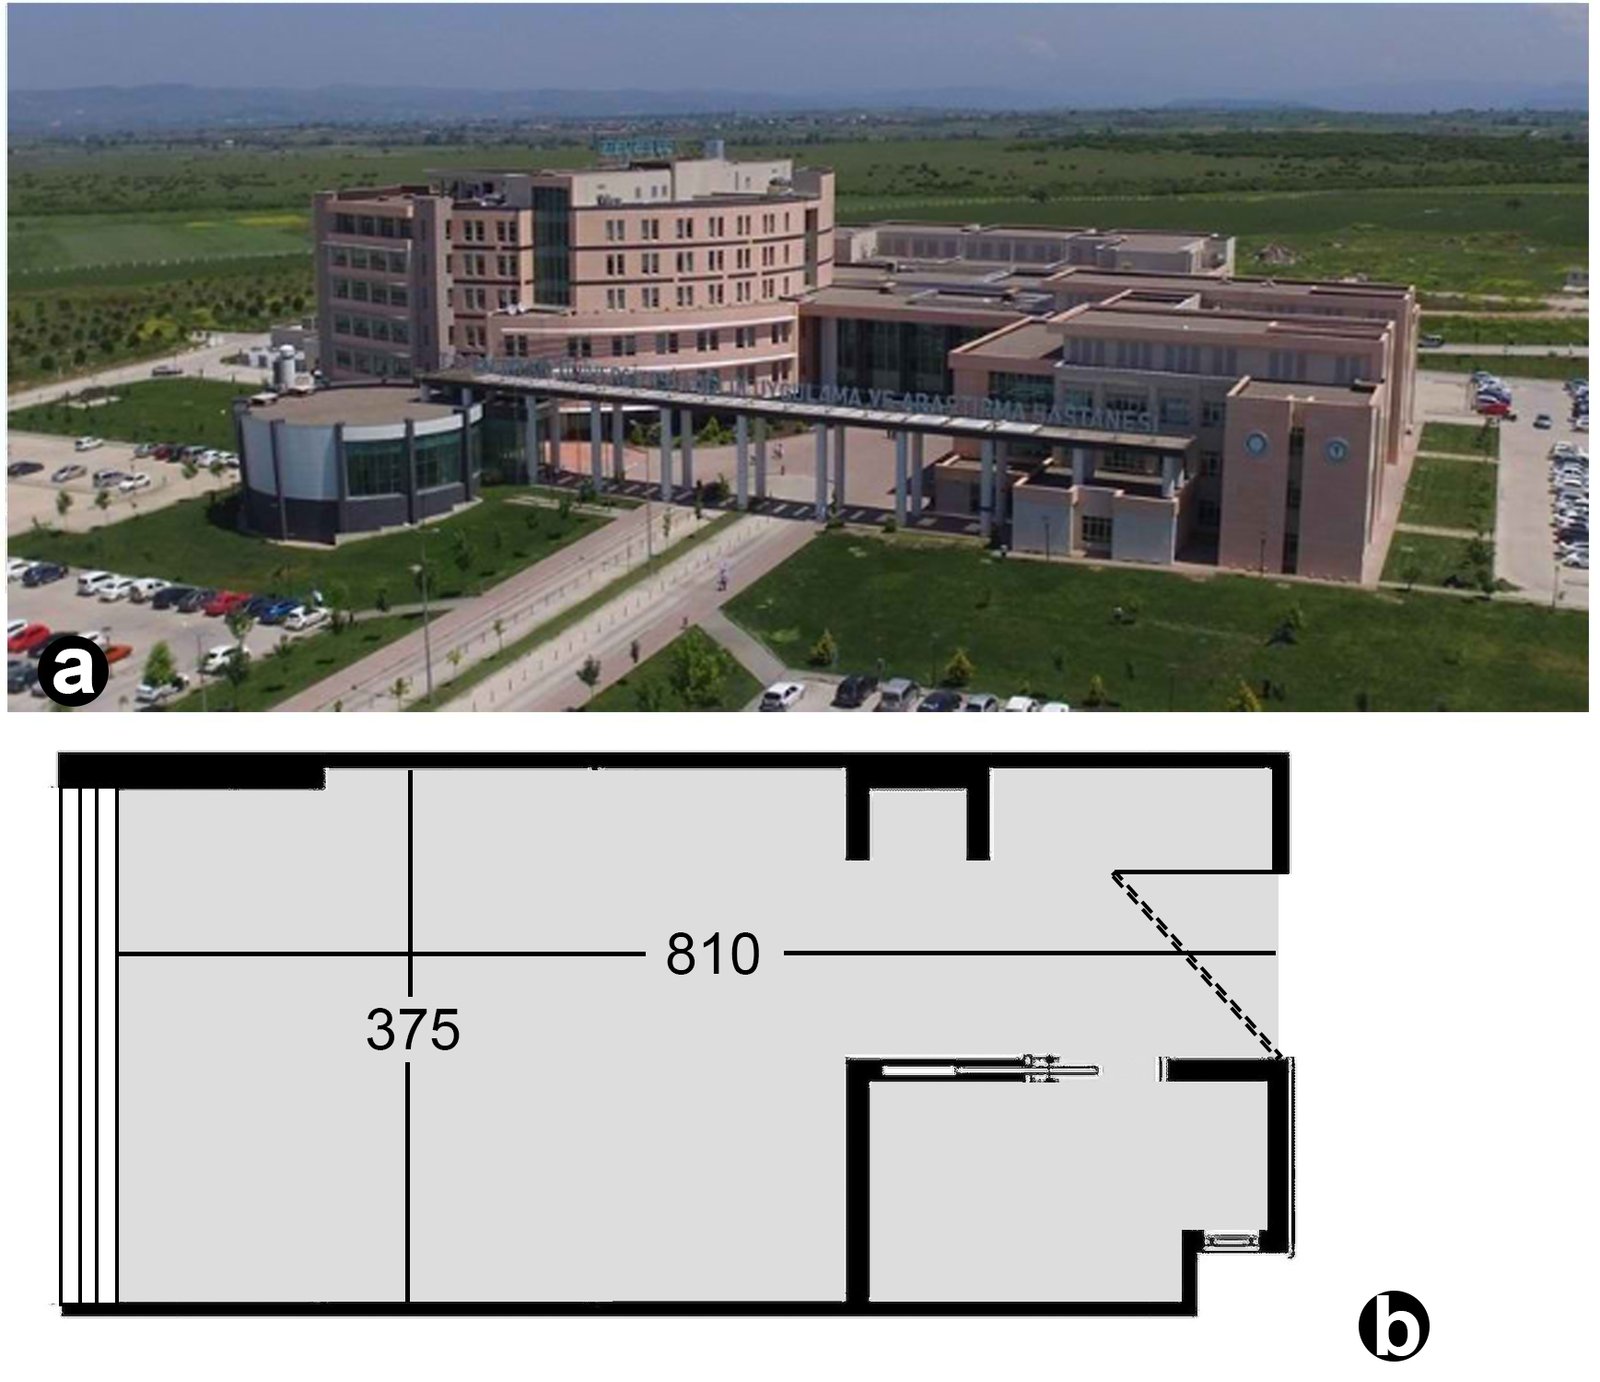
Fig. 3. (a) South facade of the Health Facility, (b) plan of the patient room.
2.2. On-site measurements and daylight model
Cem DT-1309 lux meter conducted horizontal daylight illumination measurements at reference points 85 cm above the floor at 09:30, 12:30, and 15:30 on 21 December 2025. A standard working plane is required for illuminance measurements. The height of this working plane above the floor is between 0.80 and 0.85 m [32,33]. The reference grid consists of 16 reference points, spaced 94 cm apart in the x-direction and 108 cm apart in the y-direction, and is 94 cm from the side walls (Fig. 4). The grid-based measurement approach recommended in the literature involves positioning the grids at a specific distance from the walls in order to minimise potential deviations in illuminance measurements near the walls and to represent the spatial distribution of daylight [32,34]. The 16-point reference grid in the study defines the physical measurements for model calibration. The number of measurement points was kept limited, taking into account site conditions, the measurement duration and equipment constraints. However, the simulation model used 0.6 m × 0.6 m grids to represent indoor daylight distribution more accurately. Consequently, the low-resolution measurement grid on which the field study is based serves as a calibration tool to test the model’s alignment with real-world conditions.
Figure 4
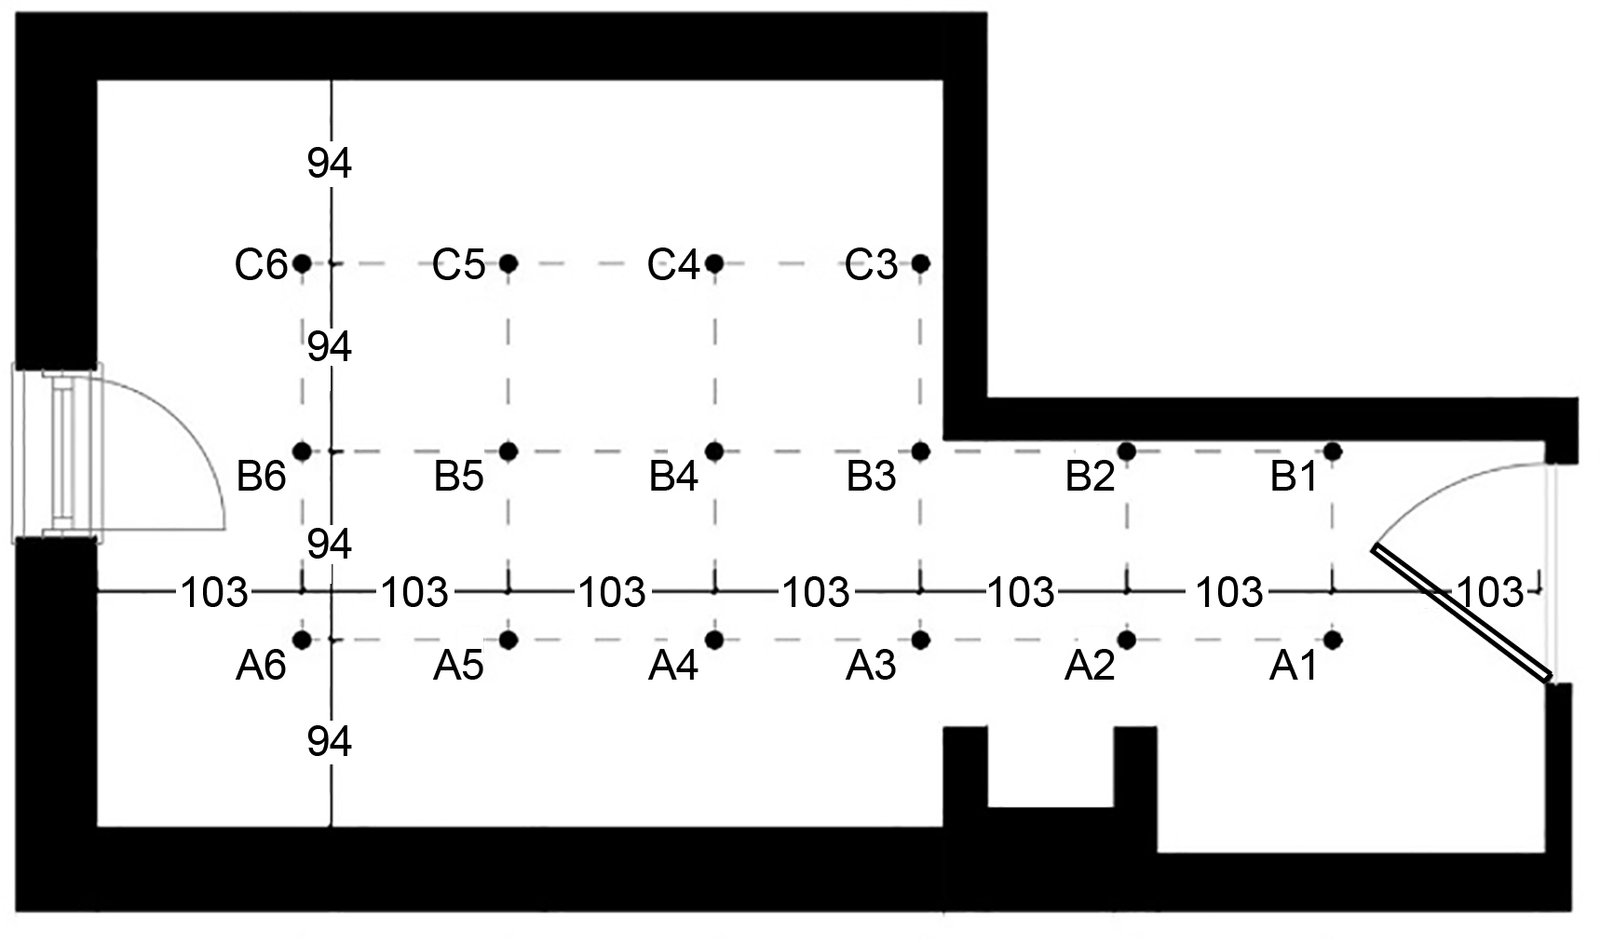
Fig. 4. Grid points.
Ladybug performs daylight simulations using the Radiance engine [35]. The study considered the sDA and ASE dynamic daylight metrics generated by the daylight simulation.
In 2012, Illuminating Engineering Society (IES) developed the sDA metric, which indicates the ratio of the total area that achieves a target illuminance level of 300 lx during hours of use to the total area. ASE requires that an illuminance of 1000 lx be provided for more than 250 hours during annual operating hours. Furthermore, ASE states that this value, when present in more than 10% of the usage area, causes visual discomfort [36]. Simulation results showed that the room's sDA value was 48% and did not meet the WELL Standard's [8] minimum requirement of 20%. The study used the sDA and ASE metrics to assess the daylight performance of the patient room, whilst excluding other daylight metrics from the scope of the analysis.
Simulation results obtained from Ladybug, using Balikesir’s current climate data for model validation, were compared with actual illuminance measurements taken on 21 December. The date of 21 December represents the lowest solar altitude and the most critical daylight conditions of the year in the Northern Hemisphere [37]. The aim of conducting validation on this date was to test the model’s behaviour under the most challenging sky conditions and to demonstrate its performance under such conditions. Furthermore, the validation process carried out in this study is not intended to directly verify annual performance metrics (sDA and ASE), but rather to test the geometric, optical, and computational accuracy of the simulation model. The study’s annual daylight performance analyses are based on dynamic simulations using TMY-based climate data. In this widely used approach, field measurements serve as validation for climate-based simulations [38].
EPW datasets represent annual-average (TMY) data derived from statistical processing of meteorological data recorded over many years [39]. For this reason, they may not accurately reflect the atmospheric conditions prevailing on the day the illuminance measurements were taken. The study modelled the region’s sky conditions using EPW-based standard definitions, and comparisons with field measurements were used to assess the geometric and computational accuracy of the simulation model. This constitutes a limitation of the study.
However, to enhance the model's reliability, a two-stage validation approach has been adopted. The first stage involves comparing Ladybug results with field data, whilst the second stage involves comparing Ladybug data with daylight simulation results generated using DesignBuilder. Figure 5 compares the Ladybug results with the average of the illuminance measurements taken at 9:30, 12:30 and 15:30 on 21 December. In this context, the study applied the Pearson test, a correlation coefficient that measures the coefficient of determination (R²), which explains the relationship between the independent variable and simulation and real-world data, and linear correlation [40]. The statistical analyses revealed that the model is reliable (R² = 97%). Furthermore, to enhance the reliability of the study, the Mean Biased Error (MBE) (1) and Root Mean Square Error (RMSE) (2) values are calculated using the following equation.
where mi is the measured value, si is the simulated value, Np is the number of data points in the ‘p’ range, and mp' is the the average of the actual measured values. According to ASHRAE standards, for the model to be considered reliable, the hourly values must satisfy the conditions MBE < 15 and CV RMSE < 30 [41]. The model has an MBE of 7% and a CV RMSE of 4%, and is therefore reliable. Figure 6 compares the illuminance simulation results obtained by DesignBuilder and Ladybug, expressed in lux.
Figure 5
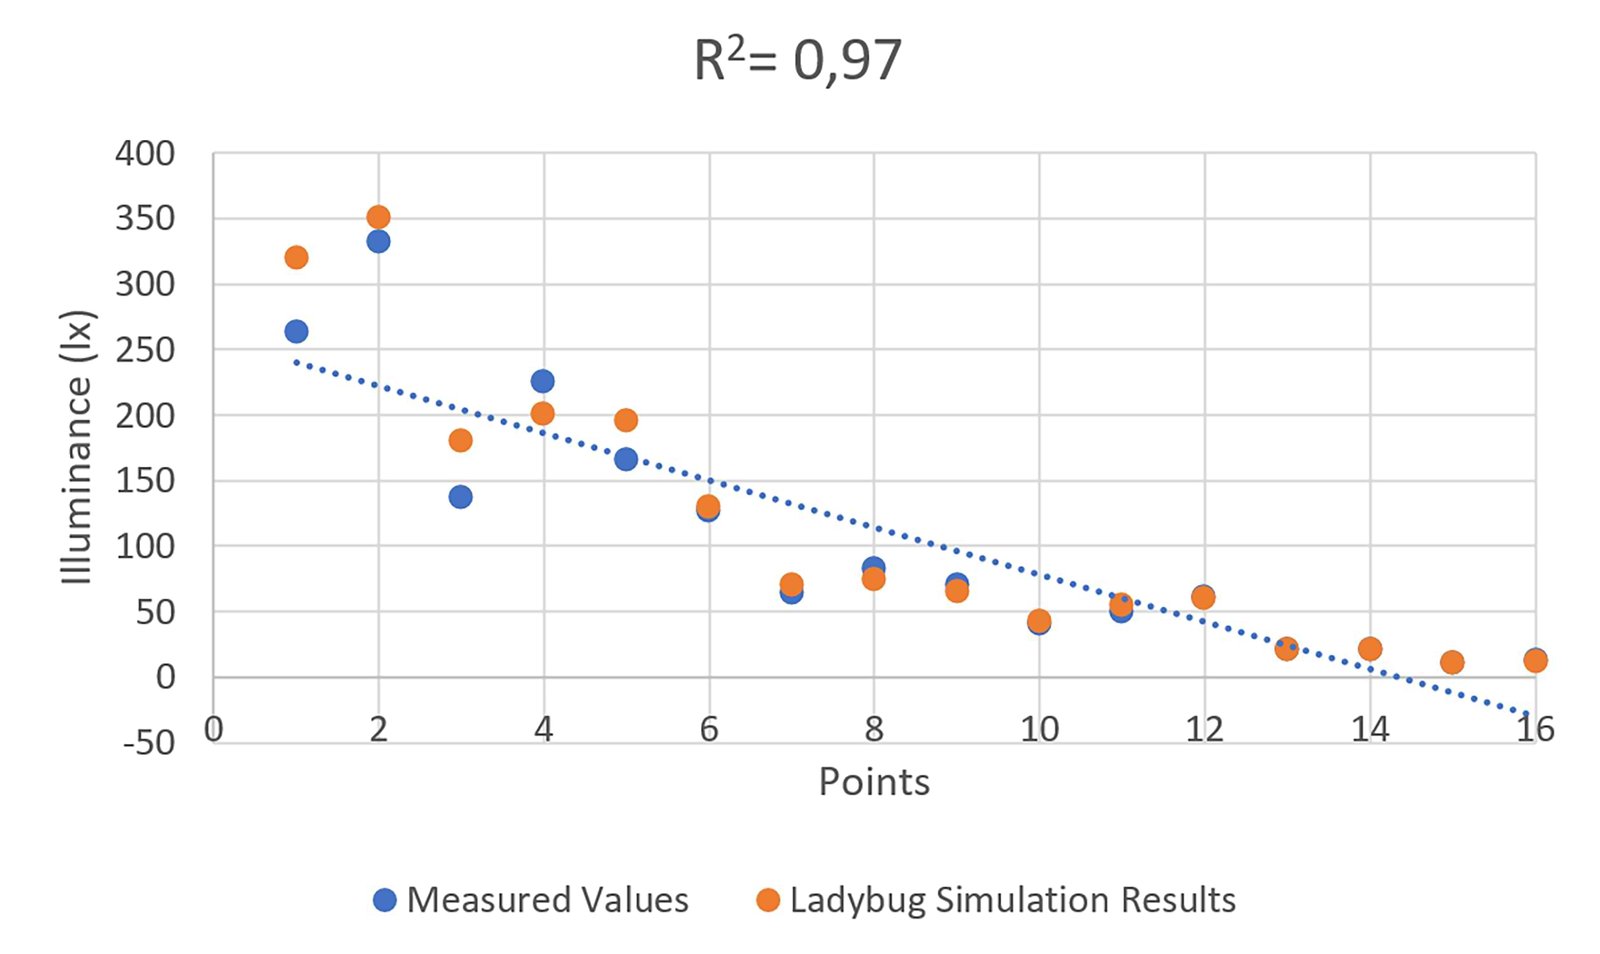
Fig. 5. Distribution of measured and simulated illuminance.
Figure 6
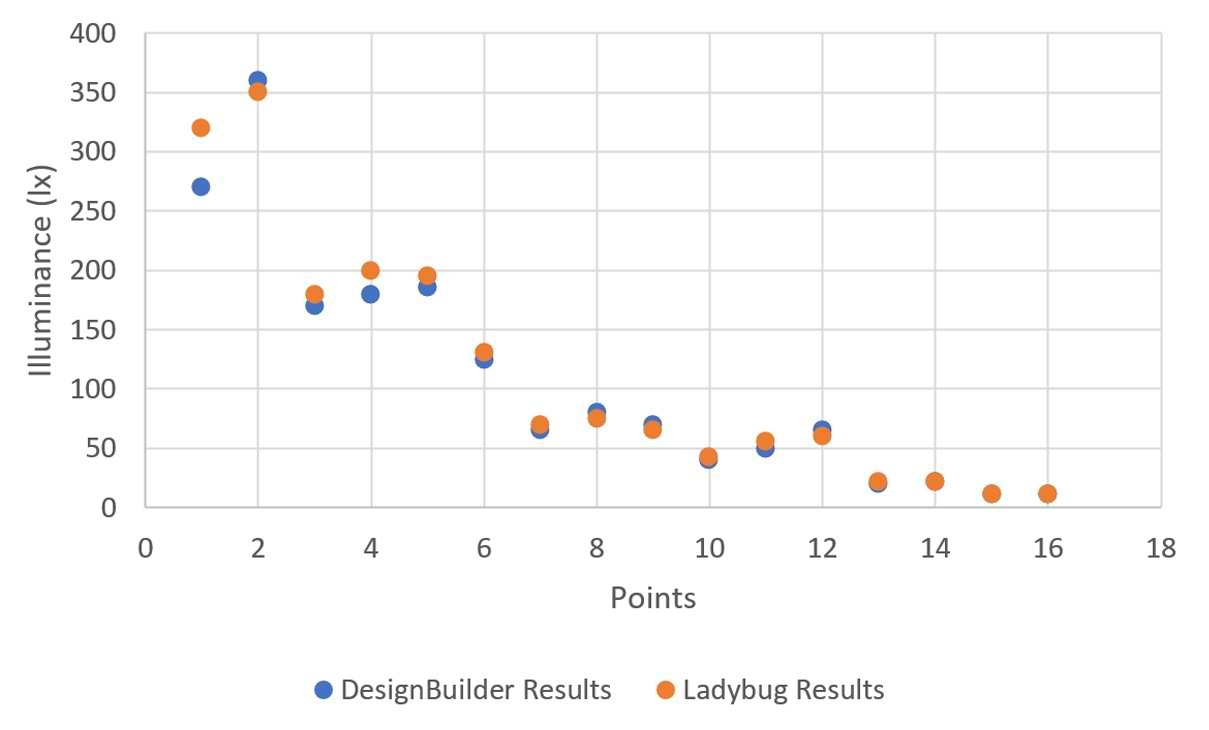
Fig. 6. Distribution of DesignBuilder and Ladybug results.
2.3. Artificial neural network based optimisation
Optimisation Tool; Lunchbox performs predictions on simulation data obtained from 2000 simulations using ANN-based ML methods with Grasshopper's Design Space Exploration (DSE) plug-in. The computational framework utilises the ANN surrogate model in the optimisation process. The optimisation process was carried out using Galapagos' Genetic Algorithm (GA) and Wallacei's NSGA-II. The study defines the problem formulation as in Equation 1, taking SOO into account.
where k>0 is the number of integer objective functions, and S is the search space.
Variables and objectives; The study used the Meteonorm programme to generate future weather projections (2050 year) for Balikesir and Erzurum based on the RCP4.5 greenhouse gas emission scenario in regions dominated by the CSA and DFB climate types at 39° north latitude. ANN-based optimisation balanced the patient room design parameters, maximising sDA and minimising ASE (Table 2). The optimisation target was for sDA to be greater than 55% and ASE to be less than 10% [42]. The study primarily aimed to improve indoor daylight performance. For this reason, the effects of WWR on thermal performance were not defined as a direct optimisation objective. However, the optimisation process controls increases in thermal load by indirectly limiting excessive solar gains using the ASE [34].
Table 2
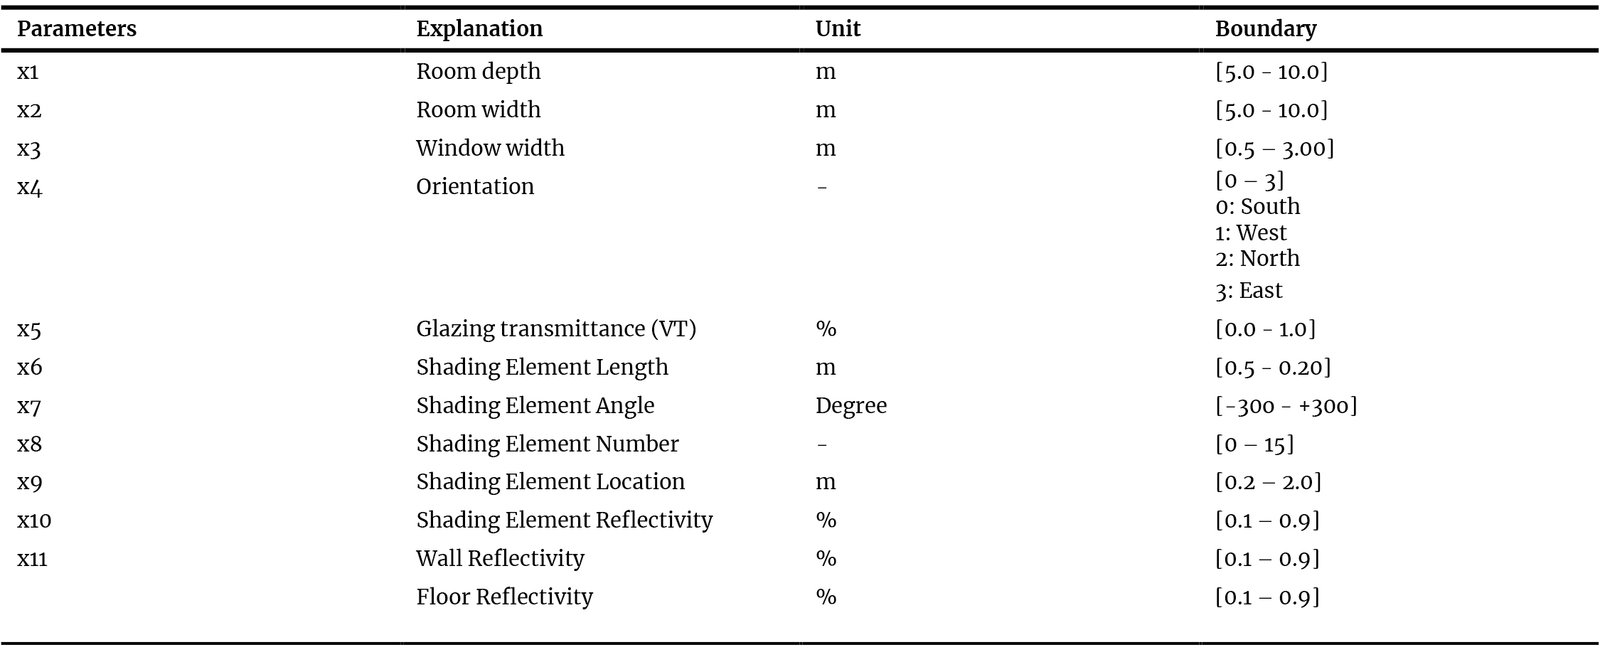
Table 2. Decision variables.
This study determined the design parameters for patient rooms by reviewing studies conducted in the literature (Table 1). The study considered the limit values in patient room standards for room size parameters and determined configurations that would not prevent daylight penetration into the interior for shading elements parameters. The optimisation process did not treat WWR as a parameter, but instead addressed the window width parameter, which is directly related to WWR. This approach enabled the process to indirectly control the aspect ratio.
In Table 2, the ‘glazing transmittance’ defined by x5 represents the visible transmittance (VT) of the glass. This parameter directly affects indoor lighting levels [34]. The algorithms balance wall and floor reflectance using surface reflectance parameters. The optimisation process did not treat ceiling reflectance as a direct parameter. The reason is that, in most daylight simulations, ceiling reflectance is generally assumed to be a high, fixed value [32, 33]. Furthermore, this approach aimed to reduce model complexity. The computational framework initially defined surface reflectivity values in the design domain as lying between 0 and 1. However, these values represent theoretical limits and cannot be achieved in practice. A filtering process was applied to the study's results to achieve physical realism. Solutions with reflectivity values above 0.9 were excluded from the analysis. This upper limit is based on the reported limits for architectural surface reflectivity [43]. Figure 7 shows the visualisation of the parameters.
The optimisation process considered a maximum of 1,000 function evaluations (FES) and terminated when the termination criteria were met. The optimisation process utilised the GA of the Galapagos plug-in and the NSGA-II of the Wallacei plug-in separately. GA is an algorithm frequently used in architectural problems in the literature [24]. NSGA-II is frequently used in MOO studies, and its effectiveness in SOO studies has been investigated. GA considered a population size of 40 and 25 generations, while NSGA-II used 1,000 iterations. The study also recorded the time it took for the algorithms to reach their optimal result. The study demonstrates limited exploration capacity for a multi-dimensional search space comprising 12 distinct design variables. The fact that GA fails to reach the optimal solution in some scenarios is attributed not so much to climatic differences as to the algorithm’s inability to sufficiently explore the search space. However, NSGA-II has produced more successful results by scanning the solution space more effectively, thanks to its more advanced structure and multi-objective optimisation compared to GA.
Figure 7
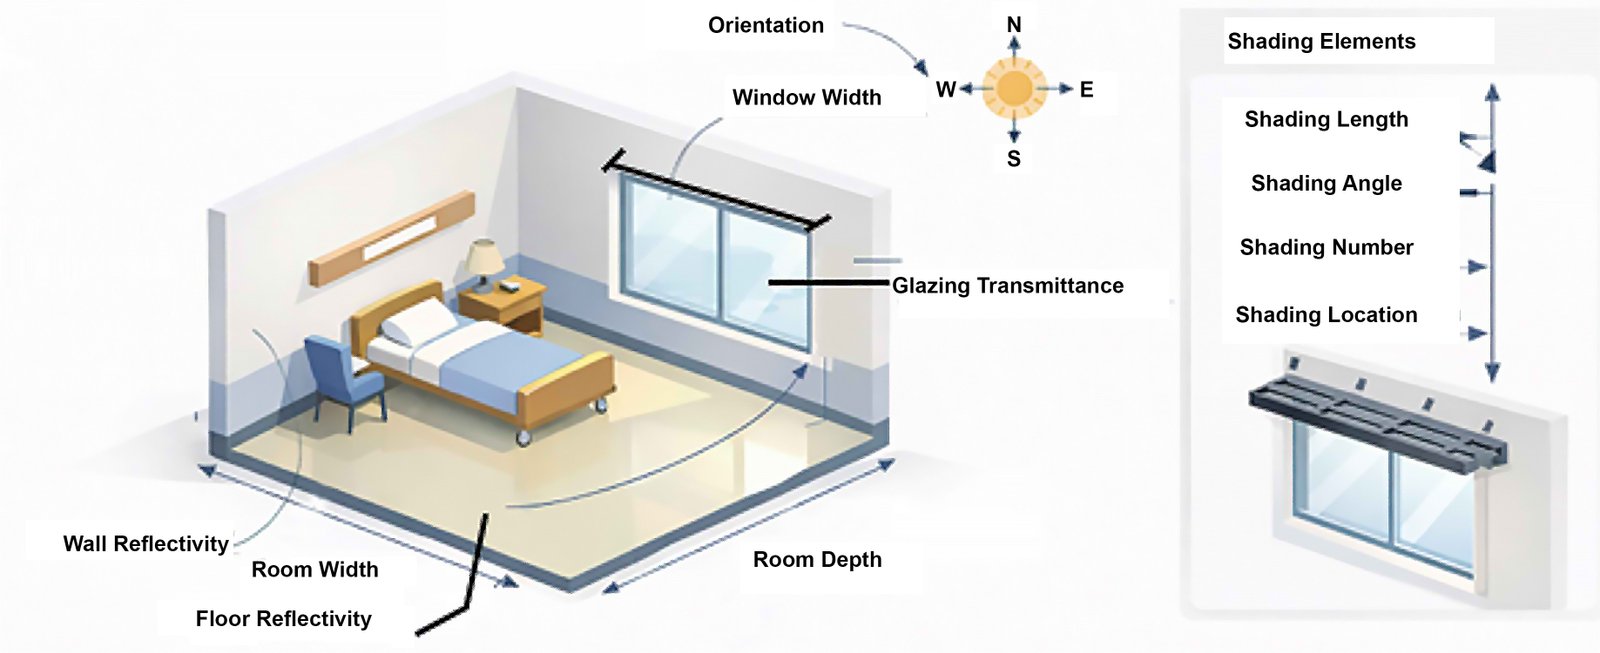
Fig. 7. Visualisation of parameters.
The study employs a GA based on the SOO approach, and a composite fitness function has been defined to evaluate multiple performance criteria. In this context, sDA has been set as the primary objective to be maximised, whilst ASE has been integrated into the model as a constraint via a penalty function. The fitness function is expressed as follows:
where λ represents the penalty coefficient, whilst ASE_thr represents the acceptable ASE threshold value (10% in this study). The optimisation process has been formulated as a single-objective problem with constraints. In the process, the constraints were defined as sDA > 55% and ASE < 10%. Furthermore, energy consumption has been disregarded in the process.
3. Results
The study manually tested the number of iterations and neurons to obtain the ANN model that produced the most accurate predictions and recorded the error rates. The number of iterations tested for two different climate regions was 500, 1000, 1500, and 2000; the number of neurons was 5, 10, 15, 20, 25, and 30. Figure 8 shows the models that provide the most accurate predictions for the sDA and ASE metrics under different climate conditions. The study selected the alternative with the lowest error rate. For the sDA metric in Balıkesir, the study used 2000 iterations and 30 neurons; for the ASE metric, it used 1500 iterations and 30 neurons.
Figure 8
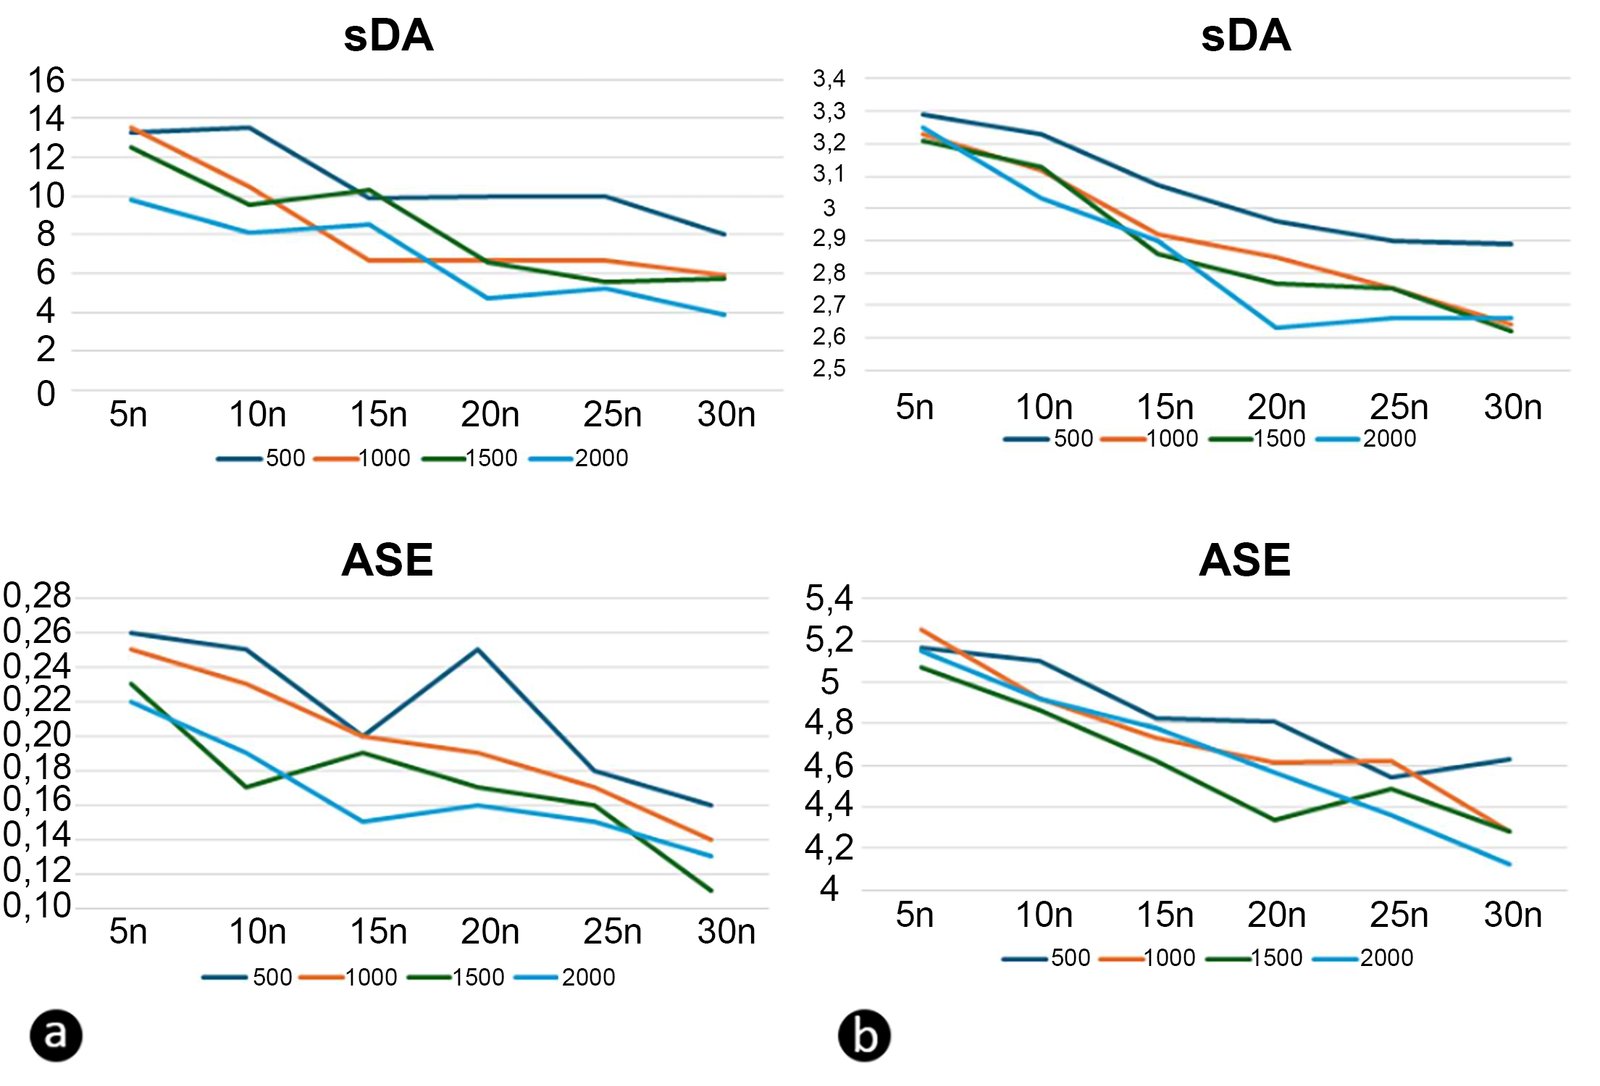
Fig. 8. ANN's sDA and ASE prediction error rates for (a) Balikesir and (b) Erzurum.
The study used 1500 iterations and 30 neurons for Erzurum’s sDA metric, and 2000 iterations and 30 neurons for the ASE metric. In this study, evolutionarily based NSGA-II and GA were used in the optimisation process. The study completed and recorded the process across 1000 iterations during optimisation. Figure 9(a) shows the optimisation process carried out by both algorithms in Balikesir. NSGA-II achieved a sDA value of 100% in the first 200 iterations, while GA achieved a value of 83.33% in the first 100 iterations. Figure 9(b) shows the optimisation process carried out by both algorithms in Erzurum. NSGA-II achieved 100% sDA in the first 200 iterations, while GA achieved 95% in the first 100 iterations.
Figure 9
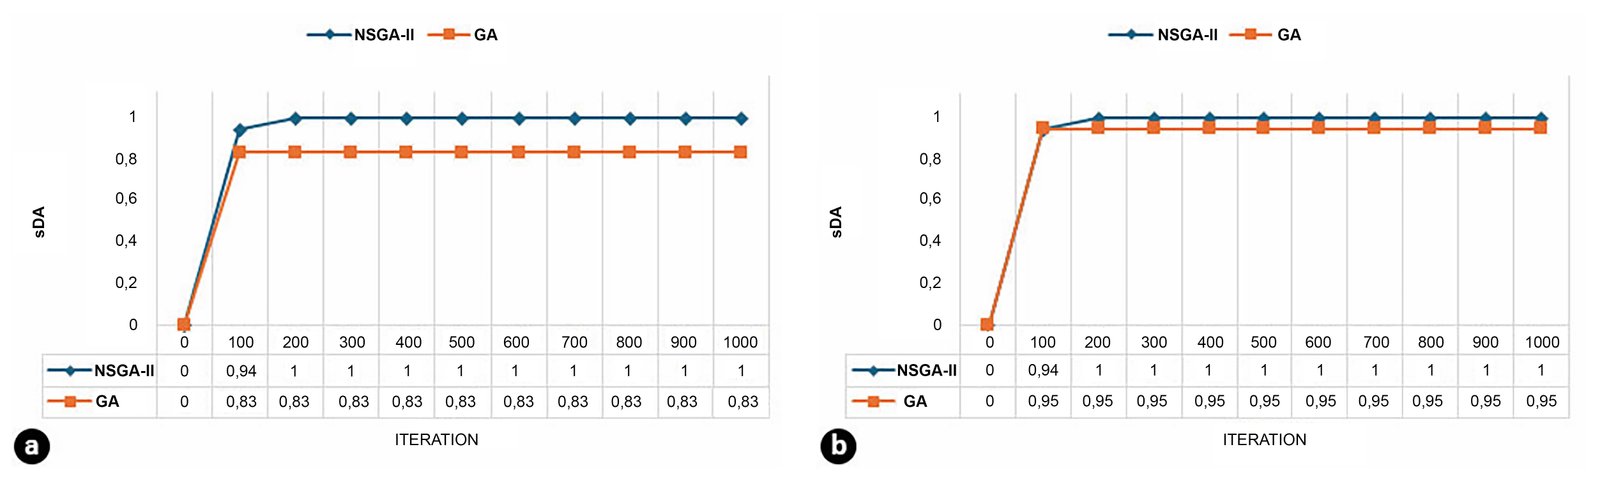
Fig. 9. (a) In Balikesir and (b) In Erzurum, the time taken by algorithms to reach the best results.
The study optimising patient room parameters in Balikesir and Erzurum demonstrates that orientation is crucial for indoor daylight performance. According to the optimisation results, in both climate zones, south-facing patient rooms achieve sDA levels of 90%, while ASE values are at the threshold of 9–10%. Table 3 shows that the parameter values of the recommendations, which have similar sDA and ASE values in south-facing patient rooms at the same latitude but in different climate zones, differ. In Balikesir, the recommendation (NSGA II and GA) that shows optimal performance has a room width of 4.6 m and a depth of 8.4 m. In Erzurum, NSGA II recommends a width of 4.5 m and a depth of 5.4 m, while GA recommends a width of 4.3 m and a depth of 5.1 m. This may be due to the lower solar load in Erzurum. In NSGA II's recommendation for Erzurum, the window width is smaller than in the Balikesir recommendations, whereas in GA's recommendation, it is larger. In Erzurum, the number of shading elements is lower in both algorithms compared to the recommendation for Balikesir. This highlights the need for greater control over solar gain in Balikesir. Surface reflectivity is higher in Balikesir in the recommended models.
Table 3
Table 3. Properties of the optimised model parameters.
There are also significant differences in the optimisation results for east-facing patient rooms in Balikesir and Erzurum. In the NSGA II optimisation, the best results for Balikesir are sDA 55%, ASE 8.33%, while the best results for Erzurum are sDA 75%, ASE 8.33%. NSGA II's proposed patient room in Balikesir is 4.1 m x 7.8 m, while its proposal for Erzurum is 3.7 m x 5.7 m. In Balikesir, the NSGA II shading element is positioned closer to the building surface, while in Erzurum, it is located 0.23 m from the façade. Furthermore, the reflectivity of the shading elements in Erzurum has been increased to enhance daylight penetration into the interior. In the optimisation process conducted by GA, the best result for Balikesir is sDA 75%, ASE 8.40%, while the best result for Erzurum is sDA 50%, ASE 50%. GA failed to achieve the targets of sDA < 55% and ASE < 10% in Erzurum. This indicates that direct solar radiation, particularly in the morning hours due to low sun angles, negatively affects visual comfort. The proposed patient room in Balikesir is 3.6 m x 7.9 m, while the proposed room in Erzurum is 3.4 m x 5.6 m. GA has positioned the shading elements away from the building surface in both regions.
Both algorithms achieved a more balanced daylight performance in their recommendations for north-facing patient room models in both cities. NSGA-II achieved sDA of 83% and ASE of 8.33% in its optimisation run in Balikesir, while its optimisation run in Erzurum resulted in sDA of 72% and ASE of 10%. GA achieved sDA of 75% and ASE of 8.40% in its patient room recommendation for Balikesir, while in Erzurum, it achieved sDA of 83% and ASE of 15%. GA did not meet the ASE<10% condition in the Erzurum proposal. The north-facing patient room proposals in Balikesir are 3.8 m x 5.4 m (NSGA-II) and 3.7 m x 5.7 m (GA). The north-facing patient room proposals have larger window openings than the other facade-facing proposals for this province. NSGA-II proposed 2 shading elements, while GA proposed 1 shading element. The NSGA-II shading element is positioned 0.32 m from the building façade, while the GA is positioned 0.28 m away. The recommendations for north-facing patient rooms in Erzurum are 4.7 m x 5.3 m (NSGA-II) and 3.4 m x 5.7 m (GA). North-facing patient rooms have larger window openings than other orientations in this city. Both algorithms recommend two shading elements. NSGA-II places the shading element 0.28 m close to the building facade, while GA places it 0.43 m away. The north orientation, which is not exposed to direct sunlight, reduces excessive daylight and glare. This shows that it offers a safer solution for patient room visual comfort. The optimisation results support the view that north-facing rooms are preferable, especially in healthcare buildings with sensitive user groups.
In west-facing scenarios, whilst the sDA values of the algorithms’ recommendations are at medium-to-high levels (55–83%) in both cities, a west-facing orientation is riskier for ASE in Balikesir. The algorithm’s recommended model for a west-facing room in Balikesir has reached an ASE value of 25% (GA). This value exceeds the 10% threshold commonly accepted in the literature and may cause high glare and visual discomfort. Therefore, the model proposed by GA is not evaluated as an ‘absolutely optimal’ solution, but rather as an output of a single-objective optimisation approach. This situation arises because GA addresses ASE only indirectly via the penalty function and fails to achieve a sufficient balance in the solution space. In contrast, the NSGA-II algorithm simultaneously optimises the sDA and ASE objectives, producing solutions that meet the ASE threshold values and are more balanced in terms of visual comfort.
In Erzurum, this value is no more than 12.50% (GA). In the evening, the sun's more horizontal angles increase the risk of excessive solar gain and glare, particularly in Balikesir, which has a warmer, more temperate climate. In Erzurum, however, visual comfort problems on the western facades remain limited due to the local climate. The dimensions of the model proposed by NSGA-II for Balikesir are 3.2 m x 9.7 m. This proposal includes 5 shading elements, each 0.32 m from the façade. The dimensions of the model proposed by GA for Balikesir are 3.7 m x 5.7 m. This proposal includes four shading elements, 0.17 m from the façade. The dimensions of the NSGA-II model proposed for Erzurum are 4.9 m x 5.8 m. This proposal includes 4 shading elements, spaced 0.28 m from the front. The dimensions of the model proposed by GA for Erzurum are 3.8 m x 6.7 m. This proposal includes 4 shading elements, spaced 0.24 m from the front.
4. Discussion
This chapter evaluates the findings of a study conducted to optimise the daylight performance of patient rooms in two regions with different front orientations in the Mediterranean and Continental climate zones at the same latitude, using future climate projections; the results of NSGA-II and GA; and future studies.
4.1. Daylight performance of proposed models
The study utilised NSGA-II and GA to obtain patient room designs with different orientations that exhibit optimal daylight performance in future climate projections for Mediterranean and Continental climate zones. Optimisation results revealed that south-facing patient rooms reached 90% of the sDA value in both climate regions, while ASE values were at the threshold level of 9–10%. However, the study found that the optimal design parameters differed between Balikesir and Erzurum, despite their being at the same latitude. The patient room recommendations for Balikesir call for a wider, deeper plan solution, while those for Erzurum call for less plan depth. Furthermore, the window widths in the recommendations for Erzurum are greater. This situation is associated with the low solar load in cold climates. Furthermore, the use of more shading elements in the models proposed for Balikesir highlights the need for more effective control of solar gain in hot climates. In east-facing patient rooms, visual comfort issues were particularly prominent in Erzurum due to low sun angles in the morning hours, while north-facing scenarios yielded more balanced daylight performance in both cities. In west-facing patient rooms, ASE values were observed to increase significantly in Balikesir, while this effect was more limited in Erzurum. The limits of the design parameters balanced by the algorithms are one of the key factors determining the solution space. This study has set the upper limit for the width of the shading elements at 0.20 m to achieve realistic solutions in terms of architectural feasibility and façade integration. However, the recommendations derived from the study may perform differently due to shading effects from buildings in urban environments. For this reason, it should be borne in mind that the idealised conditions were derived independently of the urban context.
4.2. Comparison of optimisation algorithms
The study conducted the process using the NSGA-II and GA algorithms. The results show that the NSGA-II algorithm provides more balanced and reliable solutions for both Balikesir and Erzurum. The GA algorithm failed to meet the targeted sDA and ASE criteria in some scenarios. ASE limit values were exceeded in east- and north-facing patient rooms. These findings demonstrate that algorithm selection affects design outcomes in healthcare facility design problems. The findings indicate that GA may encounter convergence issues due to the limited population size and number of generations, which may affect the quality of solutions in multi-objective optimisation problems. The study suggests that the observed performance differences are related to the algorithm’s exploration capacity rather than climatic effects.
4.3. Conclusions regarding design parameters
The algorithms' results indicate that patient room depth and orientation are critical design parameters for daylight performance. In particular, the study's findings indicate that north-facing patient rooms should have shallower floor plans. Additionally, designers should determine window sizes, the number and location of shading elements, and surface reflectivities based on climatic conditions. Some of the solutions obtained from the optimisation results have yielded a reflectivity value of 1.0. This is due to the algorithm failing to take physical constraints into account during its search for the mathematical optimum. The study has interpreted these results as theoretical upper limits and has identified materials with high reflectivity (in the range of ~0.7–0.85). Furthermore, for certain façade orientations, setting the ‘shading elements reflectivity (x10)’ parameter to high values increases the amount of daylight reflected into the interior, thereby improving sDA performance. However, this may increase the risk of glare caused by secondary reflections, particularly at low sun angles. This study has limited its visual comfort assessments to sDA and ASE metrics, excluding glare effects caused by reflections. Future studies could conduct a comprehensive visual comfort assessment by analysing the reflectivity of shading elements using the DGP metric to inform final design decisions.
5. Conclusion
This study examines the feasibility of identifying design parameters that optimise the daylight performance of patient rooms in different climate zones and with varying façade orientations and assesses the impact of algorithm selection. The hypothesis of the study is that the NSGA-II and GA algorithms will demonstrate different performance in achieving optimal sDA and ASE values for patient rooms with different orientations in Mediterranean and Continental climate zones, and that the interaction between design parameters (room depth, window width, number/position of shading elements and surface reflectance values) and the algorithm will determine daylight performance. The study demonstrates that the NSGA-II algorithm produces more balanced solutions in north-south and east-west oriented rooms, whereas the GA algorithm, due to its limited population and number of generations, is unable to meet the target sDA and ASE values in some cases.
Future studies may use MOO methods to consider additional comfort metrics, in addition to daylight performance, across different healthcare buildings. Furthermore, future studies may develop design strategies in similar climate zones at different latitudes to offer regional solutions. Another limitation of this study is that it relies solely on the sDA and ASE metrics for evaluation. Future studies could establish a more comprehensive daylight optimisation framework by incorporating different daylight metrics, such as UDI and DA, into their analyses. In addition, future studies may adopt a multi-objective optimisation approach that considers both thermal and daylight performance, bearing in mind that higher WWR values—particularly in cold-climate regions—could lead to increased heat loss. The introduction highlighted the effects of daylight’s melanopic effects on user health, as noted in previous studies. The study limited the optimisation process solely to the sDA and ASE visual metrics. This choice stems from the model’s failure to define the spectral data required for melanopic lighting assessment. Metrics such as melanopic equivalent daylight illuminance (mEDI) depend not only on illuminance levels but also on the spectral distribution of light and users’ exposure times to daylight. The inability to incorporate this multi-dimensional model into the annual climate-based daylight simulation framework used in the present study constitutes a limitation of the work. Consequently, non-visual performance criteria were not included in the optimisation process. Future studies could integrate melanopic performance indicators into the multi-objective optimisation framework alongside climate-based daylight metrics. Another limitation of the study is that the recommendations obtained are considered in isolation from the urban context. Future studies could achieve more realistic results by evaluating the proposed parametric model across different urban fabric scenarios and building layout patterns.
Funding
This study was supported by the Scientific Research Projects Support Unit of Balikesir University (Project no: 2025/180).
Author Contributions
M.S. UNLUTURK: Conceptualization, methodology, investigation, data curation, visualisation, writing, editing of the original manuscript, and funding acquisition. R. OZLUK: Methodology, and the writing, reviewing, and editing of the original manuscript. All authors have read and approved the final version of the manuscript.
Declaration of competing interest
The authors declare no conflicts of interest.
References
- R.S. Ulrich, C. Zimring, X. Zhu, J. DuBose, H.B. Seo, Y.S. Choi, et al., A review of the research literature on evidence-based healthcare design, HERD: Health Environments Research & Design Journal, 1:3 (2008) 61-125. https://doi.org/10.1177/193758670800100306
- U.S. Energy Information Administration, Commercial Buildings Energy Consumption Survey (CBECS), U.S. Department of Energy: Washington, DC, USA, 2012.
- H. Burpee, How U.S. hospitals can realize net-zero energy, REHVA European HVAC Journal, 54 (2017) 31-35.
- Illuminating Engineering Society, IES Lighting Handbook, Illuminating Engineering Society: New York, NY, USA, 1966.
- V. Masson-Delmotte, P. Zhai, A. Pirani, S.L. Connors, C. Péan, S. Berger, et al., Climate Change 2021: The Physical Science Basis, Cambridge University Press: Cambridge, U.K., 2021.
- J. Wienold, J. Christoffersen, Evaluation methods and development of a new glare prediction model for daylight environments with the use of CCD cameras, Energy and Buildings, 38:7 (2006) 743-757. https://doi.org/10.1016/j.enbuild.2006.03.017
- U.S. Department of Energy, Best Practices Guide for Energy-Efficient Data Center Design, U.S. DOE, 2012.
- WELL Building Standard, Daylight Modeling, 2024.
- M.G. Figueiro, M.S. Rea, Office lighting and personal light exposures in two seasons: Impact on sleep and mood, Lighting Research & Technology, 48:3 (2016) 352-364. https://doi.org/10.1177/1477153514564098
- U.S. Green Building Council, LEED v4.1 for Building Design and Construction, USGBC, 2019.
- Illuminating Engineering Society, IES LM-83-12: Approved Method for Spatial Daylight Autonomy (sDA) and Annual Sunlight Exposure (ASE), IES: New York, USA, 2012.
- Y. Xue, W. Liu, A study on parametric design method for optimization of daylight in commercial building's atrium in cold regions, Sustainability, 14:13 (2022) 7667. https://doi.org/10.3390/su14137667
- L.A. Ali, F.D. Miran, F.A. Mustafa, Fenestration design model for daylight optimisation in patient rooms in Erbil City, Architecture, (2025). https://doi.org/10.3390/architecture5040110
- A. Shajahan, C.H. Culp, B. Williamson, Effects of indoor environmental parameters related to building HVAC systems on patients' medical outcomes: A review of scientific research on hospital buildings, Indoor Air, 29 (2019) 161-176. https://doi.org/10.1111/ina.12531
- H.A. Husein, S.S. Salim, Impacts of daylight on improving healing quality in patient rooms: Case of Shorsh Hospital in Sulaimani City, International Transaction Journal of Engineering, Management, & Applied Sciences & Technologies, 11:11 (2020) 1-10.
- M. Knoop, O. Stefani, B. Bueno, B. Matusiak, R. Hobday, A. Wirz-Justice, B. Norton, Daylight: What makes the difference?, Lighting Research & Technology, 52:3 (2020) 423-442. https://doi.org/10.1177/1477153519869758
- M.H. Salaheldin, M.A. Hassanain, M.B. Hamida, A.M. Ibrahim, Performance assessment of the built environment in healthcare facilities, Journal of Facilities Management, 19:5 (2021) 569-586. https://doi.org/10.1108/JFM-08-2020-0057
- M. Münch, A. Wirz-Justice, S.A. Brown, T. Kantermann, K. Martiny, O. Stefani, D.J. Skene, The role of daylight for humans: Gaps in current knowledge, Clocks & Sleep, 2:1 (2020) 61-85. https://doi.org/10.3390/clockssleep2010008
- M. Yufka, B. Ekici, C. Cubukcuoglu, I. Chatzikonstantinou, I.S. Sariyildiz, Multi-objective skylight optimization for a healthcare facility foyer space, in: Proceedings of the IEEE Congress on Evolutionary Computation (CEC), Vancouver, Canada, 25-28 June 2016, pp. 1008-1014. https://doi.org/10.1109/CEC.2017.7969418
- S. Cesari, P. Valdiserri, M. Coccagna, S. Mazzacane, The energy saving potential of wide windows in hospital patient rooms under different climatic conditions, Energies, 13:8 (2020) 2116. https://doi.org/10.3390/en13082116
- S. Khelil, A.E. Khelil, N. Zemmouri, Responsive skins as a means to daylight harvesting in patient rooms in hot arid climates, Algerian Journal of Environmental Science and Technology, 8:1 (2022). https://doi.org/10.37575/b/sci/210082
- L.A. Willekens, L. Krabshuis, E. Miedema, Design features in the entrance area of Dutch healthcare centers, in: Proceedings of Stream Inclusive Design / Health Promotion - Communal Design Conference, 2022. https://doi.org/10.24404/62CFB285CFCC4677F6CBDE1D
- H. Latha, S. Patil, P.G. Kini, Influence of architectural space layout and building perimeter on energy performance: A systematic review, International Journal of Energy and Environmental Engineering, 14:3 (2023) 431-474. https://doi.org/10.1007/s40095-022-00522-4
- E.M. Ismaeil, A.E.E. Sobaih, Enhancing healing environments and sustainable finishing materials in healthcare buildings, Buildings, 12:10 (2022) 1676. https://doi.org/10.3390/buildings12101676
- I.E. Oduntan, O.K. Akande, Architectural interventions to improve daylight and colour impact in paediatric hospital wards, Journal of African Resilience and Advancement Research, (2023).
- M. Englezou, A. Michael, Assessment of daylight performance and shading devices in inpatient rooms in Cyprus, Procedia Manufacturing, 44 (2020) 277-285. https://doi.org/10.1016/j.promfg.2020.02.232
- N. Eisazadeh, F. De Troyer, K. Allacker, Integrated energy, daylighting and comfort performance of window systems in patient rooms, Architectural Science Review, 65:5 (2022) 319-337. https://doi.org/10.1080/00038628.2022.2099806
- S. Besbas, F. Nocera, N. Zemmouri, M.A. Khadraoui, A. Besbas, Parametric-based multi-objective optimization workflow: Daylight and energy performance study of hospital building in Algeria, Sustainability, 14:19 (2022) 12652. https://doi.org/10.3390/su141912652
- P. Rodríguez, M.A. Campano, S. Domínguez-Amarillo, I.J. Acosta, Optimization of window design in hospital rooms for effective daylight access, E3S Web of Conferences, 487 (2024) 02002. https://doi.org/10.1051/e3sconf/202448702002
- C.F. Reinhart, O. Walkenhorst, Validation of dynamic RADIANCE-based daylight simulations for a test office with external blinds, Energy and Buildings, 33:7 (2001) 683-697. https://doi.org/10.1016/S0378-7788(01)00058-5
- R. Perez, R. Seals, J. Michalsky, All-weather model for sky luminance distribution-Preliminary configuration and validation, Solar Energy, 50:3 (1993) 235-245. https://doi.org/10.1016/0038-092X(93)90017-I
- European Committee for Standardization, EN 17037: Daylight in Buildings, CEN: Brussels, Belgium, 2018.
- Chartered Institution of Building Services Engineers, Lighting Guide LG10: Daylighting and Window Design, CIBSE: London, U.K., 2002.
- Illuminating Engineering Society, IES LM-83-12: Approved Method for Spatial Daylight Autonomy (sDA) and Annual Sunlight Exposure (ASE), IES: New York, USA, 2012.
- Illuminating Engineering Society (IES), Approved Method: IES Spatial Daylight Autonomy (sDA) and Annual Sunlight Exposure (ASE), IES: New York, USA, 2013.
- D. Kremelberg, Practical Statistics: A Quick and Easy Guide to IBM® SPSS® Statistics, STATA, and Other Statistical Software, Sage Publications: Thousand Oaks, CA, USA, 2011, pp. 119-204. https://doi.org/10.4135/9781483385655
- N. Lechner, Heating, Cooling, Lighting: Sustainable Design Methods for Architects, John Wiley & Sons: Hoboken, NJ, USA, 2014.
- Chartered Institution of Building Services Engineers, Weather Data for Daylight Modelling (RI05), CIBSE: London, U.K., 2022.
- S. Wilcox, W. Marion, Users Manual for TMY3 Data Sets, National Renewable Energy Laboratory: Golden, CO, USA, 2008. https://doi.org/10.2172/928611
- D. Kremelberg, Practical Statistics: A Quick and Easy Guide to IBM® SPSS® Statistics, STATA, and Other Statistical Software, Sage Publications: Thousand Oaks, CA, USA, 2011, pp. 119-204. https://doi.org/10.4135/9781483385655
- D. Coakley, P. Raftery, M. Keane, A review of methods to match building energy simulation models to measured data, Renewable and Sustainable Energy Reviews, 37 (2014) 123-141. https://doi.org/10.1016/j.rser.2014.05.007
- BREEAM, Daylight 4a/c Technical Guidance, 2024.
- M. Vaughn, ASHRAE Research Report: 2020-2021, ASHRAE Journal, 63 (10), 2021, pp. 73-87.
2383-8701/© 2026 The Author(s). Published by solarlits.com. This is an open access article distributed under the terms and conditions of the Creative Commons Attribution 4.0 License.

628
Total views
Citations
SHARE ON


