
Article | 19 July 2026
Volume 13 Issue 2 pp. 410-430 • doi: 10.15627/jd.2026.23
Assessing the Accuracy of Multispectral Simulation Tools for Predicting Non-Visual Lighting Metrics in Sports Hall Building
Tiara Nurhuda,1,2,* Rizki A. Mangkuto,3 Joko Sarwono,3 Gontar Amin,1 Wenye Hu,4 Ozgur Gocer,4 Arianna Brambilla 4
Author affiliations
1 Engineering Physics Program, Faculty of Industrial Technology, Institut Teknologi Bandung, Indonesia
2 Department of Industrial Engineering, Universitas Insan Cendekia Mandiri, Indonesia
3 Built Environment Performance Engineering Research Group, Faculty of Industrial Technology, Institut Teknologi Bandung, Indonesia
4 School of Architecture, Design and Planning, The University of Sydney, Australia
*Corresponding author.
tnurhuda@gmail.com (T. Nurhuda)
rizkiam2002@itb.ac.id (R. A. Mangkuto)
jsarwono@itb.ac.id (J. Sarwono)
amingontar26@gmail.com (G. Amin)
wenye.hu@sydney.edu.au (W. Hu)
ozgur.gocer@sydney.edu.au (O. Gocer)
arianna.brambilla@sydney.edu.au (A. Brambilla)
History: Received 20 February 2026 | Revised 8 April 2026 | Accepted 11 April 2026 | Published online 19 July 2026
© 2026 The Author(s). Licensee Solarlits Limited (Hong Kong). This is an open access article distributed under the terms and conditions of the Creative Commons Attribution 4.0 License.
Citation: Tiara Nurhuda, Rizki A. Mangkuto, Joko Sarwono, Gontar Amin, Wenye Hu, Ozgur Gocer, Arianna Brambilla, Assessing the Accuracy of Multispectral Simulation Tools for Predicting Non-Visual Lighting Metrics in Sports Hall Building, Journal of Daylighting, 13:2 (2026) 410-430. doi: 10.15627/jd.2026.23
Figures and tables
Abstract
Sports hall buildings are widely utilized as fitness facilities where the occupants can engage in physical activities to promote their health and well-being. Lighting system within the sports hall buildings must therefore meet several requirements, including those for the emerging non-visual lighting metrics, in support of the health and well-being requirement. Inaccurate prediction of non-visual lighting metrics in such spaces can lead to suboptimal lighting design, potentially affecting the performance and overall experience. Existing validation studies in the literature mostly focused on office buildings, which have fundamentally different characteristics compared to sports facilities. This research thus focuses on the assessment of accuracy of multispectral lighting simulation workflows for the scenarios of electric lighting in sports halls. Field measurements of vertical illuminance and spectral irradiance were conducted at five badminton courts in a sports hall, which were compared with simulations using Lark. Calibration was conducted by adjusting the lower-bound wavelength values and applying calibration factors to each spectral channel in Lark. After calibration, the percentage error of vertical illuminance was reduced to an acceptable level of -0.4% to +1.5%. Overall, this study highlights the importance of incorporating accurate simulation input and calibrated multispectral tools in sports hall lighting design.
Keywords
calibration, circadian stimulus, lighting design, melanopic edi, multispectral simulation tool, sports hall, validation
Nomenclature
| CLA | Circadian light |
| CS | Circadian stimulus |
| CSt,f | Circadian stimulus as a function of exposure duration and distribution |
| Ee(λ) | Spectral irradiance at wavelength (W/m²/nm) |
| Ev | Vertical illuminance (lx) |
| Eev,sim | Simulated vertical illuminance (lx) |
| Ev,meas | Measured vertical illuminance (lx) |
| Eeλ,sim | Simulated spectral irradiance at wavelength (W/m²/nm) |
| Eeλ,meas | Measured spectral irradiance at wavelength (W/m²/nm) |
| F | Calibration factor for each spectral channe |
| Kcd | Luminous efficacy constant (683 lm/W) |
| mel-EDI | Melanopic Equivalent Daylight Illuminance |
| NRMSE | Normalized root mean square error (–) |
| PE | Percentage error (%) |
| R | Ratio between measured and simulated vertical illuminance |
| SPD | Spectral power distribution |
| λlo | Lower bound wavelength of spectral channel (nm) |
| λlo,ori | Original lower bound wavelength of spectral channel (nm) |
1. Introduction
1.1. Non-Visual Effects of Light
Beyond its role in vision, light also acts as a biological signal that influences various human functions. Light can significantly affect physiological responses and alertness in humans, with effects that vary depending on the time, quantity, duration, and wavelength of exposure [1]. These non-visual effects are primarily mediated through intrinsically photosensitive retinal ganglion cells (ipRGCs), which send signals to areas of the brain that regulate circadian rhythms, hormone secretion, and sleep-wake cycles. Consequently, light exposure can affect melatonin suppression, mood regulation, cognitive performance, and overall well-being [2], with short-wavelength (blue) light shown to be particularly effective in stimulating these responses [3,4].
As research on these mechanisms advanced, it became evident that conventional photometric quantities are insufficient to describe the physiological impact of light on humans.
Conventional light measurement relying on photopic illuminance is unable to represent the complexity of the biological response it elicits [5,6], primarily because they do not account for the distinct spectral sensitivities of each photoreceptor type (ipRGCs, rods, and three types of cones) [7,8]. Therefore, new metrics have been introduced to account for the spectral sensitivity of different photoreceptors.
A system of α-opic irradiances was introduced by [9] to address the challenges in quantifying light based on its non-visual effects. This approach allows illuminance to be evaluated according to its effective impact on each of the five known human photopigments (opsins). With further refinements, this methodology has been formalized in the CIE S 026 standard as part of an SI-compliant metrology framework. In this system, α-opic equivalent daylight illuminance such as mel-EDI as shown in Equation (1).
Here, Smel (λ) represents the melanopic action spectrum, and 0.0013262 is the melanopic efficacy for the D65 standard illuminant [7]. Mel-EDI is the level of photopic illuminance to the eye caused by D65, which is required to produce the same excitability of ipRGCs as the light source under consideration.
Besides mel-EDI, two metrics have been designed to assess the effects of light on the human circadian system include circadian stimulus (CS). Unlike mel-EDI, which provides a direct measure of the melanopic effectiveness of light, CS indicates the degree to which the light can suppress melatonin hormone production, which is essential in maintaining healthy circadian rhythms. While CS considers both response magnitude and spectral sensitivity [10], [11]. CS and CL calculated based on spectral irradiance and vertical illuminance measurements with CS Calculator 2.0 [12] considering the spectral sensitivity of the circadian system and is expressed as a value between 0 and 0.7. Moreover, the CSt,f depends on time t and circadian light exposure CLA as shown in Equation (2).
Variable t is the duration factor measured in hours, and is a continuous variable from 0.5 to 3.0, Variable f is the distribution factor, depending on the spatial distribution of the light source used in the experiment, which is taken as 1.0 in this study. The CLA equation depends on light source spectral irradiance, melanopsin sensitivity (corrected for crystalline lens transmittance), S-cone fundamental, macular pigment transmittance, and photopic and scotopic luminous efficiency function [11].
Many studies address non-visual effects in office environments, due to their high economic value [13-18]. However, similar attention has not been given to sports environments, even though athletes' visual and physiological performance is also greatly affected by light exposure. Unlike office workers who experience relatively stable lighting conditions, athletes are often exposed to dynamic, high-intensity lighting that can affect visual comfort and circadian responses [19], making sports facilities an essential but under-researched context in non-visual lighting research [20].
1.2. Sports lighting
Sports hall buildings are widely used as fitness facilities, providing spaces for people to engage in physical activities that support their health and well-being. In many indoor sport activities, the lighting system within the sports hall building or playing court area must meet several requirements relevant to the needs of the sport [21]. For example, in badminton sport, optimal lighting should be able to provide adequate visual performance throughout the court area, so that the shuttlecock can be clearly seen by players, umpires and spectators, both when the shuttlecock is on the floor and when it is hovering at various heights above the court. In addition, the lighting systems also need to have a low glare index to maintain visual comfort of the players [22]. However, understanding and optimizing these effects require validation studies that reflect the unique spatial and lighting characteristics of sports environments.
Existing validation studies have primarily examined the accuracy of spectral simulation tools in office-based environments [23]. However, their findings cannot be directly transferred to sports facilities, where lighting conditions, spatial configurations, and user behaviour differ substantially.
Offices typically have lower ceiling heights (2.5~3 m), uniform lighting conditions, and a mix of daylight and electric light sources. In contrast, sports halls have high ceilings (10~16 m), fully electric lighting setups, and asymmetrical LED floodlights with strong directional light distributions. Additionally, typical office workers engage in relatively static tasks, whereas athletes constantly move, requiring precise vertical illuminance levels to ensure visibility at various heights and angles. The study of [24] on sports lighting simulations emphasizes that lighting uniformity, glare control, and dynamic movement adaptation must be accounted for separately from conventional office lighting validation models.
This understanding is particularly relevant in lighting design for sports environments which has a major impact on top-class sports and recreational sports activities. Top-class sports require venues that are designed for top performance, both in terms of competition and training [25]. Athletes are particularly vulnerable to the negative effects of light on their physical and mental performance as they often exercise under these conditions for long periods of time [26-27]. In addition to improving visual comfort and performance, well-designed lighting environment in sports hall supports athletes' circadian rhythms, improving sleep, recovery and general health. Proper lighting can help maintain concentration, quick reactions anoffid a balanced circadian cycle, allowing players to perform optimally during matches [28-29].
The application of information on ipRGC and its function in the regulation of circadian rhythms is particularly relevant for sports environments. Many factors, including light exposure, stress, sleep habits, body temperature, physical activity, hormone production and diet all have significant impacts on circadian rhythms [30-32]. To design lighting that supports visual performance and physiological well-being in sports facilities, accurate multispectral modelling and simulation are required because photopic metrics alone are insufficient to evaluate the non-visual effects of light.
Recent bibliometric analysis shows that most of the scientific research on badminton is heavily focused on the fields of health (54.9%) and sports medicine (16.4%). Although the engineering discipline is beginning to emerge at 12.3% [33], there is a significant professional gap in integrating technical solutions to practically support these medical findings on the field. Post-occupancy evaluation studies reveal that analytical research on the performance of sports venue facilities remains limited. Field findings indicate that on-site technical measurements often do not align with users’ comfort perceptions, where lighting conditions, air conditioning, space, and background color still require concrete improvement measures [34]. This demonstrates that current professional evaluation parameters, which rely solely on traditional photometric metrics such as horizontal illuminance, are no longer sufficient to ensure athletes’ satisfaction and biological well-being [24,35-37].
Therefore, the professional gap identified in this study is the lack of calibration methods and multispectral simulation workflows that practitioners can use to accurately predict non-visual (melanopic) lighting metrics, given that conventional photopic metrics alone are insufficient to describe the biological impact of light on athletes.
1.3. Multispectral simulation tools
Spectral simulation tools allow lighting designers to predict the effects of light accurately, even before the lighting system is physically implemented. Multispectral simulation tools have been extensively used in lighting design over the past decades to predict various lighting conditions encountered in daily life [38-40]. Since different light sources generate different spectral power distributions, multispectral tools are thus very important in simulating the interaction between various light sources in helping to create a built environment that supports the non-visual effects of light [41]. ALFA [42] and Lark [39] are the most popular tools for building design when it comes to the non-visual effect. ALFA provides more detailed predictions of spectral irradiance by dividing the wavelength range from 380 nm to 780 nm into increments of 5 nm, resulting in 81 channels. This enables high-resolution analysis of the spectral composition of the irradiance and its impact on the entire visible spectrum [42]. Meanwhile, Lark simplifies this process by predicting spectral irradiance across nine broader channels and offers a less detailed approximation [39], [43].
The accuracy depends on several factors, including surface material specifications, modelling details, simulation algorithms, and the characteristics of the light sources. An additional factor that significantly affects simulation precision is the number of simulation channels employed in the multispectral simulation process [44]. In this context, channels refer to discrete spectral intervals into which the visible light spectrum is divided for computation. A higher number of channels allows finer spectral resolution, enabling the simulation tool to capture subtle variations in the SPD of a light source. The more channels utilized to capture a broader spectrum of light wavelengths, the greater the potential for accurately representing the complex interactions between light and surfaces in an environment, especially in electric lighting scenarios [45].
Another critical aspect influencing the accuracy is how lighting simulations are configured to replicate direct measurements, particularly when evaluating non-visual metrics. Calibration typically involves adjusting the simulation results, so they align with direct measurements. This process ensures that the simulation tool reflects actual conditions. Vertical illuminance was used as a reference parameter to represent real-world lighting situations, calibrating against this metric is an important step to establish baseline accuracy for the simulation tool [46]. In turn, tuning is typically conducted by making detailed adjustments to the simulation parameters, calibration was performed by adjusting the simulated spectral irradiance output to better align with measured spectral data. Although spectral irradiance is not a simulation input parameter, it is the key output that influences non-visual lighting metrics. The tuning process involved modifying the spectral channel scaling and adjusting the lower bounds of the wavelength ranges to improve the match between simulated and measured spectral profiles. This tuning process is done by ensuring proper alignment between peaks and troughs in the wavelength distribution [16] and then by randomizing the samples to minimize the resulting errors. However, according to [47] there is not widely "acceptable" error rate that serves as a standard reference point for simulation calibration. A prior study [48] found that the difference between the simulated and measured indoor horizontal photopic illuminance might vary by as much as 20%, with an error of 10% using radiance simulation engine.
Computer modelling and simulation have been extensively employed in the field of lighting design over recent decades to predict and evaluate dynamic luminous environments encountered in daily life [49]. These tools allow designers to visualize and optimize lighting strategies before implementation. However, the accuracy of such simulations remains an ongoing concern, particularly when used to estimate non-visual lighting metrics that depend on spectral precision [50].
Most lighting simulations in previous studies have focused on horizontal work planes, such as floors or desktops, which are suitable for office and classroom environments [51-52]. In contrast, simulations in the vertical plane, especially at eye level, are rarely performed. This type of modelling is highly relevant for sports activities like badminton, where athletes often look forward or upward during play. Accurate modelling of vertical illuminance and spectral exposure at eye level is essential for assessing both visual and non-visual lighting impacts in indoor sports environments.
However, previous studies have shown relatively high errors (±20%) between simulated and measured results [44,53-54] , indicating the need for further refinement in simulation accuracy. Moreover, to date, no validation study has specifically examined multispectral simulations for sports buildings, where complex lighting conditions are often encountered [20,55]. The need for validating spectral simulation tools in sports halls is further reinforced by research demonstrating that current simulation methods struggle to accurately predict light distribution in high-ceiling environments [20,55].
There are relatively few studies in the literature that focus on simulating lighting distribution and spectral composition in indoor spaces such as sports hall. Sports halls rely entirely on electric light sources that exhibit distinct spectral peaks and troughs. If spectral simulation tools do not account for these variations, they may misrepresent SPD, overestimate or underestimate critical non-visual lighting metrics, and lead to inefficient lighting [56].
In response to these concerns, this study aims to a thorough validation, involving calibration, of the Lark spectral lighting tool and its accuracy in predicting spectral irradiance and vertical illuminance in a badminton sports hall, from which non-visual lighting metrics are derived. Section 2 describes the methodology in this study, sections 3 and 4 provide the results and discussion, whereas section 5 concludes the article.
2. Methodology
This section provides an overview of the case study building, detailing the methodology used to collect field measurement data, simulate lighting conditions using Lark, perform calibration steps, and analyse errors to assess the accuracy of the simulation’s outputs.
2.1. Case study building
This research was conducted by taking the case of a badminton sports hall in Bandung, Indonesia, called GOR KONI (6°54'53‘S, 107°38'10’E). The main hall serves as the playing arena, measuring 69.8 m ×38.4 m ×16.3 m (see Fig. 1). There are five badminton courts, each measuring 7.13 m ×14.9 m. The sports hall is illuminated by 80 light-emitting diode (LED) luminaires (Osram Simplitz Flood Light 200W 757 MB VS1, 24990 lm), which are positioned to provide uniform lighting across the courts. The luminous intensity distribution and spectral power distribution (SPD) of the luminaires are illustrated in Fig. 2 (a) and (b).
Figure 1
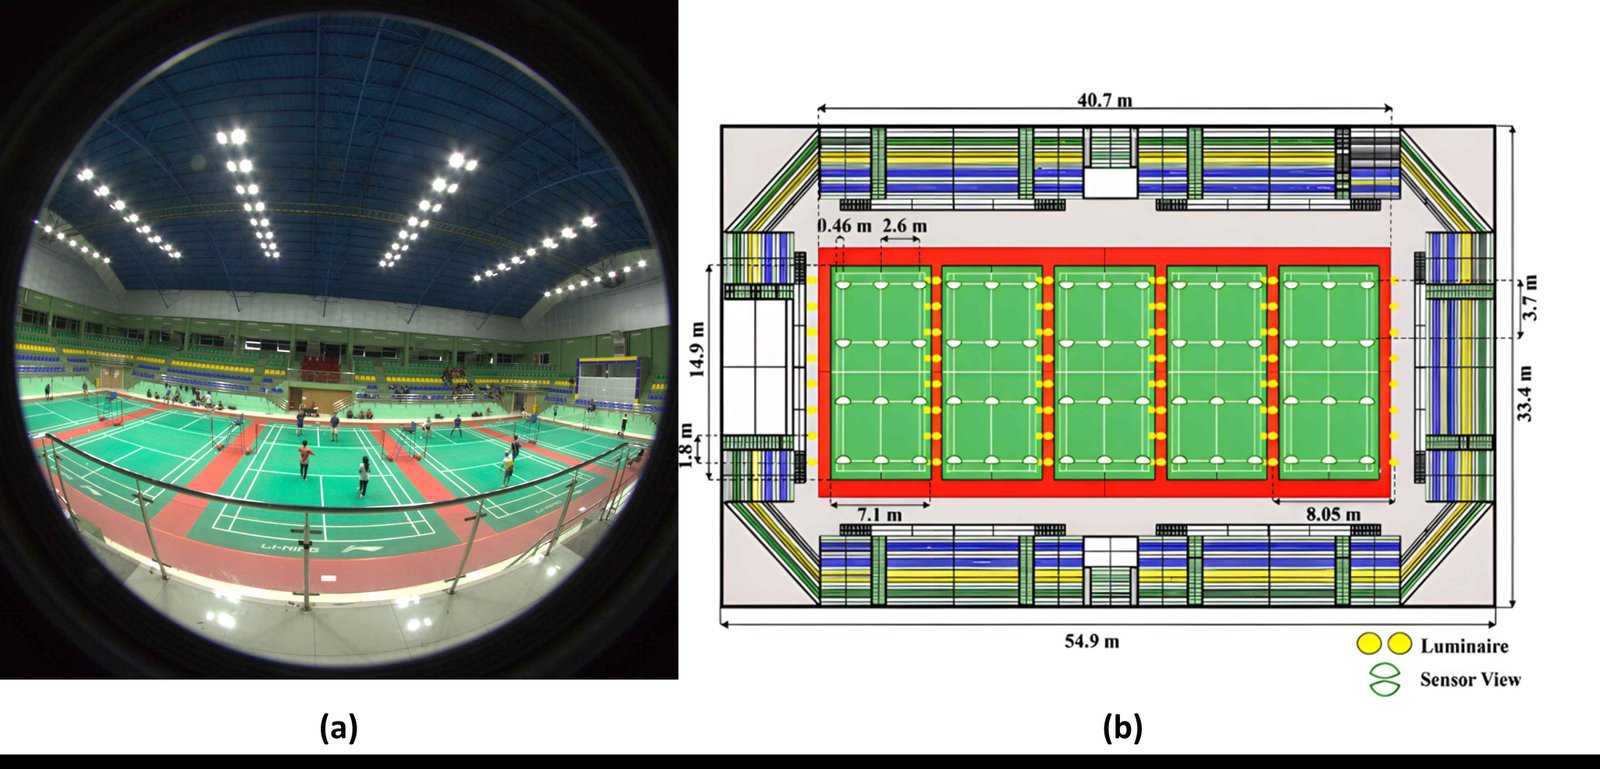
Fig. 1. (a) Indoor view of the observed badminton sports hall and (b) position of luminaires and sensor points at each court.
Figure 2
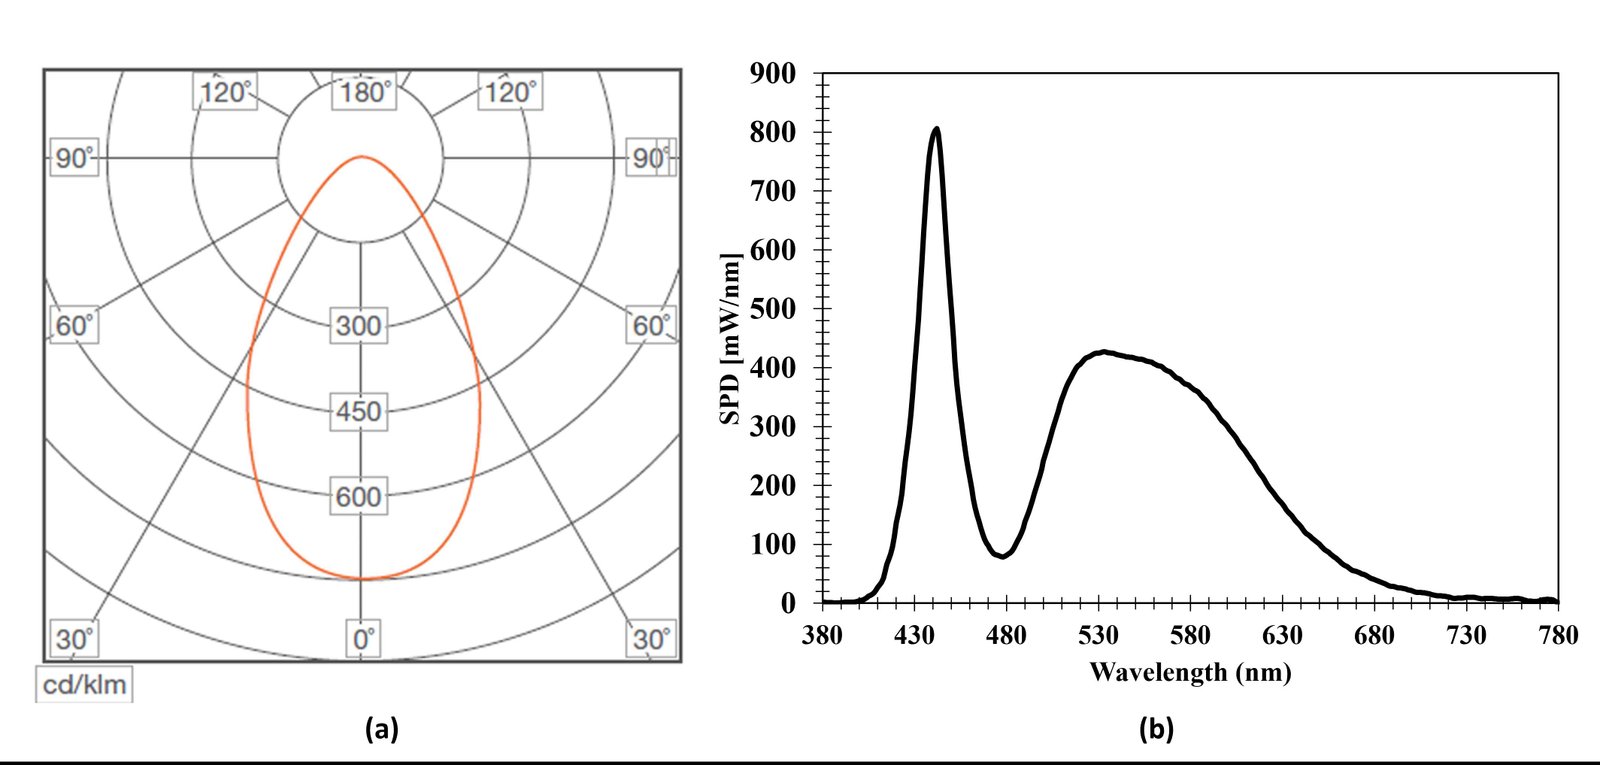
Fig. 2. (a) Luminous intensity distribution and (b) SPD of the luminaire in the sports hall.
The lighting design of a badminton hall must ensure adequate visual performance across the entire court area, enabling players, umpires, and spectators to clearly see the shuttlecock both on the floor and at various heights above the court. Additionally, the lighting system must maintain a low glare index to ensure the visual comfort of players [22]. To meet these requirements, the badminton sports hall in this study employs only electric lighting for illumination, with no daylight inside the building. Furthermore, all interior surfaces are painted with a non-reflective paint to reduce the risk of glare caused by reflections from glossy surfaces. Figure 3 shows the spectral reflectance distribution of each interior surface, measured using Lisun LMS 6600TR spectroradiometer.
Figure 3
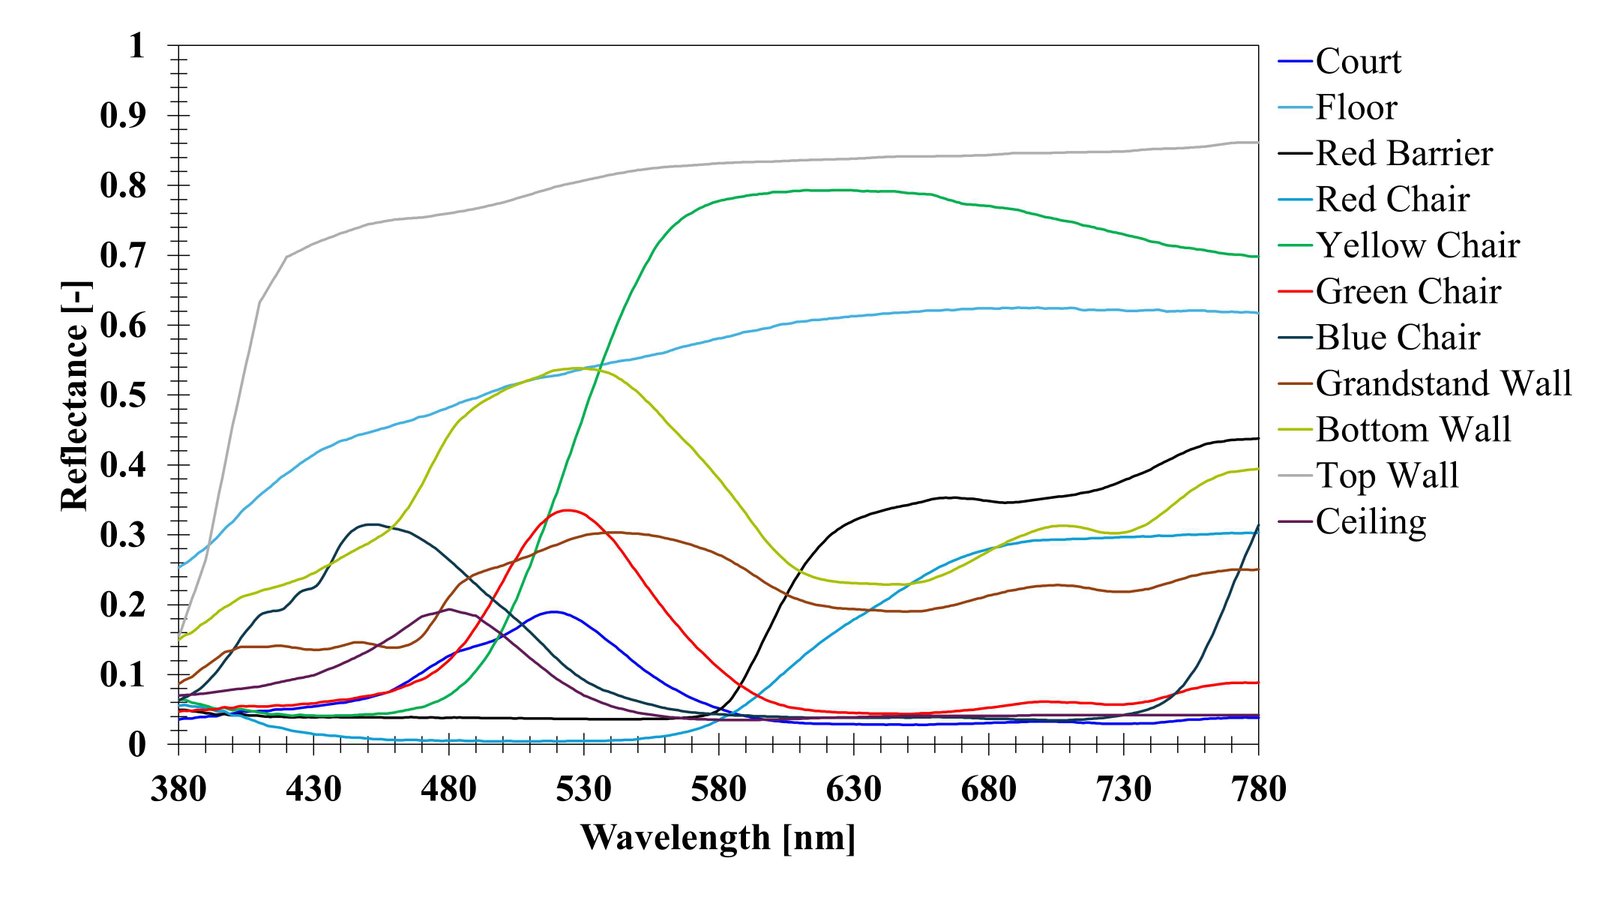
Fig. 3. Measured spectral reflectance distribution of interior surfaces in the sports hall.
The choice to use a single, standard-compliant sports hall is in line with established validation protocols in lighting research. Studies such as [54] have demonstrated that validation in a single, well-characterized environment (an office-like user-test facility) when performed with high-resolution data collection provides reliable insights into tool accuracy. Our selected venue complies with national standards and represents the typical lighting design adopted in many Indonesian indoor sports facilities, characterized by uniform court sizes, ceiling heights, luminaire specifications, and non-reflective finishes. This high level of standardization reduces variability and supports the generalizability of findings to similar venues.
Furthermore, evaluating simulation accuracy requires a controlled setting where variables such as luminaire type, surface reflectance, and lighting geometry are precisely known and reproducible. Therefore, our methodological choice, focusing on detailed measurements and simulation comparisons within one standardized setting, ensures both internal validity and broader relevance. This approach allows for rigorous calibration of tools like Lark before they are deployed in more diverse scenarios.
2.2. Field Measurements and Applied Metrics
The field measurements were conducted sequentially across the five badminton courts (Fig. 4) under a controlled lighting scenario. At each of the 60 vertical sensor points (12 points per court), measurements of spectral irradiance and vertical illuminance were taken individually using a Lisun LMS 6000 spectroradiometer, with 1 nm resolution within the visible range. The sensor was positioned at 1.5 m above the floor level, corresponding to the typical eye level of an athlete. To ensure high data accuracy and consistency, each point was measured one after the other rather than simultaneously to prevent any mutual interference between measurement stations.
Figure 4
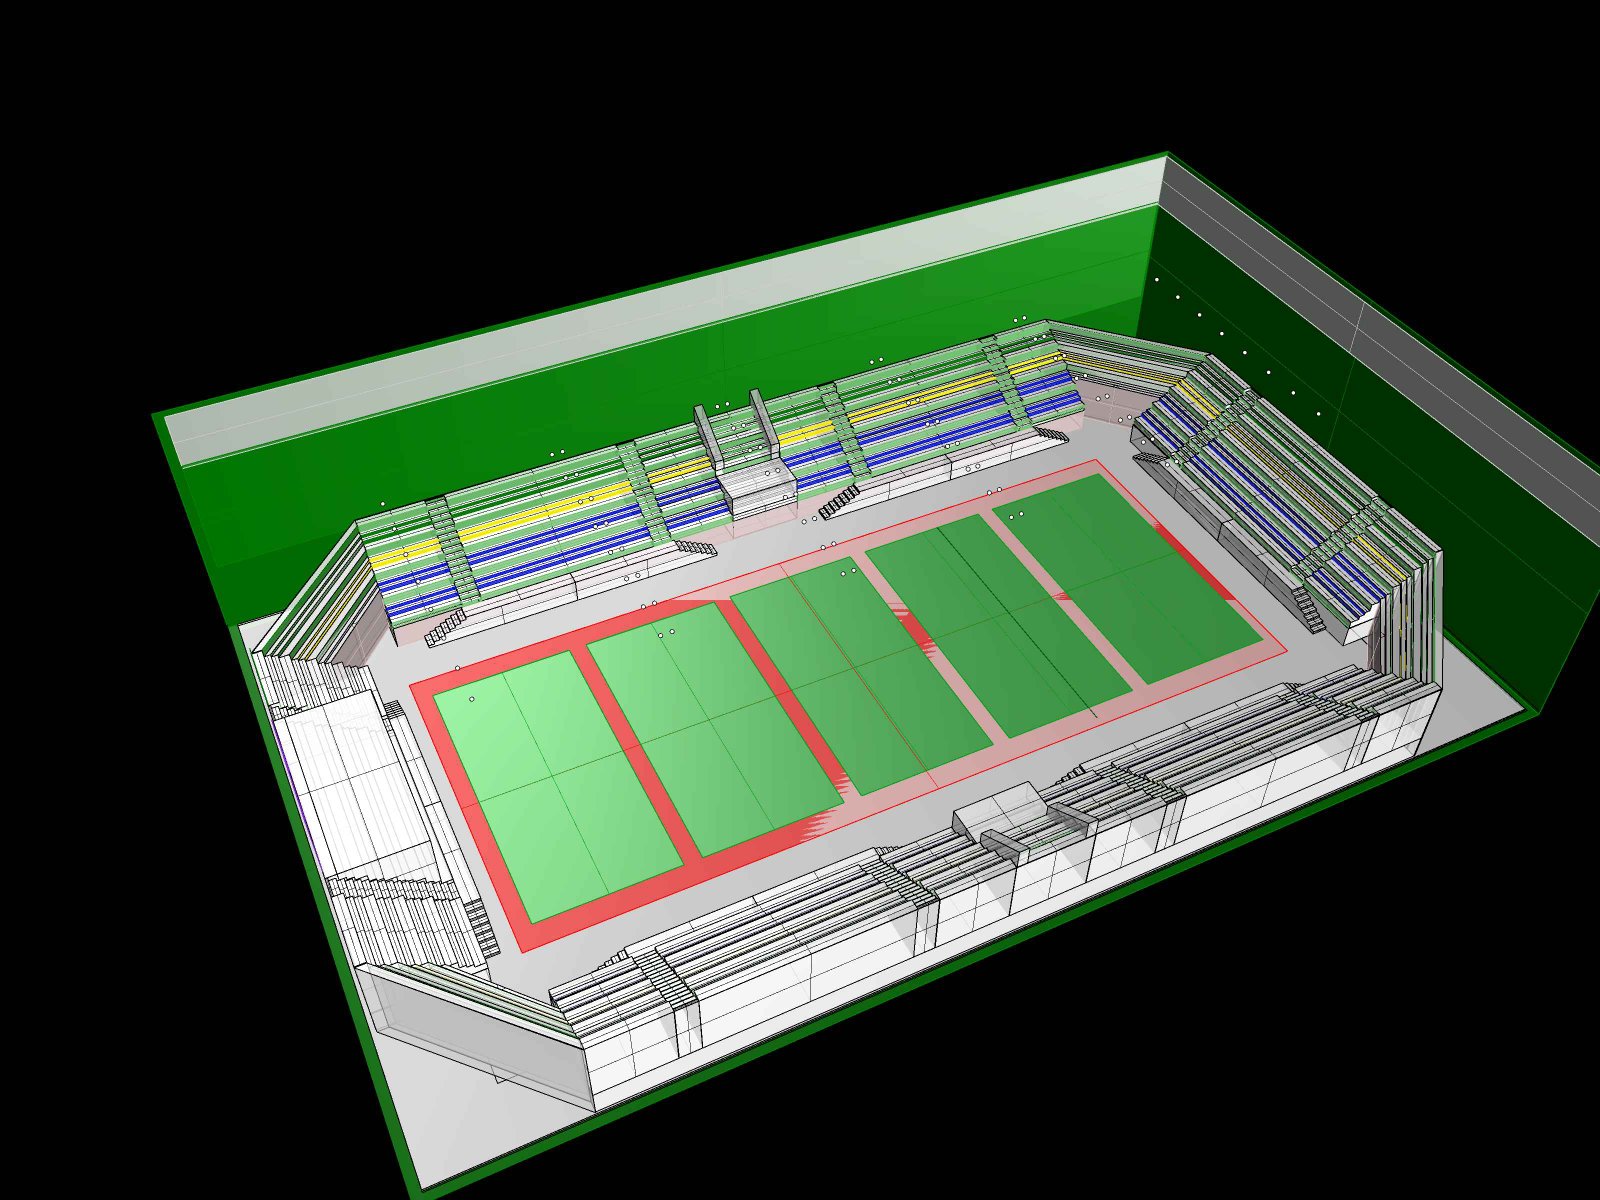
Fig. 4. Geometry of the sports hall in 3D.
The entire measurement process was conducted in a fully unoccupied sports hall, which had been reserved exclusively for the experiment. No players, coaches, or staff were present during data collection, thereby eliminating disturbances such as shadows, movement, or incidental reflections that could otherwise affect the lighting distribution. This isolation allowed the spectral properties of the lighting environment to be captured in their true state, as determined solely by the installed luminaires and architectural conditions.
Only a single lighting scenario was applied throughout the study: the competition mode, in which all 80 LED luminaires (Osram Simplitz Flood Light 200W 757 MB VS1) were fully activated. This mode represents the highest standard illumination level used in the facility and was selected to test the spectral simulation tools under the most demanding lighting conditions.
The different datasets were used for calibration and validation purposes. The calibration phase was conducted by adjusting spectral weighting factors within the Lark input data to improve agreement with measured spectral irradiance. Subsequently, the validation process compared both calibrated and uncalibrated simulation results against independent measurement data collected from the field. At no point were the same data points used for both calibration and evaluation, ensuring that the final reported simulation errors represent genuine tool performance under real-world conditions.
After field measurements were completed, the data were post-processed to calculate mel-EDI, CS and CL at each measurement point. The exposure time (t) was assumed to be 1 hour, representing typical competitive matches. This 1-hour duration was selected as a practical reference condition for the competitive-use scenario considered in this study [57]. It is consistent with reported badminton match durations of approximately 40 minutes to 1 hour and is intended to represent a biologically relevant single-session exposure during competition or intensive training, rather than the total daily exposure of all users [57]. The measurement results of spectral irradiance and vertical illuminance at each point in each court were then calculated according to Equations (1) and (2) to obtain the mel-EDI and CS values.
The next step was to calculate the CLA 2.0 based on the distribution of spectral irradiance and vertical illuminance. The CSt,f value at each court should meet the specified threshold for an effective circadian effect, which is from 0.1 to 0.7 [11]. Meanwhile, the minimum required mel-EDI value is assumed identical to the recommended value for learning and working environments, being 250 lx during daylight hours. This figure is based on a study of healthy adults between the ages of 18 and 55 with a regular daily schedule [58-61]. There has been no study on the minimum recommendation for athletes to achieve regular circadian rhythm and to suppress the melatonin hormone level to increase alertness during sport activities.
2.3. Lark simulations
The simulation tools used in this study was Lark version 3.0 [39], [42], which generates spectral irradiance as the output and utilizes the Radiance engine [62]. Table 1 provides an overview of the specific Radiance parameters applied for each simulation tool to ensure accurate and reliable simulation outcomes. Each simulation parameter is specifically configured according to the unique characteristics of each tool. For Lark, the default ambient division (ad) value of 1024 was used, following the developer's recommendation for electric lighting scenarios [39]. Although [23], [45] employed higher ad values for daylighting studies, the default setting was maintained in this context focused on electric lighting.
Table 1
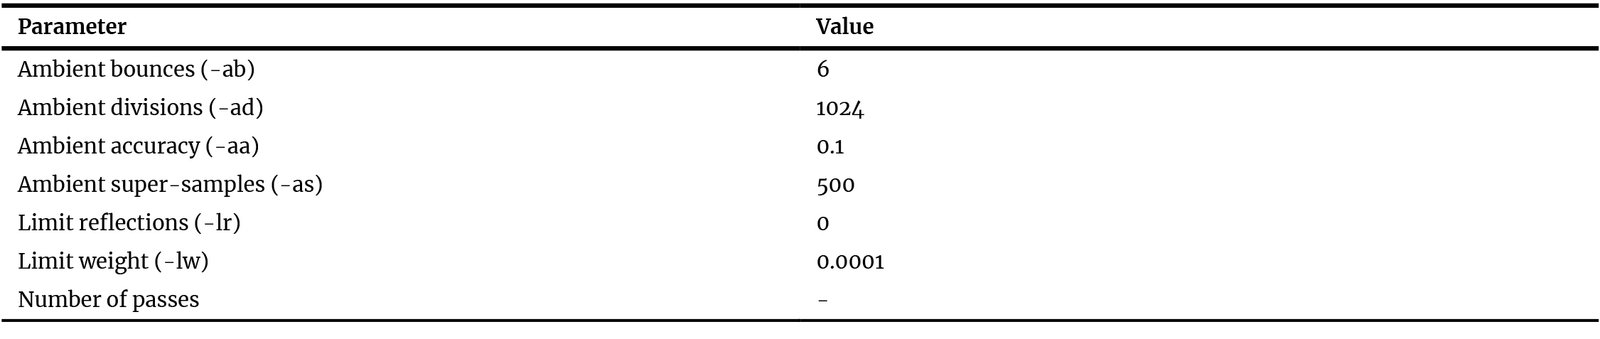
Table 1. Radiance parameters of lark simulations.
Before starting the simulation process, a geometrically accurate model of the badminton sports hall was created in Rhino 3D. This model depicted the actual conditions of the sports hall, including the same dimensions, material properties, and lighting system, thus improving the accuracy and reliability of the results [47], [63].
The level of detail in the 3D model was defined to balance computational efficiency and accuracy in spectral lighting simulations. The following aspects were explicitly incorporated: the ceiling was modelled at a height of 16.3 m to reflect actual sports hall conditions; the badminton court dimensions and markings were modelled according to standard regulations to ensure that the illumination calculations correspond to real playing conditions; the reflectance values of the walls, ceiling, and floor were applied based on field measurements; and the LED luminaires were modelled at their actual mounting positions and angles, with manufacturer-specified SPDs incorporated into the simulation.
The measurement sensor grid was replicated in the model, ensuring that the simulated and measured results are directly comparable. Sensors were placed at the typical eye level, i.e. 1.5 m above the floor. The spectator bleachers (tribune) were modelled in the simulation, as they are large, fixed architectural elements that affect reflectance and light distribution, especially in high-ceiling environments.
The badminton nets and portable sports equipment (e.g., referee chairs, shuttlecock carts) were not modelled, as these are considered temporary objects with minimal impact on overall lighting simulations, particularly for vertical illuminance metrics. The main court playing area (green zone) and the boundary zone (red floor around the court) were modelled with different material reflectance values. The outer circulation floor area was also modelled as a separate surface with its corresponding reflectance value. However, white court markings (lines) were not explicitly modelled, due to their narrow width and minimal influence on large-area irradiance or illuminance. All reflectance values were measured on-site using a spectroradiometer and input into the simulation accordingly. The spectral reflectance distribution of each surface material is shown in Fig. 3.
The same geometric model was used throughout the study; however, the import workflow for Lark required a different approach. In Lark, Grasshopper was used to define and manage the geometry imported from Rhino 3D. A custom Grasshopper workflow was developed to integrate geometric data, lighting properties, material characteristics, and simulation parameters. The Lark simulation generated spectral irradiance and vertical illuminance values at the same spatial locations as the field measurement points, with all virtual sensors positioned at a height of 1.5 m.
SPD was measured directly on-site inside the sports hall using a Sekonic C-800 spectroradiometer (Fig. 5). The measurement was conducted under controlled field conditions by positioning the sensor at a height of 1.5 m and a horizontal distance of 6.6 m from the LED luminaire, resulting in a vertical angle of approximately 30°, directly facing the luminaire. This setup was specifically designed to minimize the effect of reflections from surrounding surfaces. Additionally, a 5 cm high ring baffle was mounted on the sensor to limit stray light.
Figure 5
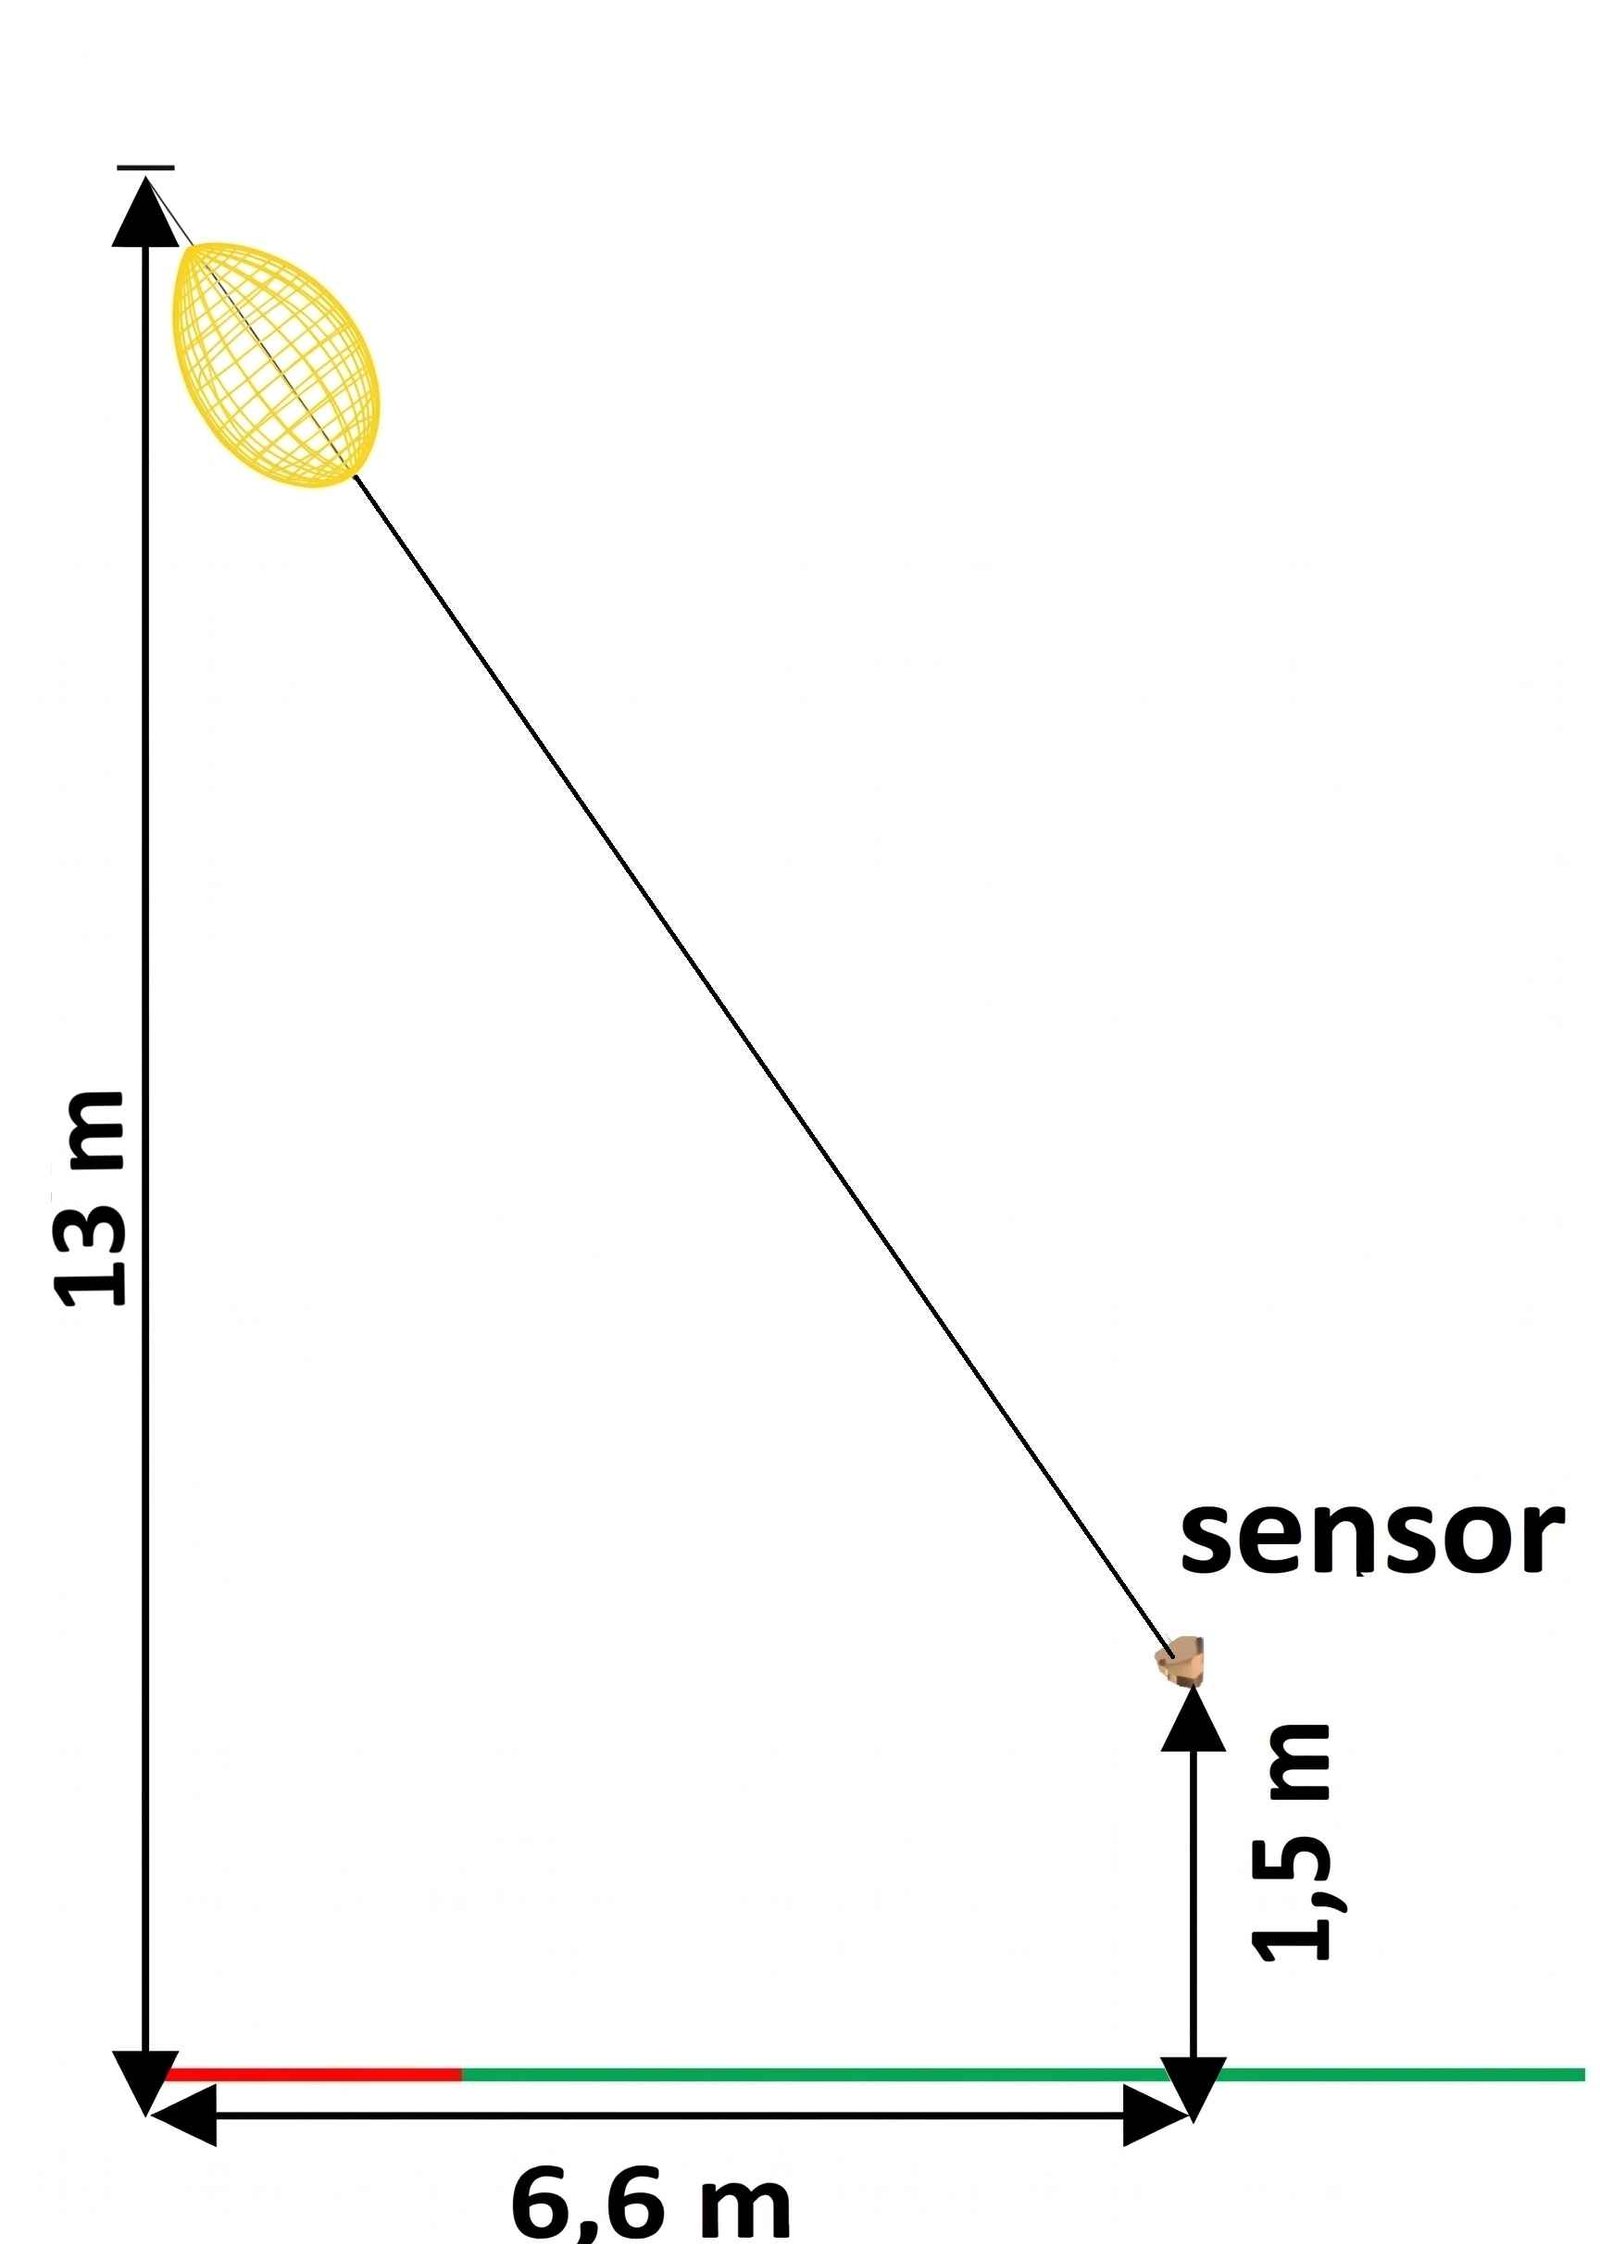
Fig. 5. Schematic elevation view of direct measurement of SPD from the luminaire.
The SPD was implemented into Lark with a 5 nm resolution over the 380~780 nm range, enabling high-fidelity spectral analysis and accurate simulation of non-visual lighting metrics. In the Lark simulation, the light loss factor (LLF) was set to 1.0. This setting assumes no light depreciation due to factors such as luminaire aging, dirt accumulation, or maintenance conditions, serving as a baseline for the subsequent calibration process against field measurements. Our verification process ensured that all geometry, material reflectance, and light source data were consistently applied to the model to minimize potential sources of error unrelated to the spectral simulation algorithm itself.
2.4. Calibration steps
The calibration process involved adjusting the scaling of spectral weighting factors and lower-bound wavelengths in Lark’s input data to reduce the discrepancy between simulated and measured spectral irradiance at sensor locations. This adjustment was applied externally, without altering Lark’s internal computational framework. Rather than proposing a universal correction factor, this study presents a structured calibration approach specific to the tested electric lighting and material conditions. The applicability of such a method to other projects will depend on the SPD of light source and reflectance properties of interior surfaces, which may vary significantly across cases. To ensure transparency, both pre-calibration and post-calibration errors are reported in the manuscript, allowing designers and researchers to understand the expected performance of the uncalibrated tool while also seeing the extent of systematic error correction possible through tuning.
2.4.1. Simulation within the spectral channel
The simulation generates an initial spectral distribution profile, which is essential for subsequent calibration adjustments. At this stage, it is predicted that Lark would require extensive calibration because it has much fewer spectral channels, such that the bandwidths are significantly different from the measuring instrument, which operates in 1 nm or 5 nm resolution.
2.4.2. Tuning the lower bound wavelengths for each channel in lark
The original lower bound wavelengths (λlo_ori) in Lark, which represent the minimum wavelengths for each spectral channel, are listed in Table 2. For the case of Lark, there are nine lower bound wavelengths (λlo), representing the number of spectral channels. The tuning was done using a random sampling process within predefined limits. To define the range of λlo for tuning during the calibration step, 1 nm resolution intervals were selected within each original spectral band. These ranges were determined by analysing the average pattern of measured spectral irradiance, particularly the peak and trough regions. This approach confirms that the randomized λlo used in the calibration process are aligned with the actual spectral characteristics observed in the field measurements.
Table 2
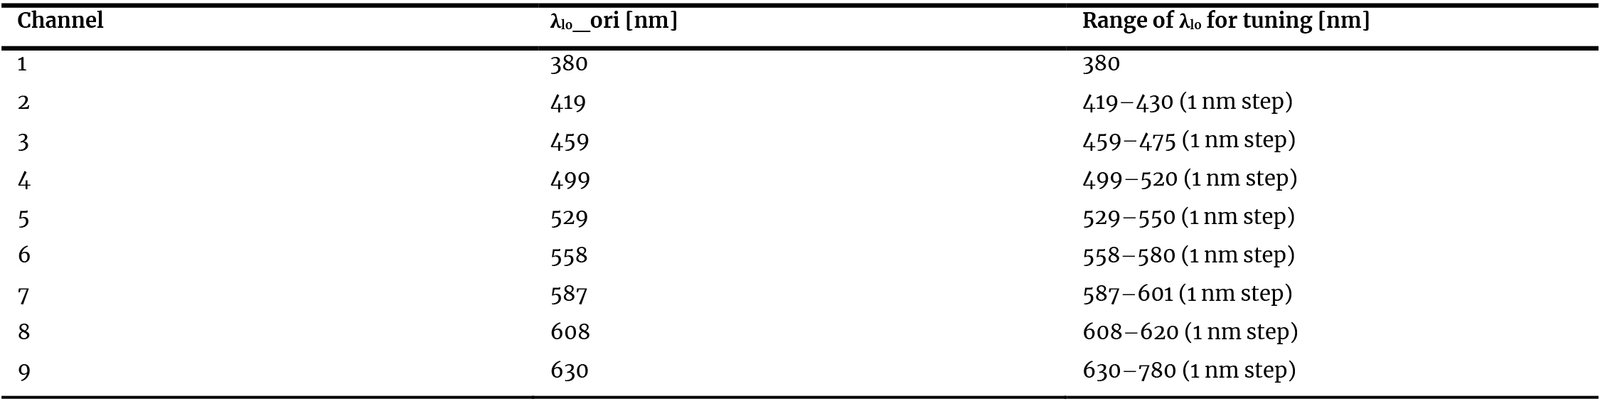
Table 2. Original lower bound wavelength (λlo) for each channel in Lark and the range of randomized λlo for calibration.
This spectral tuning process was performed prior to calculating photopic and melanopic metrics. It involved adjusting the λlo for each of Lark’s nine spectral channels using a controlled random sampling method, as detailed in Table 2. This adjustment aimed to better align the default Lark channel boundaries with the actual spectral shape of the LED lighting used in this study, which exhibits narrow-band peaks not captured well by the original intervals. Importantly, this was conducted as a pre-processing step outside Lark’s internal structure.
The resulting reconstructed spectral profiles were then applied to compute mel-EDI and vertical illuminance using standard photopic and melanopic weighting functions (e.g., V(λ), Smel(λ)). Therefore, while λlo values were adjusted, the physiological metrics were still integrated over validated and correctly weighted spectral distributions.
2.4.3. Calibration factor for spectral irradiances
Equation (3) shows the ratio (R) between measured and simulated vertical illuminance. If this value is applied to all spectral channels, it will only scale the spectral irradiance amplitude evenly, without addressing spectral shape mismatches, especially the misalignment of spectral peaks and valleys with those measured. Therefore, we randomized the calibration factor (F) for each channel individually, combined with a random adjustment to the lower wavelength limit (λₗₒ). This allows us to finely adjust both the amplitude and spectral position of each channel, which is not possible using the average factor alone. The result is a significantly lower NRMSE, allowing the spectral profile to be aligned with the measurement data. We randomized the F values for each channel to minimize errors between measured and simulated spectral irradiance.
In detail, the calibration process began with scaling the vertical illuminance, using the ratio R, as defined in Equation (3).
where Ev(meas) and Ev(sim) are respectively the measured and simulated vertical irradiances at each sensor point at each court. This R values were multiplied by the simulated spectral irradiance prior to calibration, resulting in channel-specific irradiance scaling values.
After defining the range of λlo (Table 2) for each spectral channel based on the average pattern of measured spectral irradiance, particularly its peaks and troughs, the calibration factor (F) range was determined by the average spectral irradiance amplitude from measurements into nine segments, corresponding to 9 channels. For each channel, random values of F were generated using uniformly distributed random functions within the defined range. Simultaneous randomization was then performed across both λlo and F ranges (Table 3). The randomized F values were multiplied by the initial irradiance ratios for each channel, yielding a calibrated spectral irradiance profile.
If we choose the average F, we cannot guarantee obtaining the minimum errors. If the average value of F is used deterministically at all points or simulations, without addressing spectral shape mismatches, especially the misalignment of spectral peaks and valleys with those measured, then the simulation will only scale the spectral irradiance amplitude evenly and fail to align the spectral profile with the measurement data.
Table 3
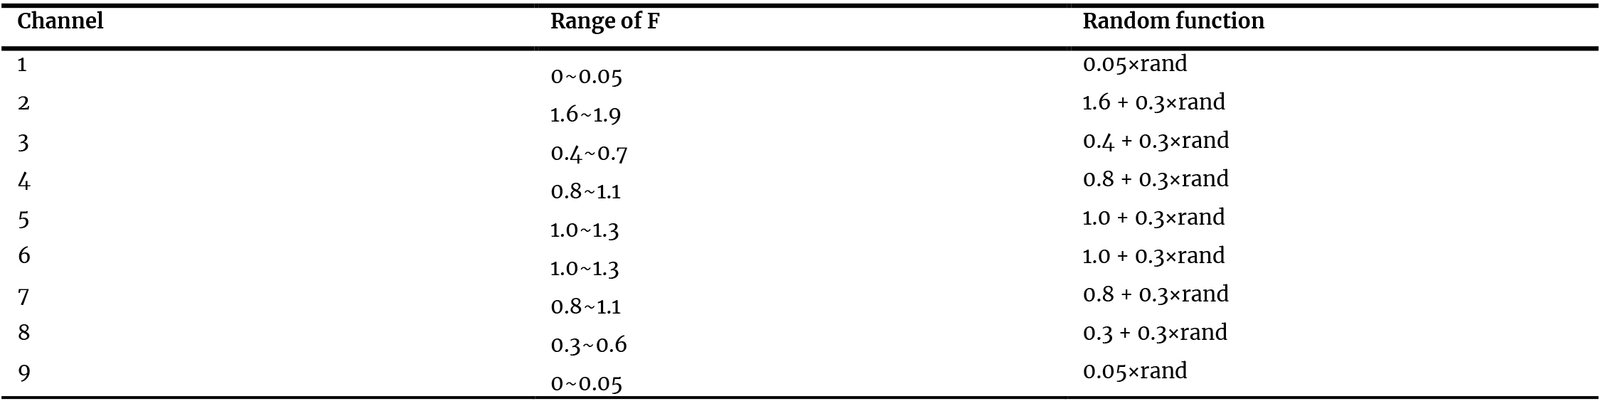
Table 3. Range of calibration factor (F) and its random function for each channel in Lark.
2.4.4. Tuning process with random sampling
The tuning process was performed by repeatedly sampling random values within the specified λlo limit range, and by repeating the random computation 15,000 times. The 15,000 iterations were not intended as unconstrained curve fitting, but as a bounded stochastic search within predefined λlo and F ranges derived from measured spectral characteristics. This procedure was designed to explore the feasible parameter space of Lark’s 9-channel spectral structure under the tested electric-lighting condition and to identify the parameter combination yielding the smallest prediction error. For each iteration, the spectral irradiance was recalculated by multiplying the calibration factors (F) to find the configuration that minimizes the error between the simulated vertical irradiance (Ev_tuning) and the corresponding measured values. The simulated vertical illuminance was predicted by integrating the weighted spectral irradiance Ee(λ).
The λlo and the calibration factor F for each channel were then tuned to obtain the closest vertical illuminance value to the measured one.
where Kcd is the luminous efficacy constant of 683 lm/W.
It is important to emphasize that this calibration factor (F) was applied only after the spectral shape reconstruction was completed. The simulated irradiance values were first tuned based on the adjusted λlo values, and then amplitude-scaled using F to more closely match measured data. Lighting metrics such as mel-EDI and CS were calculated after these steps, ensuring the use of accurate spectral input.
This workflow preserved the validity of spectral integration and avoided applying photopic or melanopic coefficients to misaligned or altered wavelength intervals. All physiological metrics were derived from corrected spectral distributions and processed using standard tools, such as Rea’s CSd Calculator 2.0 and CIE-recommended sensitivity curves. We did not perform interpolation between the 9 spectral channel values, instead, the spectral irradiance input to the CSd Calculator was constructed by directly assigning constant irradiance values to the corresponding wavelength ranges (380~780 nm) based on the calibrated Lark output. Specifically, the calibrated irradiance values for each of Lark’s 9 spectral channels, obtained through iterative random sampling and tuning to minimize the error against field measurements were uniformly applied across the respective wavelength intervals. This resulted in a stepwise spectral distribution with 401 values, where each range retained a constant irradiance level. This method reflects the original Lark output structure after calibration and avoids introducing additional assumptions through interpolation.
2.4.5. Results and Visualization
After identifying the λlo that minimized the error, the final calibration factor and the calibrated spectral irradiance for each channel were recorded. To visualize the accuracy of this tuning process, a graph was plotted comparing the simulated tuning results against the measured data. This comparison indicates the effectiveness of the calibration and provides visual confirmation of the alignment between the simulated and measured spectral irradiance values.
2.5. Error analysis
After tuning, post-processing was carried out to obtain mel-EDI and CSd values, followed by an error analysis of the simulation tool. Only errors in the electric lighting scenario with a lighting system configuration suited for competition settings were analysed. To compare the simulated (sim) and measured (meas) values of mel-EDI and CSd, the percentage error (PE) was calculated as shown in Equations (5), (6) and (7), while Ee,λ represents the spectral irradiance at wavelength λ, expressed in W/m²/nm, as measured or simulated at each sensor point, the normalized root mean square error (NRMSE) was calculated as shown in Equation (8).
The NRMSE showed how well the simulation mimics the spectral irradiance pattern at each wavelength, whereas PE focused on the relative error of the individual values. PE was more suitable for data that varied over a wide range, such as vertical illuminance that may change significantly between locations or conditions. This helped to ensure that relatively small errors in certain areas did not mask more significant deviations in other areas. The tolerance limit for error was considered as 20% [64].
3. Results
The sections below report the results related to the comparison of the two simulation tools with the measured quantities. Particularly, these sections refer to spectral irradiance, vertical illuminance, melanopic EDI and CS.
3.1. Spectral irradiance
Figure 6 displays the measured and simulated average spectral irradiance at each court at a height of 1.5 m. Figure 6 illustrates that the simulated spectral irradiances of Lark reveal a coarse approximation of the LED spectra, clearly exhibiting the characteristic step-like pattern resulting from its 9-channel spectral resolution. Unlike the continuous smooth curve of the measurement, Lark's output is discretized, leading to visible deviations in spectral shape. This deviation is quantitatively analysed in Fig. 7 using NRMSE. The distribution of NRMSE for Lark indicates a significant disparity between simulation and measurement, with a relatively wide range of error. Numerically, Lark exhibits a mean NRMSE of 1.186, with a range spanning from a minimum of 0.885 to a maximum of 1.589. These high NRMSE values confirm the spectral misalignment observed in the visual comparison in Fig. 6. Consequently, the discrepancies in spectral shapes and wavelength peaks suggest that the default Lark simulation inputs result in substantial bias. Therefore, calibration is necessary to adjust the spectral irradiance shape in Lark.
Figure 6
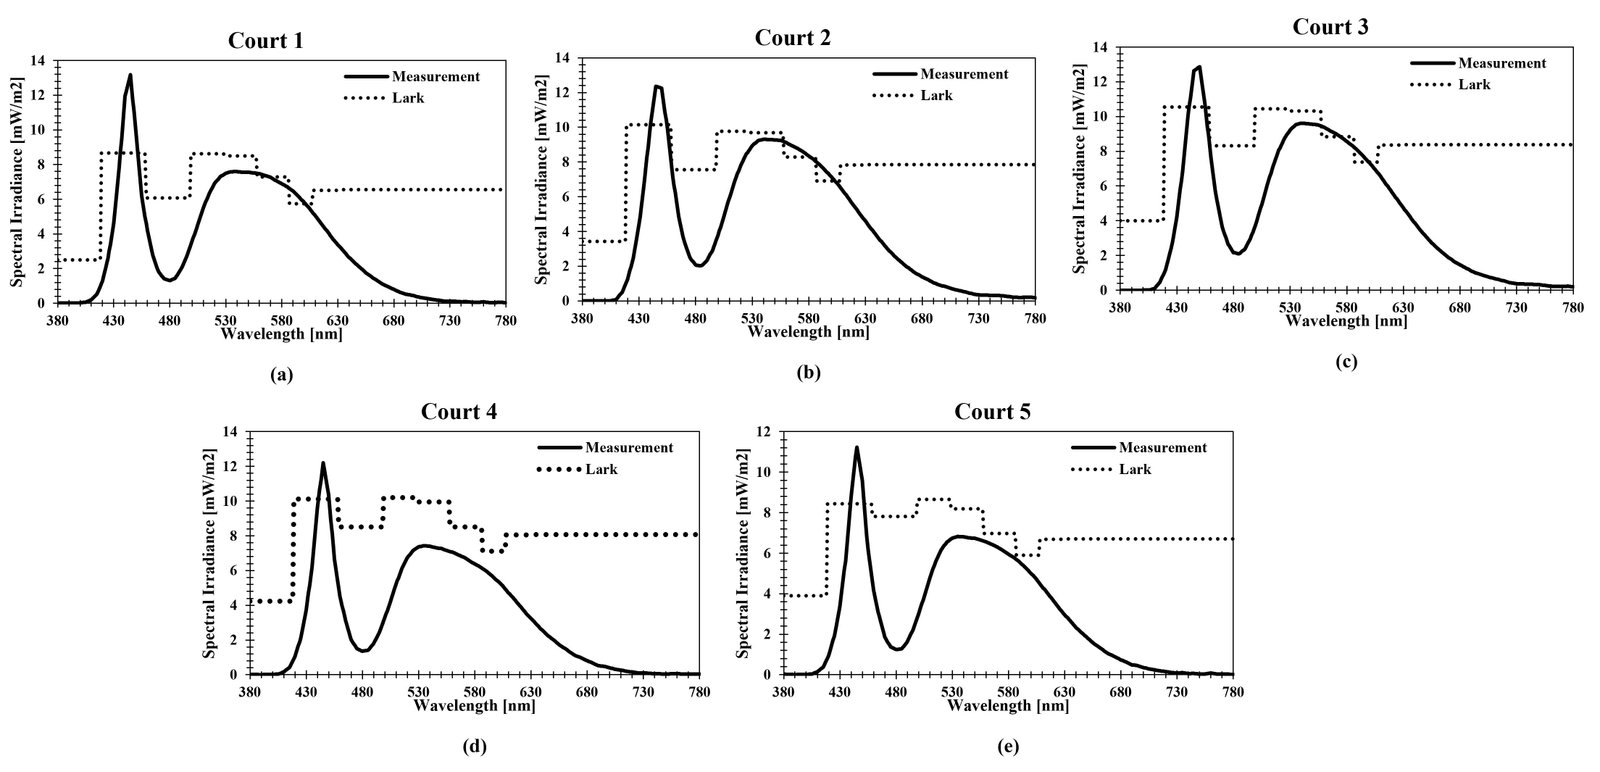
Fig. 6. Measured and simulated average spectral irradiances from the 12 vertical sensor points at Court 1 (a), 2 (b), 3 (c), 4 (d), and 5 (e).
Figure 7
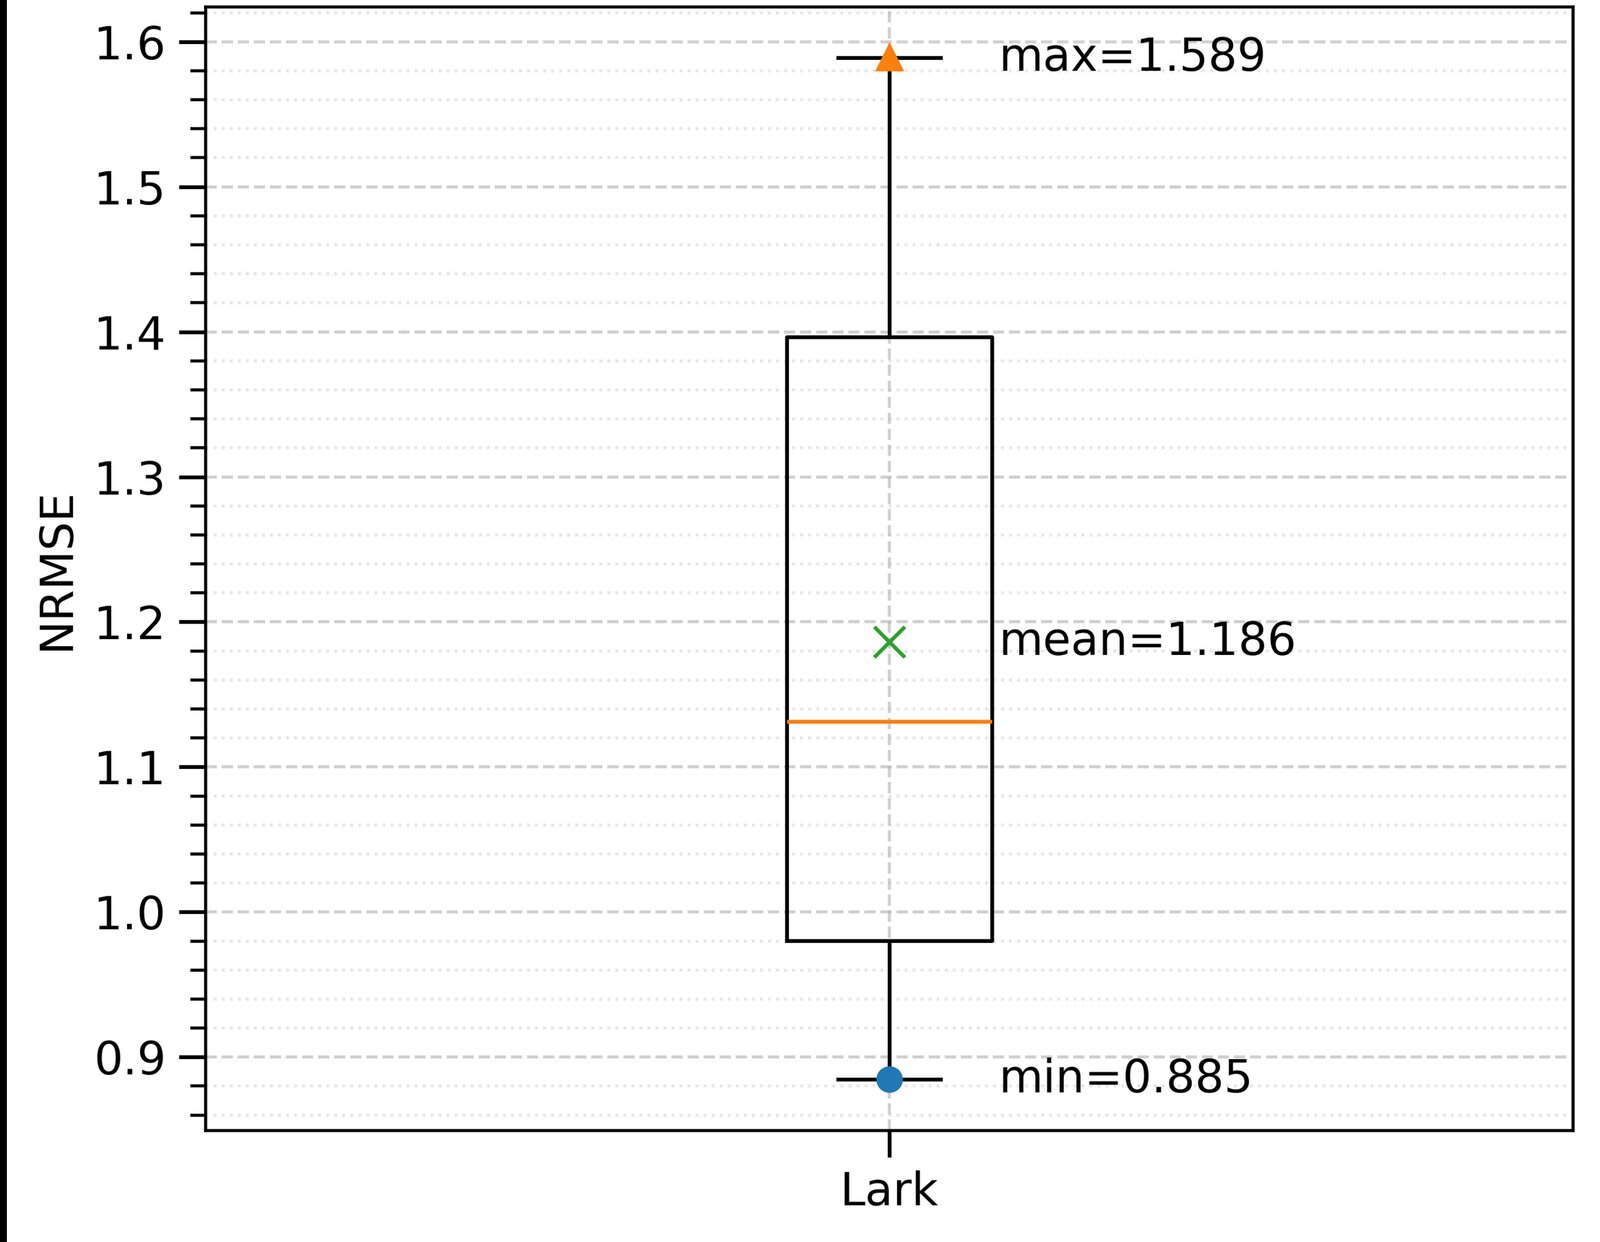
Fig. 7. NMRSE ranges relative to the prediction of the spectral irradiance in Lark before calibration.
Table 4 shows λlo for channels 1 until 9 are respectively 380 nm, 427 nm, 461 nm, 510 nm, 540 nm, 568 nm, 596 nm, 615 nm, and 692 nm. Where the calibration factor (F) is presented for each channel, respectively 0.036, 1.705, 0.536, 0.948, 1.150, 1.190, 0.959, 0.460, and 0.011 for channels 1 until 9. The λlo and F values are taken based on the smallest PE (%) value among the 15000 randomized data.
Table 4
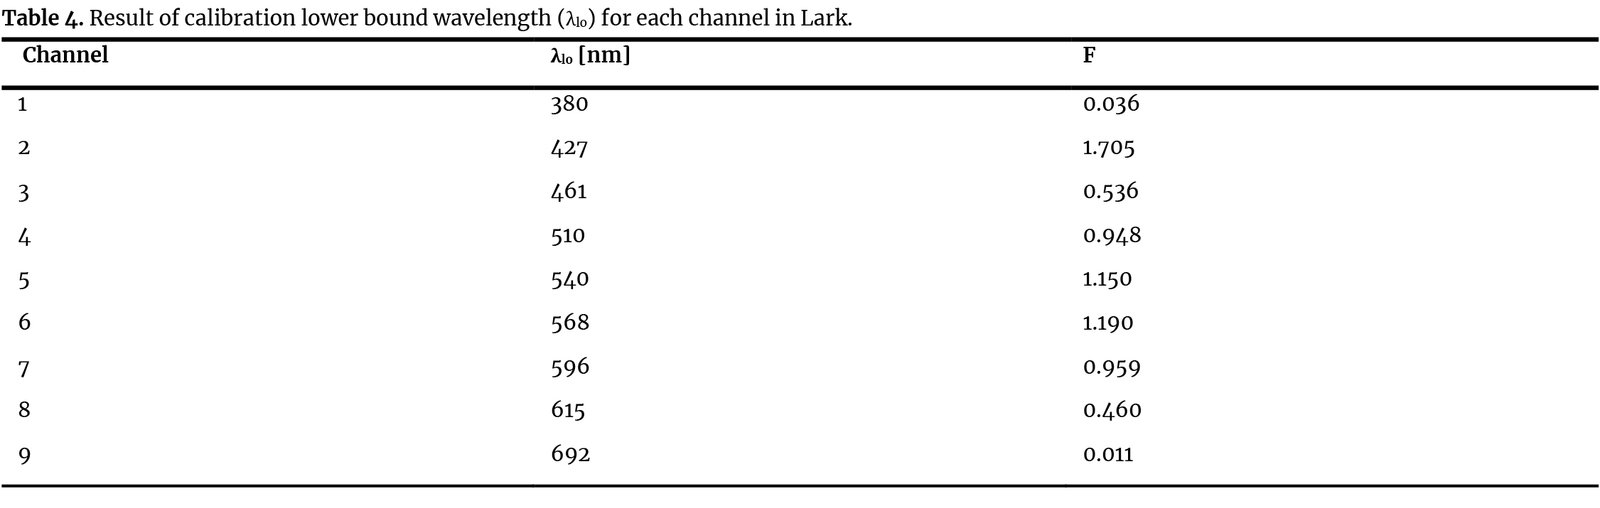
Table 4. Result of calibration lower bound wavelength (λlo) for each channel in Lark.
Figure 8 shows the average spectral irradiance in measurements and simulations using Lark after calibration, the pattern produced by Lark after calibration is like the spectral irradiance pattern in measurements. In addition, in Fig. 9, the NRMSE produced by Lark after calibration has improved, with an average NRMSE of 1.042 and a smaller range of 0.895 to 1.233.
Figure 8
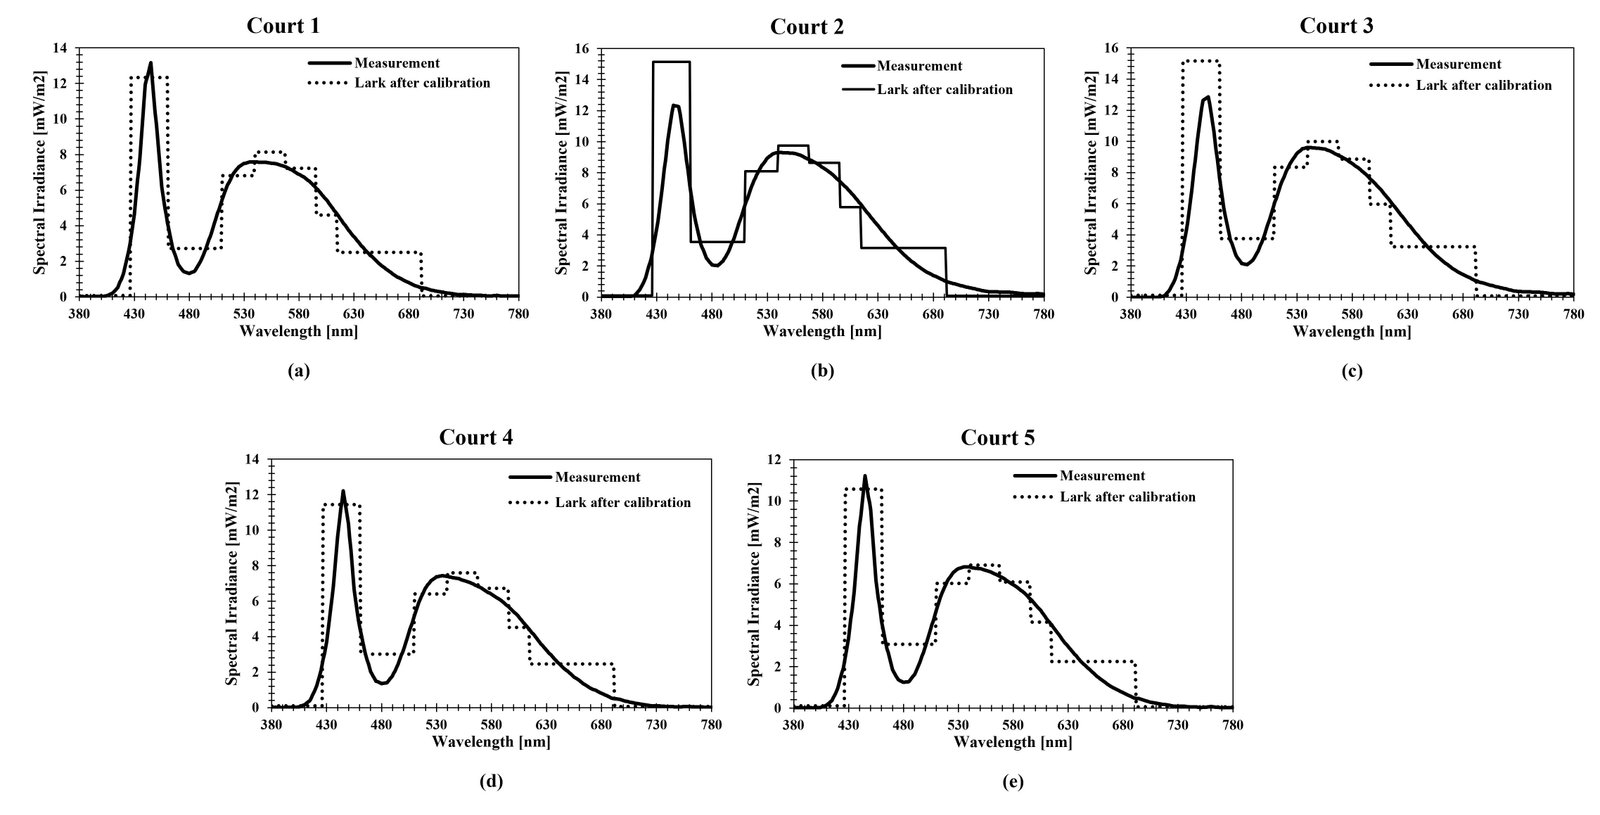
Fig. 8. Measured and average spectral irradiances of Lark after calibration from the 12 vertical sensor points at Court 1 (a), 2 (b), 3 (c), 4 (d), and 5 (e).
Figure 9
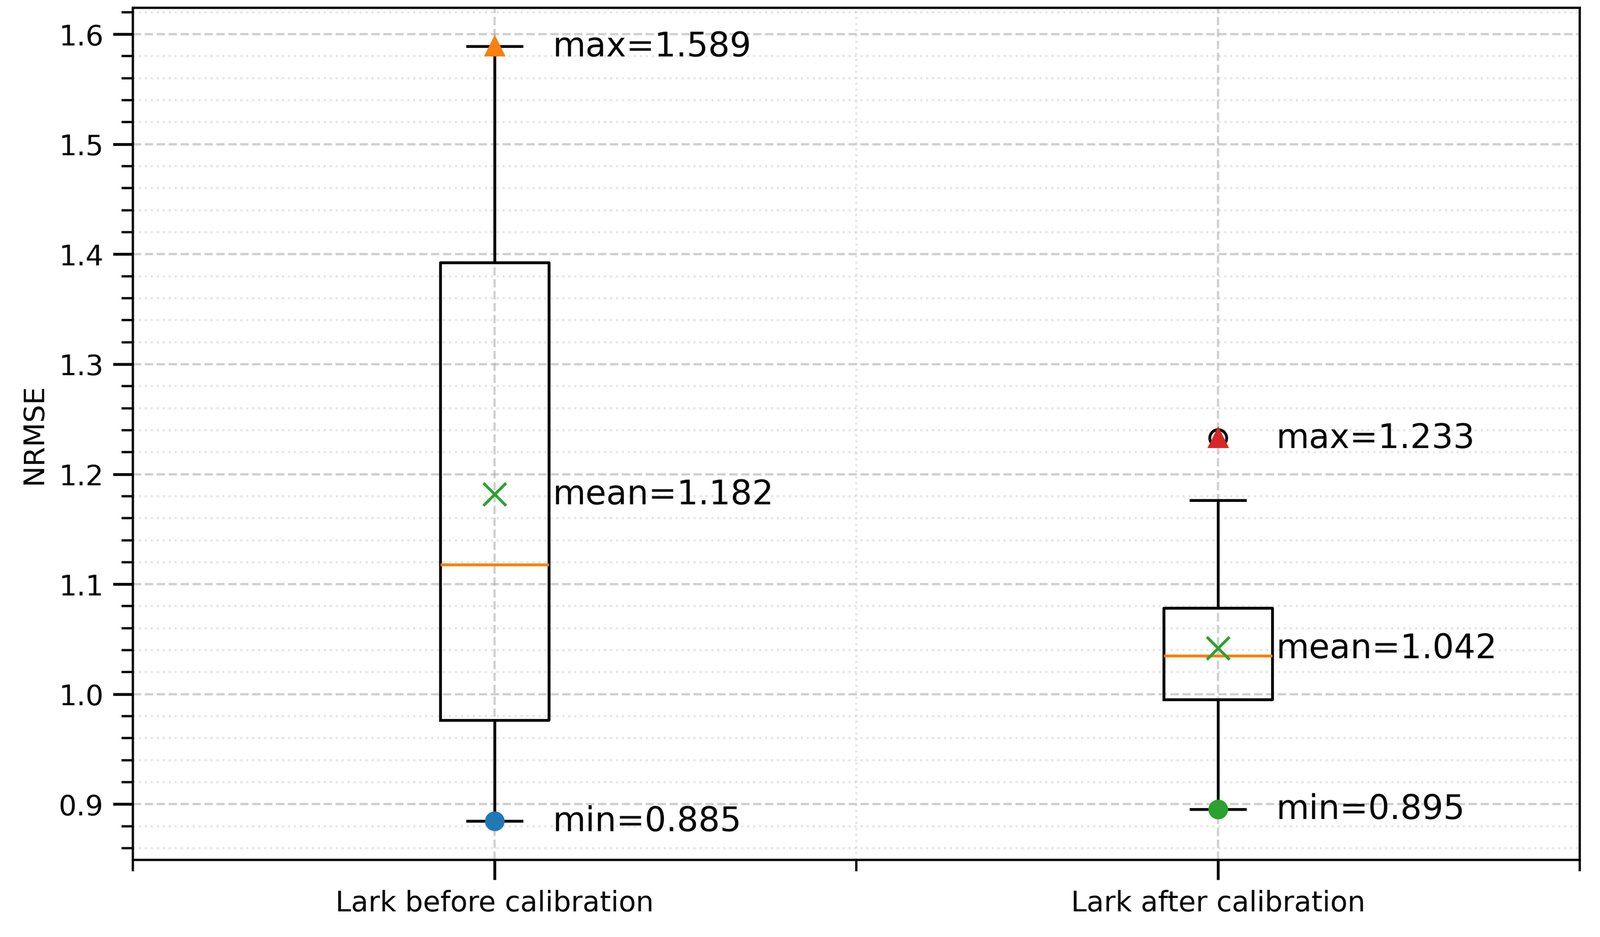
Fig. 9. NMRSE ranges relative to the prediction of the spectral irradiance in Lark before calibration and Lark after calibration.
3.2. Vertical illuminance
Figure 10 shows post-processing of the measured and simulated spectral irradiance data at each point produced vertical illuminance (Ev) distributions across five courts. The measured Ev ranged from approximately 316 to 657 lx, showing that the illumination level was relatively uniform within each court but varied slightly between courts, with Court 3 showing the highest values and Court 5 the lowest. In the initial simulation, Lark before calibration resulted in noticeably higher values (405~760 lx) across nearly all courts, showing an overall overestimation trend. After applying spectral calibration, the Lark results improved significantly, yielding Ev values closer to the measured data (316~653 lx) and a more consistent gradient between lower and upper points, indicating enhanced spatial correspondence after calibration.
Figure 10
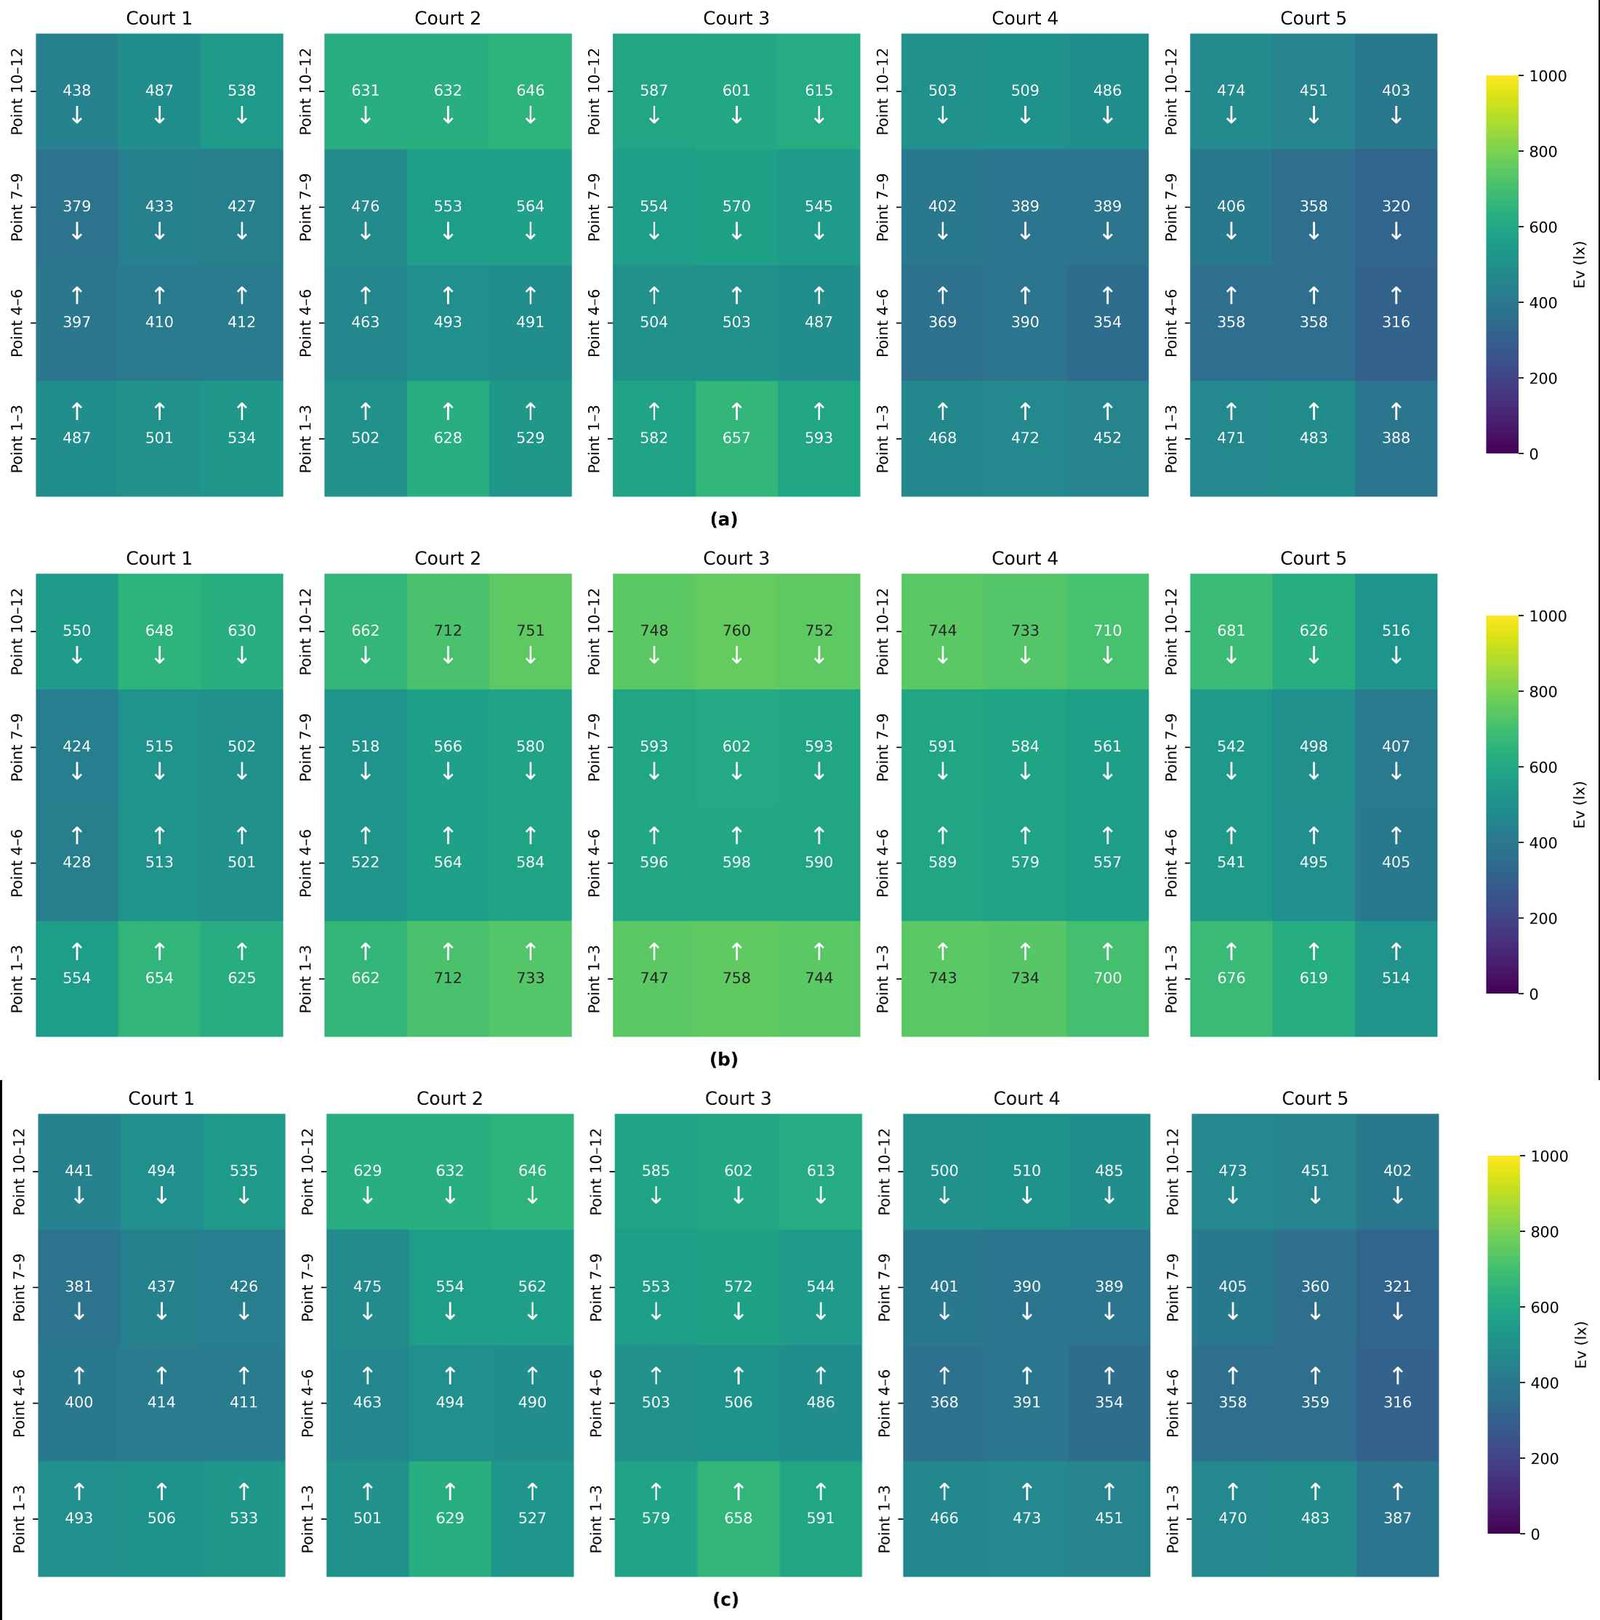
Fig. 10. Vertical illuminance contour map on each field for measurement (a), Lark before calibration (b), and Lark after calibration (c).
The comparison of PE between simulations and measurements highlights these performance differences, as shown in Figure 11. The Lark simulation before calibration showed a large positive deviation, with a mean PE of +28.1% (ranging from +2.4% to +59.6%), reflecting substantial overestimation. In contrast, the calibrated Lark model achieved near-perfect agreement with the measured data, with a mean PE of 0.0% and an extremely narrow error range (–0.4% to +1.5%). This result confirms that the calibration process effectively minimized simulation bias and improved the accuracy of vertical illuminance prediction derived from spectral irradiance simulations.
Figure 11
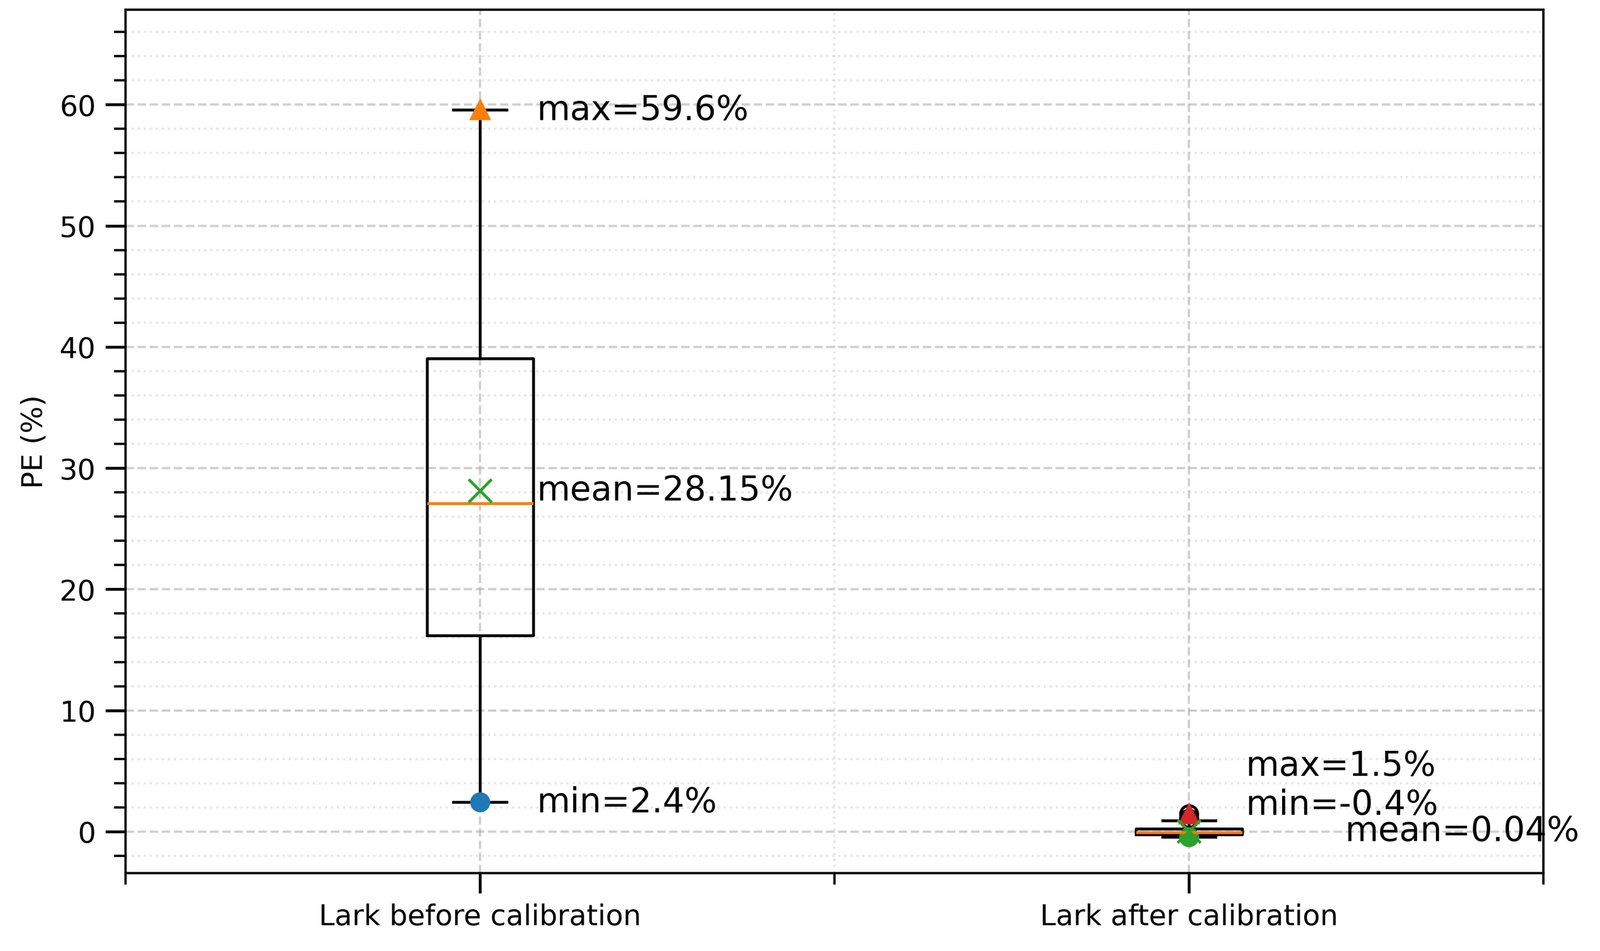
Fig. 11. Percentage error of mel-EDI for Lark before calibration and Lark after calibration.
3.3. Melanopic EDI
To obtain the mel-EDI, post-processing of the measured and simulated spectral irradiance data at each point was conducted using Equation (1), which applies the spectral melanopic action spectrum as a weighting function. The resulting mel-EDI distributions across five courts are shown in Fig. 12. The measured mel-EDI values ranged from 258 to 540 lx, showing a relatively uniform distribution within each court, with slightly higher values observed in Courts 2 and 3. In the initial simulation, Lark generated significantly higher mel-EDI values, between 486 and 822 lx, across all measurement points, clearly overestimating the measured results. After calibration, the Lark output demonstrated much closer agreement with the measurements, producing mel-EDI values between 329 and 630 lx and smoother variations between lower and upper regions, indicating that calibration improved the model’s representation of melanopic light distribution from electric lighting sources.
Figure 12
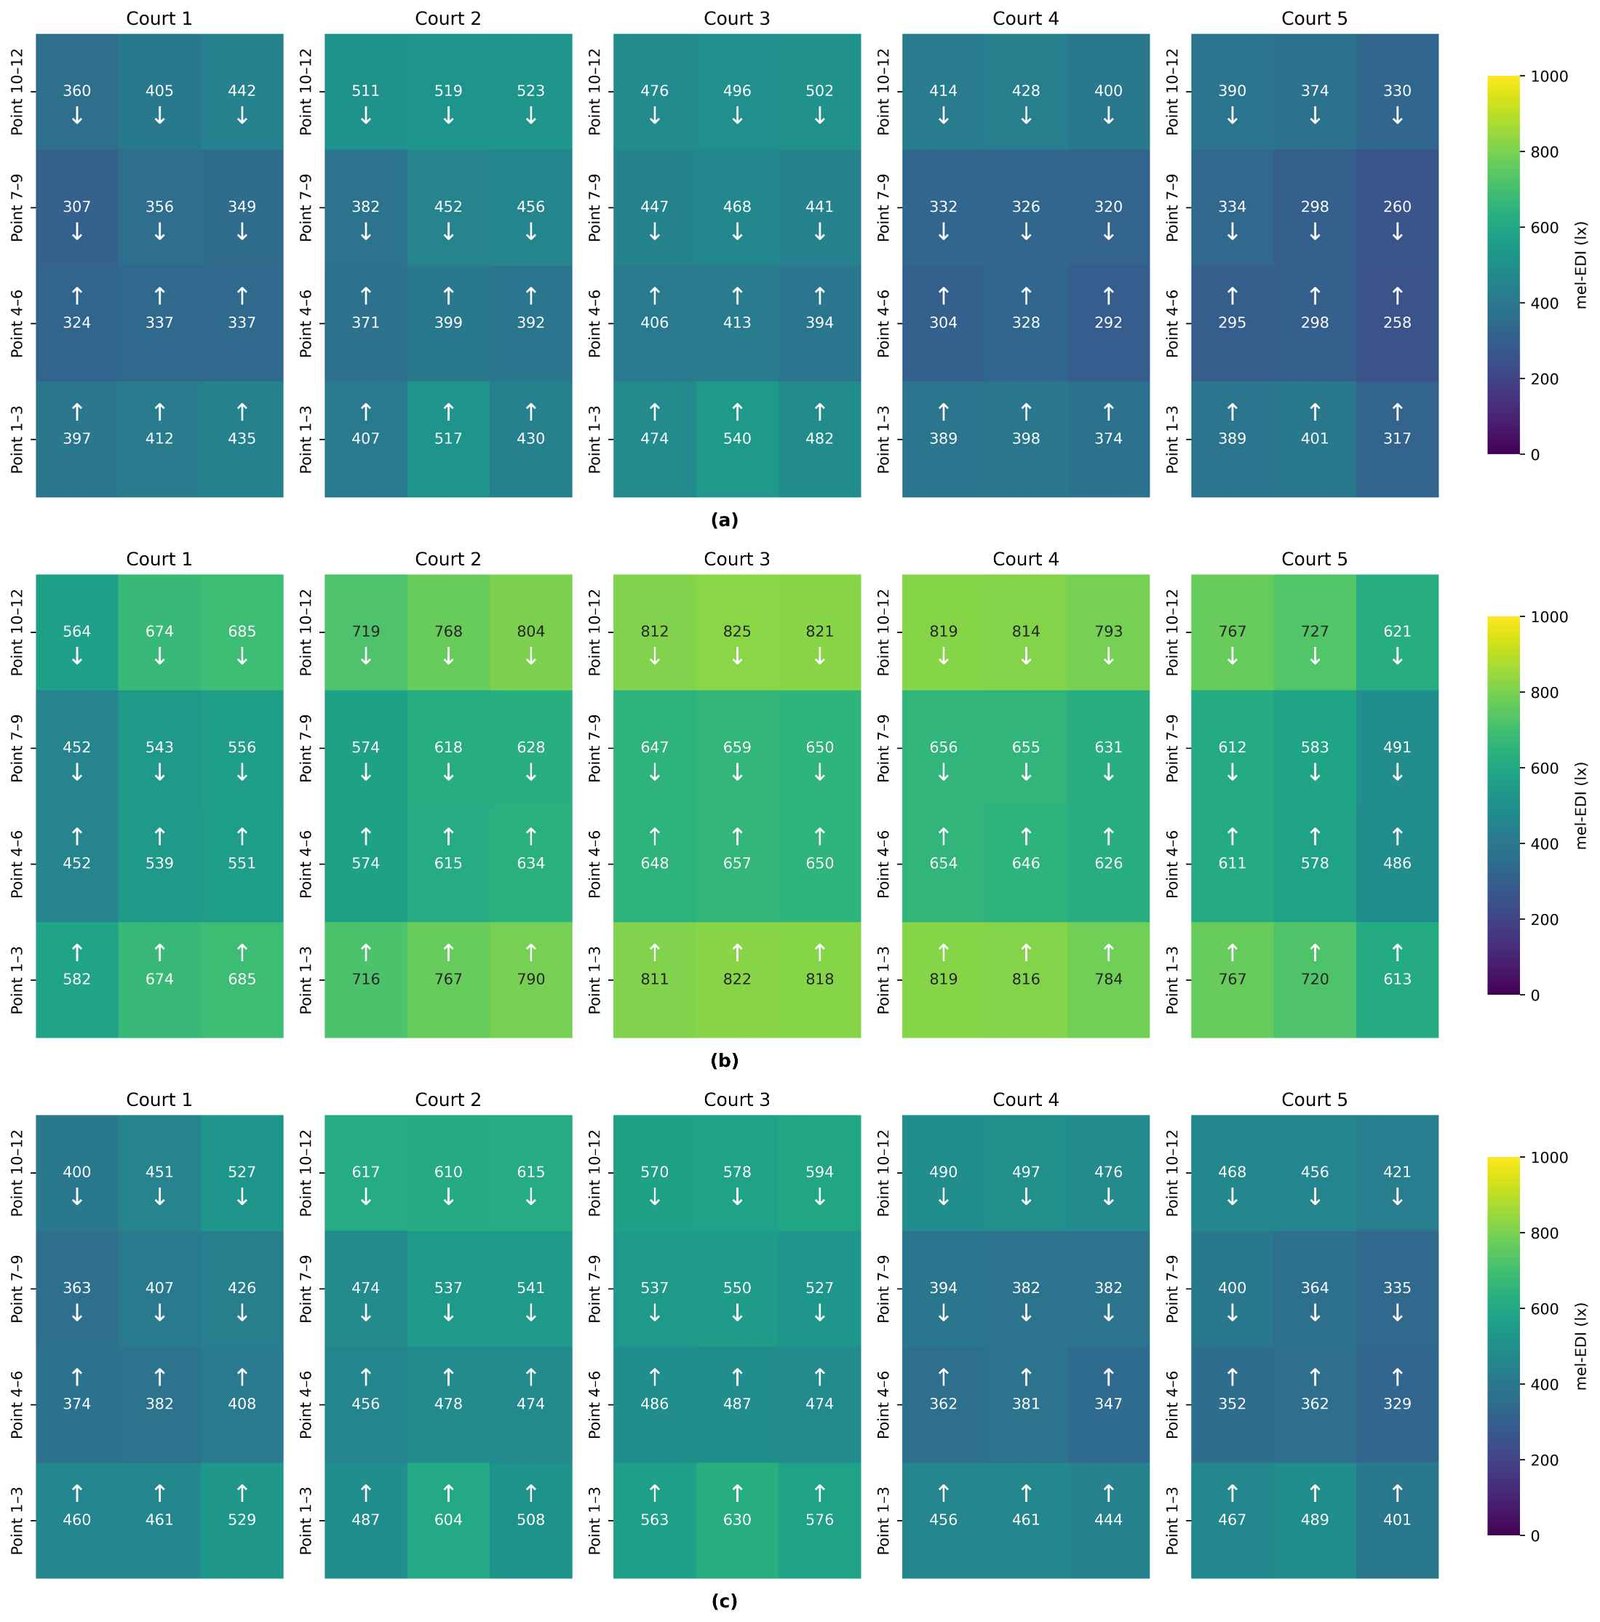
Fig. 12. mel-EDI contour map on each field for measurement (a), Lark before calibration (b), and Lark after calibration (c).
The PE comparison further illustrates the performance improvements achieved through calibration, as shown in Figure 13.
Figure 13
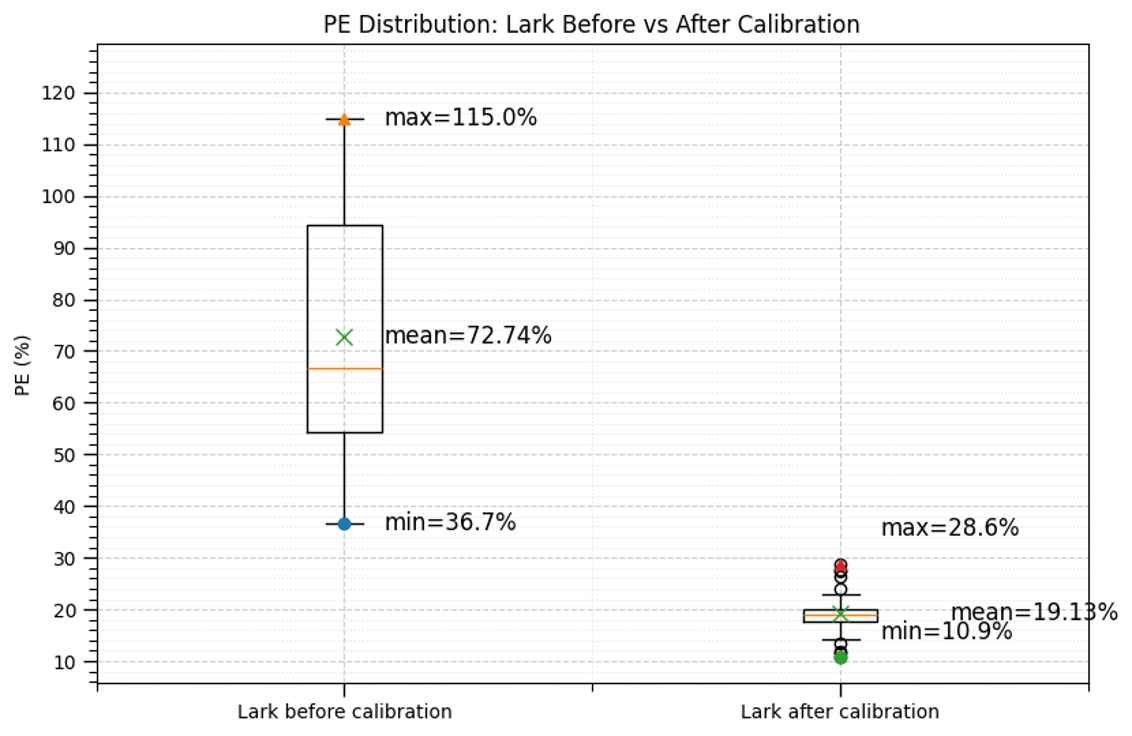
Fig. 13. Percentage error of mel-EDI for Lark before calibration and Lark after calibration.
The Lark simulation before calibration showed a substantially large positive bias, with a mean PE of +72.7% and a wide variation from +36.7% to +115.0%, signifying significant overestimation. After calibration, the Lark model achieved considerable improvement, with a reduced mean PE of +19.1% and a narrower range of +10.9% to +28.6%. These results demonstrate that the calibration process effectively minimized the spectral mismatch between simulated and measured irradiance, leading to a more accurate prediction of melanopic illuminance in multispectral lighting simulations.
3.4. Circadian stimulus
The resulting CSt,f distributions across five courts are shown in Fig. 14. The measured CSt,f values across the five courts ranged from 0.46 to 0.57, showing a consistent spatial pattern with slightly higher values observed at lower measurement points (Point 1~3) and lower values at the upper zones (Point 10~12). In comparison, the initial Lark simulation yielded CSt,f values ranging from 0.51 to 0.61. After calibration, the Lark results showed improved alignment with the measured data, producing smoother gradients and reduced discrepancies between upper and lower regions, with predicted CSt,f values in the range of 0.51 to 0.60.
The comparison of PE between the simulation and measurement further illustrates these differences, as shown in Fig. 15. The Lark simulation before calibration exhibited a mean error of –9.7%, with variation between –13.7% and –0.3%, suggesting a consistent deviation from the measured CSt,f. After calibration, the Lark model demonstrated improvement with a mean PE of +7.2%, ranging from –1.6% to +12.9%.
Figure 14
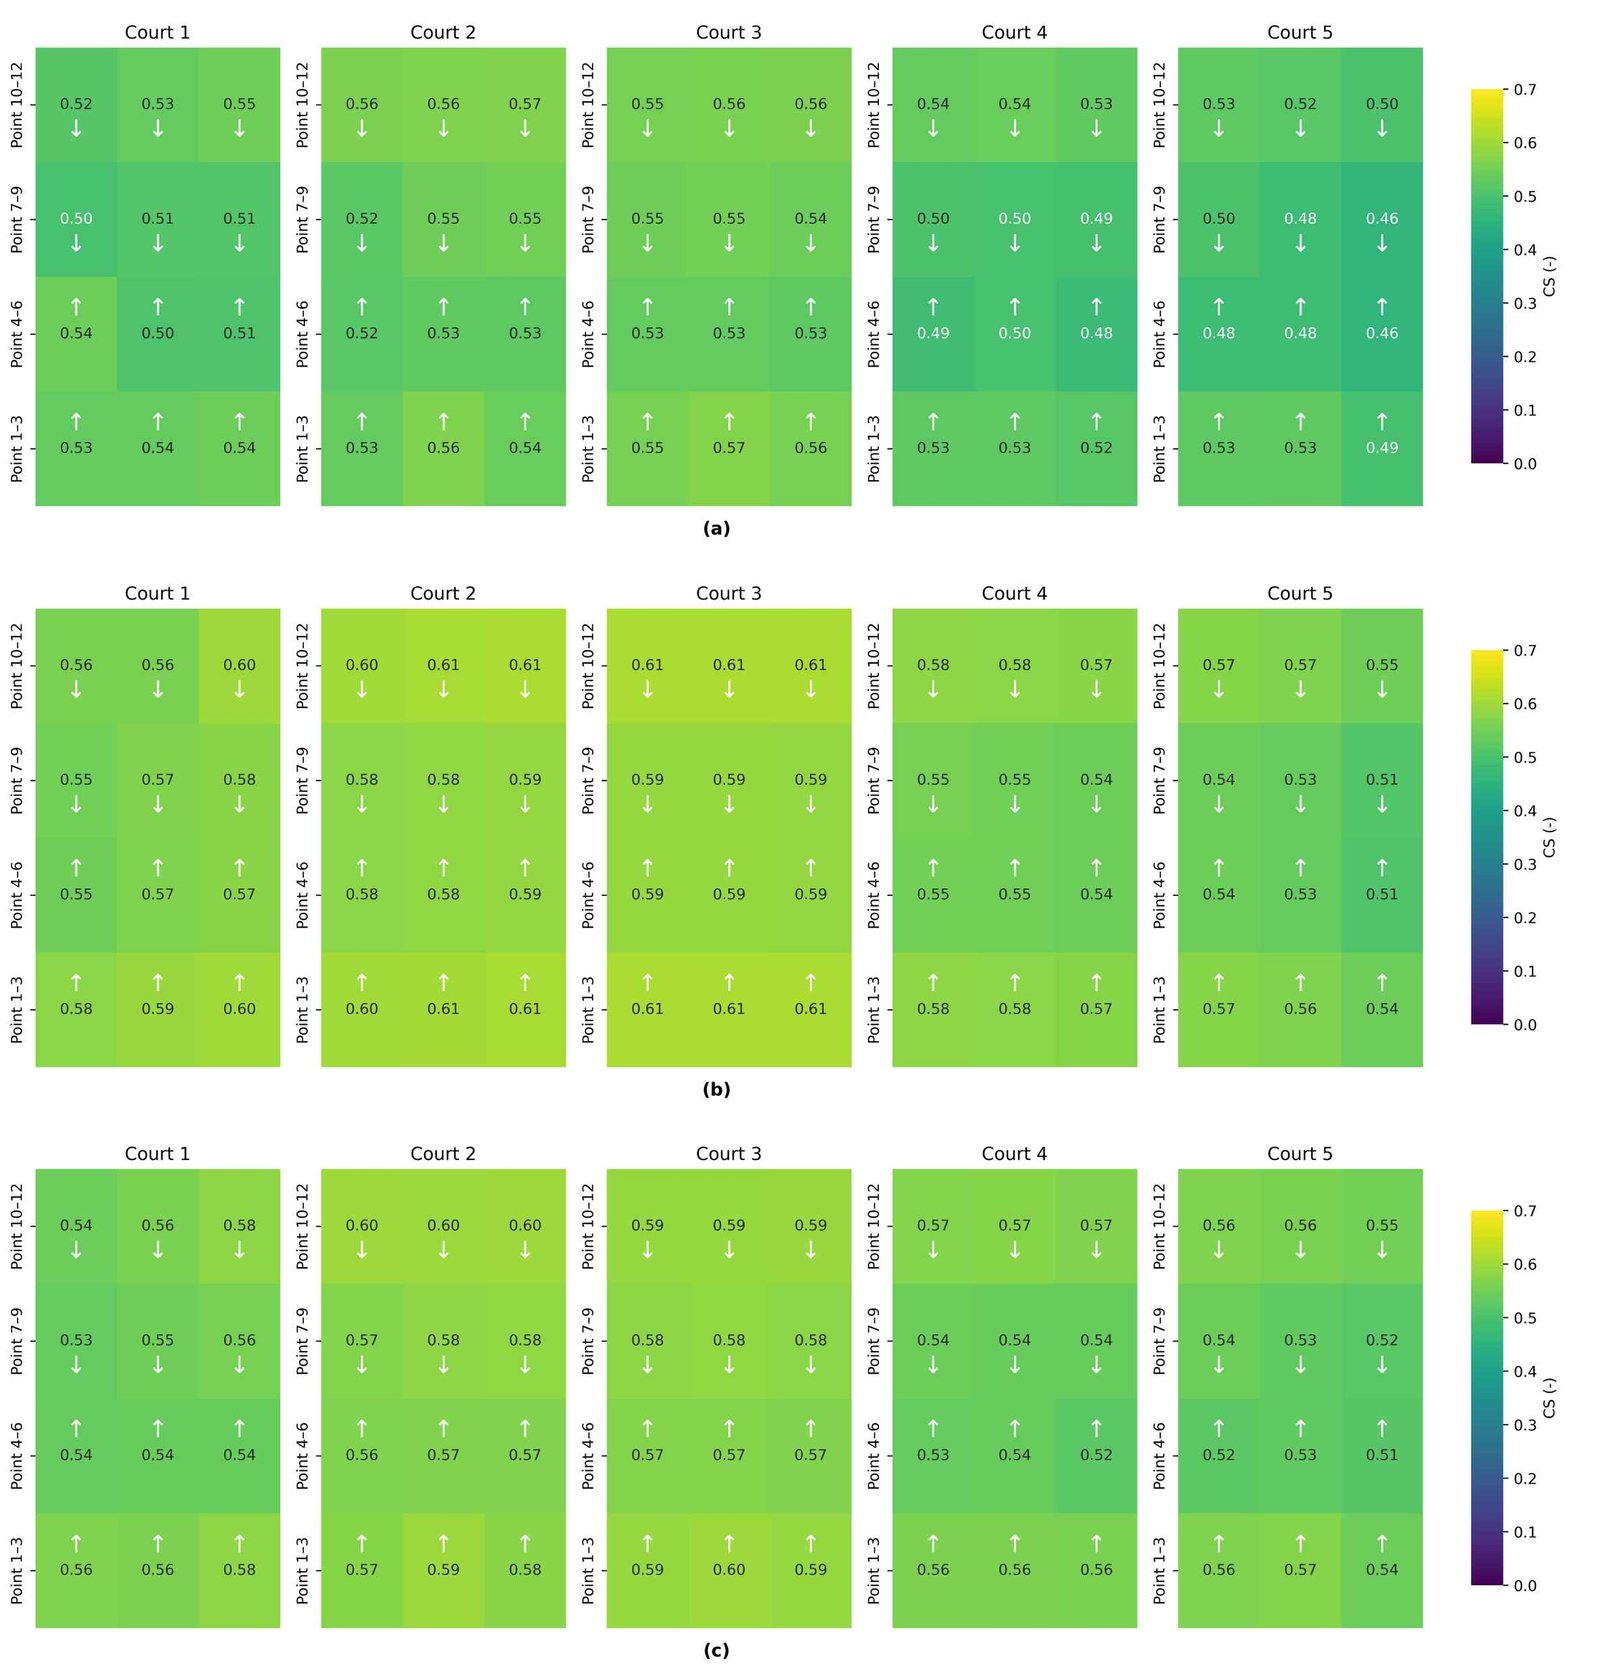
Fig. 14. CSt,f contour map on each field for measurement (a), Lark before calibration (b), and Lark after calibration (c).
Figure 15
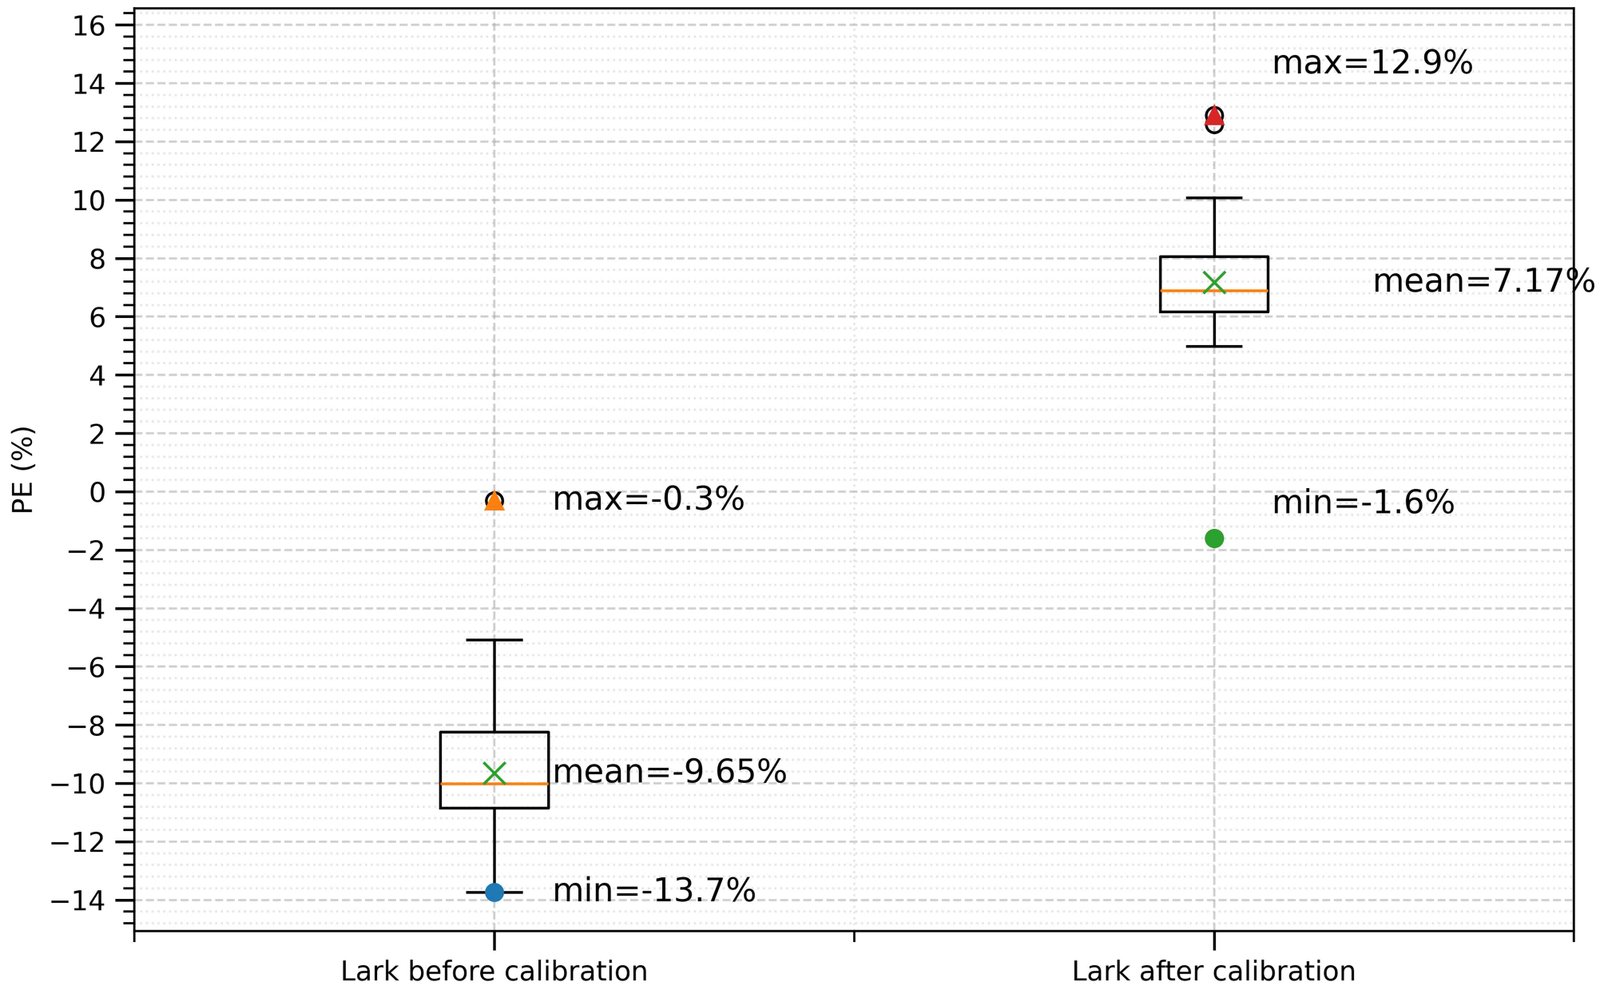
Fig. 15. Percentage error of CSt,f for Lark before calibration and Lark after calibration.
4. Discussion
4.1. Comparison of Field Measurements and Simulations
The calibration and validation processes in this study rely on the specific characteristics of the Lark tool, which serve as contextual boundaries that define the applicability of these findings. In the comparison between field measurement and initial simulation results, the spectral irradiance values of the Lark simulation display significant variations. While Lark simulations typically excel in daylighting scenarios [23,44,17], they generated substantially higher spectral irradiance values compared to the measured data in the sports hall building, leading to a notable discrepancy. This discrepancy highlights the challenge of accurately simulating LED-based lighting environments, particularly when using simulation tools that are primarily optimized for daylight simulation like Lark.
Although the SPD curve of the LED luminaires shows a dip near 480 nm, coinciding with the peak sensitivity of the melanopic action spectrum (smel(λ)), this does not necessarily result in a lower mel-ED compared to photopic lux. This is because mel-EDI is derived from the integration of spectral irradiance and the melanopic sensitivity function, as expressed in Equation (1).
Lark simulations using materials of various colors, white, black, yellow, and blue under a single light source with different CCTs produced similar results, where spectral irradiance above 630 nm was overestimated compared to measurements. This consistency across material colors confirms that the deviation is inherent to Lark’s spectral computation rather than surface reflectance [53].
We have also performed additional simulation with all materials in the geometry were replaced with uniform, white-colored material (ρ = 0.9).
The results are shown in Fig. 16, which indicates that discrepancy is not primarily caused by surface reflectance properties. The Lark simulation continues to exhibit excessive irradiance in longer wavelengths due to its limited spectral discretization, which divides the visible range into only nine broad channels. This coarse spectral resolution causes oversimplification and averaging within each wavelength band, particularly in the red and near-infrared regions, resulting in a flattened and exaggerated spectral tail compared to the measured data.
Figure 16
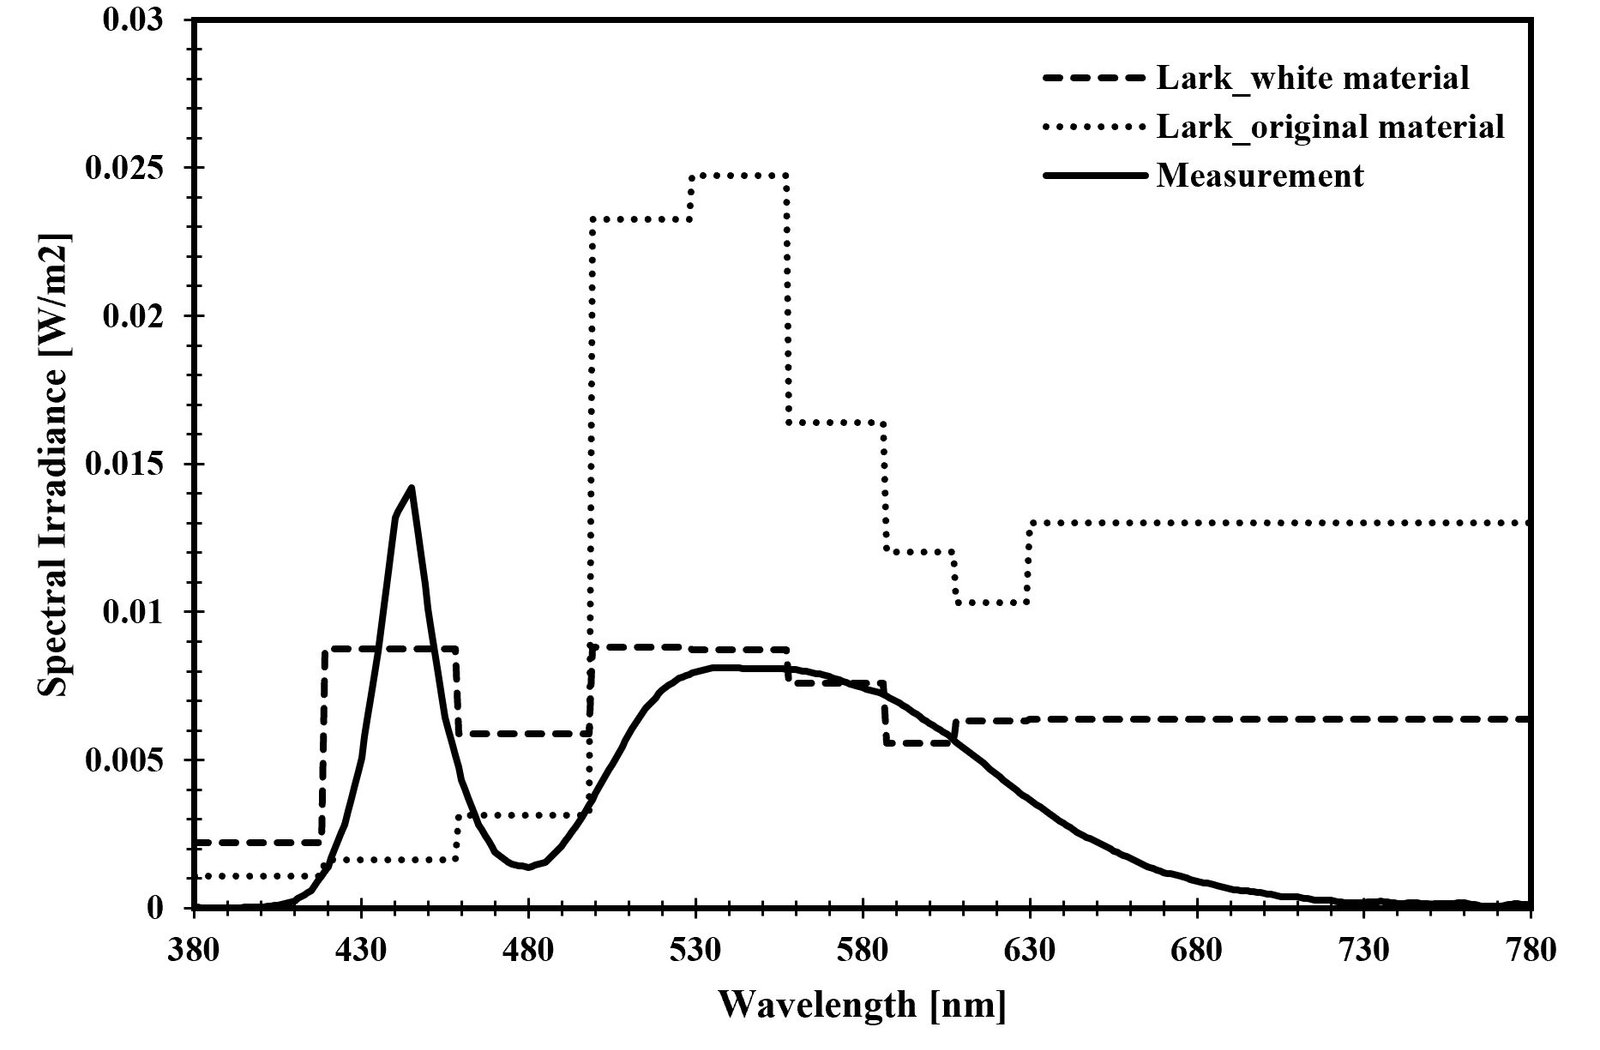
Fig. 16. Comparison of spectral irradiance in Lark with original material and white material.
The difference suggests that the overestimation observed in Lark arises not from material color uniformity but from intrinsic constraints in its spectral sampling and rendering algorithms. Therefore, calibration is required by adjusting Lark’s simulated spectral irradiance to match the measured data, ensuring that the high-wavelength regions are represented more accurately and that the overall spectral performance of the simulation aligns with real measurements.
This study also tested more "accurate" Radiance parameters especially for Lark, based on those used in [45], but the results remained unchanged. Therefore, we maintained the parameter configuration and version consistent with [39] which also utilized Lark v3, to ensure methodological consistency and reproducibility. The consistent overestimation suggests that the discrepancy arises from inherent limitations in Lark’s spectral sampling and rendering algorithms rather than from parameter settings.
In the case of Lark, the use of only nine broad spectral channels means that local spectral dips are averaged out, often overestimating the contribution of the 460–490 nm range, where melanopic sensitivity is high. Consequently, Lark may report mel-EDI values that exceed photopic illuminance, even when the SPD has a dip at the melanopic peak.
Previous studies have generally applied Lark in more controlled and simplified contexts compared to the current investigation. Ref. [23] validated the tool within office-like environments under both daylight and electric lighting, reporting vertical illuminance errors largely within ±17.5% and melanopic EDI discrepancies within ±20%. Similarly, ref. [65] utilized Lark in a simplified glazing experiment across varying sky conditions, achieving NRMSE values below 15%. In contrast, ref. [66] observed weaker spectral correlations in an empty classroom, with an average error of 32% across the full spectrum. Furthermore, ref. [44] demonstrated that the 9-channel method improved the Mean Absolute Percentage Error (MAPE) by 13.9% to 33.9% over conventional 3-channel simulations.
The technical basis for these variations was explored by ref. [39], who noted that Lark’s 9-channel approach approximates SPD by averaging energy values within broad wavelength bands. This was further evidenced by [53], compared Lark and ALFA in controlled electric-lighting test chambers. Their findings indicated that Lark was more efficient in selective-reflectance or absorptive scenarios (e.g., blue or black surfaces). However, these studies also highlighted that Lark could yield substantial percentage errors, exceeding 100% on dark interiors, depending heavily on surface reflectance and CCT.
While a significant architectural update to Lark’s spectral discretization would be the preferable long-term solution, the present tuning process should be understood as a diagnostic and transitional framework rather than as evidence that the tool is fully adequate in its current form. The purpose of this study was to evaluate the performance of a widely accessible multispectral tool in the under-studied context of high-ceiling sports halls under electric lighting. From this perspective, the calibration demonstrates that the bias associated with Lark’s current spectral architecture is systematic, measurable, and partially correctable through external adjustment, thereby offering immediate practical value until higher-resolution alternatives become standard.
Accordingly, the calibration performed in this study was not intended to artificially minimize simulation errors or to improve Lark’s performance in a way that would not be replicable in real-world design workflows. Rather, the purpose was diagnostic to examine whether the discrepancies observed in Lark’s spectral output were systematic and therefore potentially correctable. This is particularly relevant given Lark’s coarse spectral resolution of nine channels, which led to consistent overestimation in non-visual metrics under electric lighting. To ensure transparency, both pre-calibration and post-calibration results are reported in this study. The pre-calibration values represent the expected simulation errors when using Lark in its current state, while the post-calibration values demonstrate the extent to which systematic bias can be identified and potentially corrected. This approach allows for a more complete understanding of tool limitations and supports future improvements in simulation accuracy for electric lighting environments.
These previous findings help position the present study more clearly. Most earlier validations were conducted in offices, classrooms, or laboratory setups with relatively simple geometries and more controlled boundary conditions. In contrast, the present study evaluates Lark in a substantially more demanding context: a full-scale badminton sports hall under electric LED lighting, with high ceilings, strongly directional luminaires, peaked LED spectra, and 60 vertical measurement points distributed across five courts. Under these conditions, the discrepancy between measured and simulated spectral irradiance was considerably larger and more systematic than in previous validation studies. Therefore, a tuning process was necessary in the present study to reduce the systematic bias in Lark’s spectral output before deriving non-visual metrics. From this perspective, the contribution of the present work is not only to extend Lark validation to sports hall environments, but also to demonstrate that acceptable performance in office-based, classroom, or simplified laboratory settings cannot be assumed to transfer directly to large indoor sports facilities under electric lighting.
4.2. Analysis of circadian stimulus modelling and recommended exposure doses
The study also identified the potential of circadian-stimulus doses (CSd) modeling in optimizing lighting for athlete performance and recovery. CSd is identical to CSt,f, where CSd is postulated to be the effective ‘dose’ provided to the SCN by the phototransduction circuit in the retina at any time with or without melatonin suppression [67]. The graph in Fig. 17 shows the projected CSd values for various durations of up to 2 hours at the five courts based on UL 24480 standards [67]. These dose approaches are consistent with findings that exposure to daylight, particularly high-intensity light spectra rich in blue light with a minimum intensity of 250 melanopic lux, is essential for triggering significant alertness effects and optimizing human cognitive function [68,69].
Figure 17
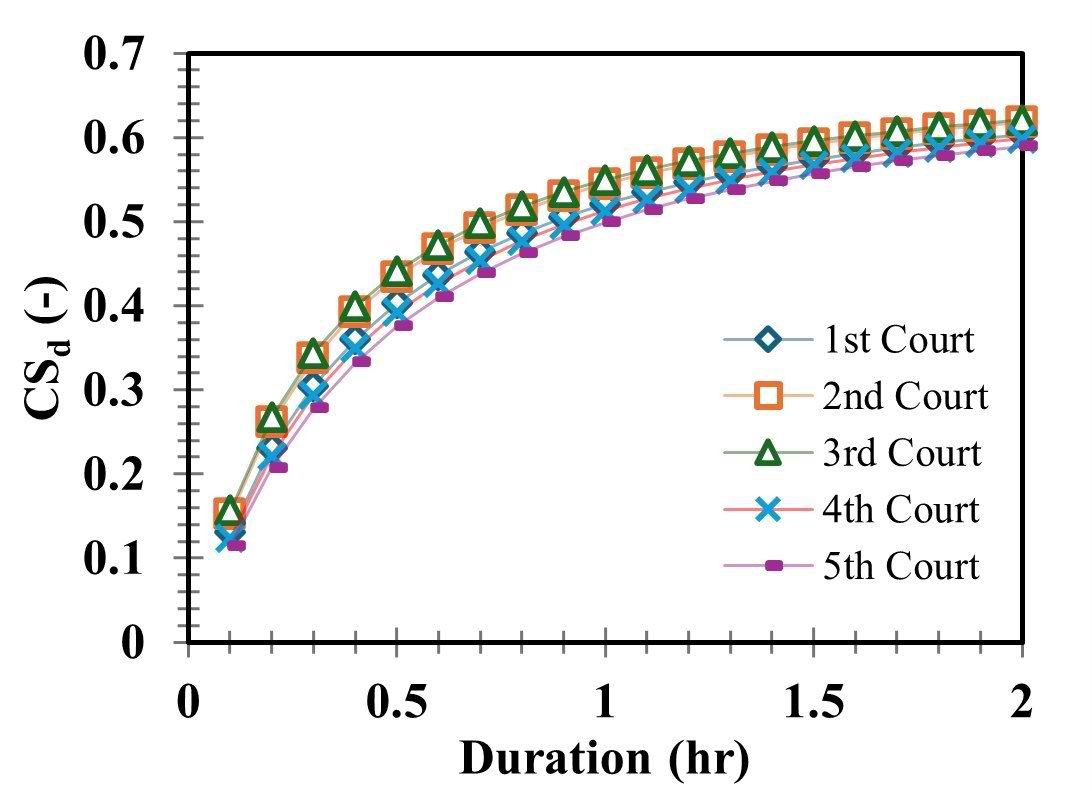
Fig. 17. Projected CSd values for various durations of light exposure in each court.
The data points for all courts closely follow logarithmic trends, which empirical models are listed in Table 5.
Table 5

Table 5. Logarithmic models for the relation between CS and duration t in each court.
As time progresses, the CSd value increases, reaching a steady level close to 0.6 after around 1.5 hours. The recommended duration to reach the circadian effective dose (CSd) of 0.43 is 1 hour, with vertical illuminance 377 lx [67]. At this study, the CSd values for all courts intersect the recommended level, indicating sufficient duration of light exposure to meet the recommended CSd for effective circadian stimulation. The graph suggests that spending at least 0.5-0.7 hours in these lighting conditions will likely achieve the recommended circadian stimulus across all courts. This interpretation is most relevant to the competitive-use scenario considered in this study. Since competitive badminton involves high-intensity intermittent activity and match durations of approximately 40 minutes to 1 hour, the 1-hour exposure adopted here serves as a practical reference condition for evaluating circadian-relevant lighting during competition or intensive training [57,70]. However, this simplification does not capture recreational use, repeated daily training, or age-specific usage patterns, which should be addressed in future studies.
4.3. Limitations and future works
This study focused on evaluating the performance of two multispectral simulation tools of Lark in predicting non-visual lighting metrics under electric lighting conditions in a controlled badminton sports hall. The validation was conducted based on the lighting configuration recommended for competitive badminton matches following BS EN 12193:2018 standards. While this approach ensures consistency and relevance to professional sports settings, it does not address lighting requirements for recreational or multi-purpose sports activities. Additionally, this study did not include long-term field investigations into the physiological or performance impacts of circadian-aligned lighting in athletes. Future research could explore broader building typologies, diverse lighting scenarios, and the implementation of tuneable LED systems to assess the scalability and robustness of multispectral simulations in supporting both visual and non-visual lighting design objectives.
The high agreement achieved after calibration in this study should not be interpreted as evidence that the present workflow is already fully predictive for new buildings without field data. The calibration factors (F) and lower-bound wavelength adjustments (λlo) identified here are currently specific to the tested combination of luminaire SPD, hall geometry, and interior surface reflectance. Their broader applicability must therefore be examined through additional case studies involving similar LED fixtures in different sports hall configurations. If recurring parameter patterns are identified, these may support the future development of a fixture-specific reference framework for more predictive multispectral simulation in practice.
In addition, the present validation was conducted using static vertical sensor points at 1.5 m in an unoccupied hall, which was intentionally defined as a controlled reference condition for baseline tool validation to minimize transient effects such as body shadowing, motion, and orientation changes. However, this setup does not capture the full temporal and directional variability of light exposure experienced by athletes during actual play. In real badminton activity, players move continuously across the court and frequently change their gaze direction, including significant upward viewing during serves, clears, and smashes. As demonstrated by [71], professional players specifically focus on kinematic cues from the opponent’s feet and racket to optimize motor response. Because these areas of interest span different vertical heights and angles, the actual spectral irradiance reaching the eye is likely more variable and complex than what a static horizontal sightline predicts. Future studies should therefore extend this framework to dynamic exposure assessment by incorporating athlete movement trajectories, time-varying viewing directions via eye-tracking data, and additional lighting scenarios, including recreational and multi-sport use.
Despite these limitations, the proposed method can be implemented by designers or practitioners focusing on health, well-being, and performance of the building occupants in specific lighting scenarios. Several related studies have explored ways to improve simulation accuracy through validation and calibration methods. For instance, [46] demonstrated that adjusting input parameters in office lighting simulations can yield high accuracy, with melanopic-to-photopic (M/P) ratios showing a mean bias error (MBErel) of less than 4% and a root mean square error (RMSErel) below 7%. In a follow-up study, [72] employed panoramic high dynamic range imaging (HDRI) and showed that nearly 90% of simulated lighting values had an absolute error below 20%, as visualized using a 360° residual map.
Additionally, [64] proposed a calibration procedure based on one-time field measurements in a large sunlit office space. Their method resulted in relative RMSE values of 25.8% for horizontal and 45.5% for vertical illuminance, using a dataset of 540 offices to validate annual daylight and electric lighting simulations.
These results highlight the increasing applicability of sophisticated calibration methods to improve the lighting simulation tools' predicted accuracy in a variety of interior settings. By combining these approaches, professionals may provide more consistent results that complement customized lighting plans and guarantee the best possible visual and non-visual impacts for a range of occupant requirements. Future studies on this topic can be directed toward expanding and applying the adaptive simulation process aimed at optimizing lighting for various special lighting scenarios.
Future research should explore the long-term effects of circadian-aligned lighting on athletic performance and well-being through field studies, thereby mapping in daily profiles of lighting systems that align with athletes' circadian profiles. Extending the adaptive simulation process to cover a range of indoor environments and specific lighting scenarios will enhance the applicability of these findings. Addressing these challenges will enable dynamic lighting systems to further optimize sports environments and support human-centered design principles across a wide range of applications.
5. Conclusion
This study has demonstrated the process of calibrating and validating a multispectral lighting simulation tool, namely Lark, in predicting the non-visual effects of light in the context of a badminton sports hall building with 80 installed LED luminaires. Based on the field measurements, the mel-EDI at each of the five badminton courts met the minimum recommended value of 250 lx. Simulation results of visual and non-visual metrics in Lark have been compared with the direct measurements. Regarding spectral irradiance patterns, Lark initially produced NRMSE values ranging from 0.885 to 1.589 with an average of 1.182. To address this, calibration was conducted using a random number function adjusted to accurately represent the direct measurement results. A total of 15,000 random scenarios were simulated to obtain the smallest PE. Following calibration, the NRMSE result for Lark showed improvement, ranging from 0.895 to 1.233 with an average of 1.042.
The results for vertical illuminance in Lark before calibration showed PE ranging from 2.4% to 59.6%, with an average of 28.1%. After calibration, this was significantly reduced to a range of –0.4% to 1.5%, with an average of 0%. For mel-EDI, Lark before calibration exhibited a wide error range, from 36.7% to 115.0% (average 72.7%), whereas after calibration, the PE was reduced to a range of –10.9% to 28.6% (average 19.1%). Additionally, for CS prediction, Lark before calibration had a PE range from –13.7% to –0.3% (average –9.7%), while after calibration, the PE improved to a range of –1.6% to 12.9% (average 7.2%).
Overall, this study highlights the importance of incorporating accurate simulation inputs and framework, in the approach to improve sports hall lighting design. While multispectral simulation tools can be effective for non-visual lighting prediction, their application in sports environments can benefit from context-specific customization of the light sources and their installation onsite. The calibration methodology applied in this study enables Lark to simulate the circadian effective lighting design and its non-visual effects with greater precision, supporting the performance and health of badminton athletes.
Funding
This research received no external funding.
Author Contributions
Tiara Nurhuda: Conceptualization, Methodology, Formal analysis, Data curation, Visualization, Writing - original draft. Rizki A. Mangkuto: Conceptualization, Methodology, Supervision, Project administration, Writing - review and editing. Joko Sarwono: Supervision, Methodology, Writing - review and editing. Gontar Amin: Validation, Investigation, Resources, Writing - review and editing. Wenye Hu: Writing - review and editing, Supervision. Ozgur Gocer: Writing - review and editing, Supervision. Arianna Brambilla: Writing - review and editing, Supervision.
Declaration of competing interest
The authors declare no conflicts of interest.
References
- Vetter, Céline, P. Morgan Pattison, Kevin Houser, Michael Herf, Andrew JK Phillips, Kenneth P. Wright, Debra J. Skene, George C. Brainard, Diane B. Boivin, and Gena Glickman, A review of human physiological responses to light: implications for the development of integrative lighting solutions, Leukos, 18:3 (2022) 387-414. https://doi.org/10.1080/15502724.2021.1872383
- S. L. Chellappa, R. Steiner, P. Blattner, P. Oelhafen, T. Götz, and C, Cajochen, Non-visual effects of light on melatonin, alertness and cognitive performance: can blue-enriched light keep us alert?, PloS One, 6:1 (2011) e16429. https://doi.org/10.1371/journal.pone.0016429
- H. J. Bailes and R. J. Lucas, Human melanopsin forms a pigment maximally sensitive to blue light (λ max≈ 479 nm) supporting activation of Gq/11 and Gi/o signalling cascades, Proceedings of the Royal Society B: Biological Sciences, 280:1759 (2013) 20122987. https://doi.org/10.1098/rspb.2012.2987
- G. Tosini, I. Ferguson, and K. Tsubota, Effects of blue light on the circadian system and eye physiology, Molecular Vision, 22 (2016) 61-72. https://doi.org/10.63500/mv_v22_61
- C. Cajochen, M. Munch, S. Kobialka, K. Krauchi, R. Steiner, P. Oelhafen, S. Orgul, and A. Wirz-Justiceet, High sensitivity of human melatonin, alertness, thermoregulation, and heart rate to short wavelength light, The Journal of Clinical Endocrinology & Metabolism, 90:3 (2005) 1311-1316. https://doi.org/10.1210/jc.2004-0957
- C. Cajochen, O. Stefani, I. Schöllhorn, D. Lang, and S. L. Chellappa, Influence of evening light exposure on polysomnographically assessed night-time sleep: A systematic review with meta-analysis, Lighting Research & Technology, 54:6 (2022) 609-624. https://doi.org/10.1177/14771535221078765
- L. J. M. Schlangen and L. L. A. Price, Measuring and using light in the melanopsin age, Trends in Neurosciences, 37:1 (2014) 1-9. https://doi.org/10.1016/j.tins.2013.10.004
- M. Spitschan, O. Stefani, P. Blattner, C. Gronfier, S. W. Lockley, and R. J. Lucas, How to report light exposure in human chronobiology and sleep research experiments, Clocks & Sleep, 1:3 (2019) 280-289. https://doi.org/10.3390/clockssleep1030024
- L. J. M. Schlangen and L. L. A. Price, Measuring and using light in the melanopsin age, Trends in Neurosciences, 37:1 (2014) 1-9. https://doi.org/10.1016/j.tins.2013.10.004
- M. S. Rea, M. G. Figueiro, A. Bierman, and J. D. Bullough, Circadian light, Journal of circadian rhythms, 8:1 (2010) p.2. https://doi.org/10.1186/1740-3391-8-2
- M. S. Rea, R. Nagare, and M. G. Figueiro, Modeling circadian phototransduction: Quantitative predictions of psychophysical data, Frontiers in Neuroscience 15 (2021) 615322. https://doi.org/10.3389/fnins.2021.615322
- M. S. Rea, CS Calculator (2.0), Light and Health Research Centre, 2026 [Online] https://cscalc.light-health.org/
- A. de Vries, J. L. Souman, B. de Ruyter, I. Heynderickx, and Y. A. W. de Kort, Lighting up the office: The effect of wall luminance on room appraisal, office workers' performance, and subjective alertness, Building and Environment, 142 (2018) 534-543. https://doi.org/10.1016/j.buildenv.2018.06.046
- M. Danell, S. Hartmeyer, L. Petterson, R. Davis, M. Andersen, and S. Rockcastle, The impact of light distribution and furniture layout on meeting light exposure objectives in an office-A simulation case study, in Proceedings for the 17th International Conference of the International Building Performance Simulation Association, 2021 pp. 2626-2633. https://doi.org/10.26868/25222708.2021.30624
- M. G. Figueiro, B. Steverson, J. Heerwagen, R. Yucel, C. Roohan, L. Sahin, K. Kampschroer, and M. S. Rea, Light, entrainment and alertness: A case study in offices, Lighting Research & Technology, 52:6 (2020) 736-750. https://doi.org/10.1177/1477153519885157
- L. Bellia, A. Pedace, and G. Barbato, Daylighting offices: A first step toward an analysis of photobiological effects for design practice purposes, Building and Environment, 74 (2014) 54-64. https://doi.org/10.1016/j.buildenv.2013.12.021
- A. Tabbah, P. Johansson, and M. B. C. Aries, Evaluating Visual and Beyond-Vision Light Effects and Energy Consumption for Luminous and Temporal Light Factors: A Single Office Case, Journal of Daylighting, 12:2 (2025) 306-342. https://doi.org/10.15627/jd.2025.21
- L. Bellia, F. Fragliasso, M. Seraceni, and G. Sodano, Integrative lighting design: how to optimize visual and non-visual effects in a cell office, Journal of Daylighting, 10:2 (2023)192-203. https://doi.org/10.15627/jd.2023.16
- S. Pradhan, A. Parganiha, C. D. Agashe, and A. K. Pati, Circadian rhythm in sportspersons and athletic performance: a mini review. Chronobiology International, 41:2 (2024) 137-181. https://doi.org/10.1080/07420528.2024.2305663
- M. Gkaintatzi-Masouti, J. van Duijnhoven, and M. P. J. Aarts, Simulations of non-image-forming effects of light in building design: A literature review, Lighting Research & Technology, 55:7-8 (2023) 669-689. https://doi.org/10.1177/14771535221142812
- BSI, BS EN 12193:2007: Sports Facility Lighting, (2007), London, UK.
- R. A. Mangkuto, F. Rahmaniah, N. H. Tasya, and D. Pinasthika, Analisis Sensitivitas dan Optimisasi Sistem Pencahayaan Elektrik pada Gedung Olahraga Bulu Tangkis, Jurnal Nasional Teknik Elektro dan Teknologi Informasi, 8.3 (2019): 299-307. https://doi.org/10.22146/jnteti.v8i3.526
- C. Pierson, M.P.J. Aarts, and M. Andersen, Validation of spectral simulation tools in the context of ipRGC-influenced light responses of building occupants, Journal of Building Performance Simulation, 16:2 (2023)179-197. https://doi.org/10.1080/19401493.2022.2125582
- J.P. Salis, A. Suresh, and K. R. Shailesh, Lighting design of an indoor sports facility-a case study, in Proceedings for The Second International Conference on Advanced Computational and Communication Paradigms (ICACCP), IEEE, 2019. https://doi.org/10.1109/ICACCP.2019.8882940
- M. Turrin, D. Yang, A. D'Aquilio, R. Sileryte, and Y. Sun, Computational design for sport buildings, Procedia engineering 147 (2016) 878-883. https://doi.org/10.1016/j.proeng.2016.06.285
- D. Eggleston, L. G. Hawkins, and S. T. Fife, As the lights fade: a grounded theory of male professional athletes' decision-making and transition to retirement, Journal of Applied Sport Psychology, 32:5 (2020) 495-512. https://doi.org/10.1080/10413200.2019.1626514
- K. Raphael, J. Schäfer, A. Rossmeissl, C. Klenk, H. Hanssen, C. Höchsmann, C. Cajochen, and A. S. Trucksäss, Prime time light exposures do not seem to improve maximal physical performance in male elite athletes, but enhance end-spurt performance, Frontiers in Physiology 8 (2017): 264. https://doi.org/10.3389/fphys.2017.00264
- S. Forbes-Robertson, E. Dudley, P. Vadgama, C. Cook, S. Drawer, and L. Kilduff, Circadian disruption and remedial interventions: effects and interventions for jet lag for athletic peak performance, Sports Medicine 42:3 (2012) 185-208. https://doi.org/10.2165/11596850-000000000-00000
- E. Thun, B. Bjorvatn, E. Flo, A. Harris, and S. Pallesen, Sleep, circadian rhythms, and athletic performance, Sleep Medicine Reviews, 23 (2015) 1-9. https://doi.org/10.1016/j.smrv.2014.11.003
- T. Reilly, The body clock and athletic performance, Biological Rhythm Research, 40:1 (2009) 37-44. https://doi.org/10.1080/09291010802067015
- B. Drust, J. Waterhouse, G. Atkinson, B. Edwards, and T. Reilly, Circadian rhythms in sports performance-an update, Chronobiology International, 22:1 (2005) 21-44. https://doi.org/10.1081/CBI-200041039
- B. Vitosevic, The circadian clock and human athletic performance, Bulletin of Natural Sciences Research 7:1 (2017): 1-7. https://doi.org/10.5937/univtho7-13650
- J. C. Blanca-Torres, E. Ortega, P. T. Nikolaidis, and G. Torres-Luque, Bibliometric analysis of scientific production in badminton, Journal of Human Sport and Exercise, 15:2 (2020) 267-282. https://doi.org/10.14198/jhse.2020.152.03
- W. Shi, J. H. K. Lai, C. K. Chau, P. Wong, and D. Edwards, Analytic evaluation of facilities performance from the user perspective: Case study on a badminton hall, Facilities, 39:13-14 (2021) 888-910. https://doi.org/10.1108/F-10-2020-0119
- X. Ding, L. Wang, and C. Wu, The Comfort Analysis Model Design of the Ground Light Environment of a Dome Reflective Badminton Court in a University, Scientific Programming, 2022:1 (2022) 2334108. https://doi.org/10.1155/2022/2334108
- M. Subekti, I. A. Rahardjo, and R. A. Kurniawan, Evaluation of The Pasar Rebo Sport Building Lighting Systems, Journal of Physics: Conference Series, 1737:1 (2021) 012007. https://doi.org/10.1088/1742-6596/1737/1/012007
- P. M. Bradley, Sports hall lighting: Badminton players' attitudes, Lighting Research & Technology, 24:4 (1992) 227-233. https://doi.org/10.1177/096032719202400406
- M. Inanici, M. Brennan, and E. Clark, Spectral daylighting simulations: Computing circadian light, In: Proceedings of BS2015: 14th Conference of International Building Performance Simulation Association, Hyderabad, India, pp. 1245-1252.
- B. Jung, et al., Multispectral lighting simulation approaches for predicting opsin-driven metrics and their application in a neonatal intensive care unit, In: Proceedings of the IBPSA Conference, Shanghai, China, Sept 4-6, 2023, pp. 393-401. https://doi.org/10.26868/25222708.2023.1446
- J. Alstan Jakubiec and Athina Alight, Spectral and biological simulation methods for the design of healthy circadian lighting, In: Proceedings of the 17th IBPSA Conference, Bruges, Belgium, Sept 1-3, 2021, pp. 1711-1718. https://doi.org/10.26868/25222708.2021.30535
- S. Safranek, and R.G. Davis, Assessing the accuracy of emerging lighting simulation tools: Predicting spectral power distribution and illuminance, In: Proceedings of the IES 2022 Annual Conference, LA, USA, August 18-20, 2022, pp.2-11. Available at: https://www.energy.gov/sites/default/files/2023-01/ssl-safranek-davis-ies2022-lighting-simulation-tools.pdf.
- Solemma, ALFA (Adaptive Lighting for Alertness) , Accessed: Jan. 18, 2024. [Online]. Available: ALFA (Adaptive Lighting for Alertness).
- M. Inanici, M. Brennan, and E. Clark, Spectral daylighting simulations: Computing circadian light. In: Proceedings of BS2015: 14th Conference of International Building Performance Simulation Association, Hyderabad, India, 2015, pp. 1245-1252. https://doi.org/10.26868/25222708.2015.2467
- M. Alwalidi, A. Ganji Kheybari, S. Subramaniam, and S. Hoffmann, Development of a multichannel spectral simulation tool and experimental validation with different lighting scenarios, Lighting Research & Technology, 56:4 (2024) 366-380. https://doi.org/10.1177/14771535231172084
- C. Pierson, M. Gkaintatzi-Masouti, M. P. J. Aarts, and M. Andersen, Validation of spectral simulation tools for the prediction of indoor electric light exposure. In: Proceedings of the Conference CIE, Vienna, Austria, Sept 27-29, 2021, pp. 52-62. https://doi.org/10.25039/x48.2021.OP05
- S. He, H. Li, Y. Yan, and H. Cai, Calibrating lighting simulation with panoramic high dynamic range imaging, Journal of Building Performance Simulation ,17:1 (2024) 74-93. https://doi.org/10.1080/19401493.2023.2242306
- C. E. Ochoa, M. B. C. Aries, and J. L. M. Hensen, State of the art in lighting simulation for building science: a literature review, Journal of Building Performance Simulation, 5:4 (2012) 209-233. https://doi.org/10.1080/19401493.2011.558211
- C. F. Reinhart and M. Andersen, Development and validation of a Radiance model for a translucent panel, Energy and buildings, 38:7 (2006) 890-904. https://doi.org/10.1016/j.enbuild.2006.03.006
- N. Azmi Muslimin, N. N. Mansor, H. Mokhlis, M. Noor Abdullah and S. Pil Ramli, Lighting System Optimization, Components, and Simulation Tools for Building Installations: A Review, in IEEE Access, vol. 13, pp. 160508-160535, 2025. https://doi.org/10.1109/ACCESS.2025.3578983
- N. Altenberg Vaz and M. Inanici, Syncing with the sky: daylight-driven circadian lighting design, Leukos, 17:3 (2021) 291-309. https://doi.org/10.1080/15502724.2020.1785310
- D. Geisler-Moroder, Estimating melatonin suppression and photosynthesis activity in real-world scenes from computer generated images, In: Proceedings of Conference on Colour in Graphics, Imaging, and Vision, vol. 5, pp. 346-352, Society of Imaging Science and Technology, 2010. https://doi.org/10.2352/CGIV.2010.5.1.art00055
- V. R. M. Lo Verso, L. Giovannini, L. Valetti, and A. Pellegrino, Integrative lighting in classrooms: preliminary results from simulations and field measurements, Buildings, 13:9 (2023) 2128. https://doi.org/10.3390/buildings13092128
- T. Nurhuda, G. Amin, R. A. Mangkuto, and J. Sarwono, Validation of Melanopic Equivalent Daylight Illuminance in a Test Chamber: Comparison of Selected Spectral Simulation Tools in Various Lighting Scenarios. In: Proceedings of ASim Conference 2024: 5th Asia Conference of IBPSA, Osaka, Japan, December 8-11 2024, pp. 865-872. https://doi.org/10.69357/asim2024.1215
- C. Pierson, M. Gkaintatzi-Masouti, M. P. J. Aarts, and M. Andersen, Validation of spectral simulation tools for the prediction of indoor electric light exposure. In: Proceedings of the Conference CIE, 2021, pp. 52-62. https://doi.org/10.25039/x48.2021.OP05
- X. Zhang, L. M. J. Chen, J. Fu, J. Wang, Y. Wang, M. Zhu, M. Yu, and D. Chen, A theoretical model for evaluation of non-visual effects of lighting based on human performance: Comprehensive research ideas, Displays, 88 (2025): 103038. https://doi.org/10.1016/j.displa.2025.103038
- K. H. Kim and G. Kim, Using simulation-based modeling to evaluate light trespass in the design stage of sports facilities, Sustainability, 13:9 (2021) 4725. https://doi.org/10.3390/su13094725
- M. Phomsoupha, and G. Laffaye, The science of badminton: game characteristics, anthropometry, physiology, visual fitness and biomechanics, Sports Medicine, 45:4 (2015) 473-495. https://doi.org/10.1007/s40279-014-0287-2
- T. M. Brown et al., Recommendations for daytime, evening, and nighttime indoor light exposure to best support physiology, sleep, and wakefulness in healthy adults, PLoS Biology, 20:3 (2022) e3001571. https://doi.org/10.1371/journal.pbio.3001571
- A.S. Prayag, R.P. Najjar, and C. Gronfier, Melatonin suppression is exquisitely sensitive to light and primarily driven by melanopsin in humans, Journal of Pineal Research, 66:4 (2019) e12562. https://doi.org/10.1111/jpi.12562
- C. Nowozin et al., Applying melanopic lux to measure biological light effects on melatonin suppression and subjective sleepiness, Current Alzheimer Research, 14:10 (2017) 1042-1052. https://doi.org/10.2174/1567205014666170523094526
- T. M. Brown, Melanopic illuminance defines the magnitude of human circadian light responses under a wide range of conditions, Journal of Pineal Research, 69:1 (2020): e12655. https://doi.org/10.1111/jpi.12655
- G. Ward, Radiance, Accessed: Sep. 02, 2024. [Online]. Available: https://radiance-online.org
- K. Negendahl, Building performance simulation in the early design stage: An introduction to integrated dynamic models, Automation in Construction, 54 (2015) 39-53. https://doi.org/10.1016/j.autcon.2015.03.002
- G. Quek and J. A. Jakubiec, Calibration and validation of climate-based daylighting models based on one-time field measurements: Office buildings in the tropics, Leukos, 17:1 (2021) 75-90. https://doi.org/10.1080/15502724.2019.1570852
- M. Nazari, B. Matusiak, and O. Stefani, Utilising spectral lighting simulation technique for evaluating transmitted daylight through glazing: Exploring the non-visual effects and colour appearance, Heliyon 9:10 (2023). https://doi.org/10.1016/j.heliyon.2023.e20436
- T. Kristiansen, T. Thiis, I. Burud, and A. J. Petersen, S pectral Dynamics and Spatial Variations in Indoor Daylight Quality: A Case Study, In: Proceedings of International Association of Building Physics, Singapore: Springer Nature Singapore, 2024, pp. 298-303. https://doi.org/10.1007/978-981-97-8317-5_44
- M. S. Rea, The law of reciprocity holds (more or less) for circadian-effective lighting, Lighting Research & Technology, 54:8 (2022) 748-760. https://doi.org/10.1177/14771535211061871
- M. Alwalidi and S. Hoffmann, Alerting effect of light: a review of daytime studies, Journal of Daylighting, 9:2 (2022)150-163. https://doi.org/10.15627/jd.2022.12
- K. C. H. J. Smolders and Y. A. W. de Kort, Bright light and mental fatigue: Effects on alertness, vitality, performance and physiological arousal, Journal of Environmental Psychology, 39 (2014) 77-91. https://doi.org/10.1016/j.jenvp.2013.12.010
- S. Pradhan, et al., Circadian rhythm in sportspersons and athletic performance: a mini review, Chronobiology International, 41: 2 (2024) 137-181. https://doi.org/10.1080/07420528.2024.2305663
- N.S. Uppara, A.A. Mavalankar, and K. Vemuri, Eye tracking in naturalistic badminton play: comparing visual gaze pattern strategy in world-rank and amateur player, In: Proceedings of the 7th Workshop on Pervasive Eye Tracking and Mobile Eye-Based Interaction, 2018, pp.1-7. https://doi.org/10.1145/3208031.3208037
- S. He, H. Li, Y. Yan, and H. Cai, Calibrating lighting simulation with panoramic high dynamic range imaging, Journal of Building Performance Simulation, 17:1 (2024) 74-93. https://doi.org/10.1080/19401493.2023.2242306
Disclaimer/Publisher’s Note: The statements, opinions and data contained in all publications are solely those of the individual author(s) and contributor(s) and not of Solarlits and/or the editor(s). Solarlits and/or the editor(s) disclaim responsibility for any injury to people or property resulting from any ideas, methods, instructions or products referred to in the content.
 Get PDF (6.36 MB)
877
Total views
Citations
SHARE ON


