Article | 5 October 2026
Volume 13 Issue 2 pp. 598-623 • doi: 10.15627/jd.2026.33
Optimizing Daylighting and Energy Performance through Lightwell Placement with Façade Modifications in a Tropical Public Library
Md Sarowar Jahan Apu,* Md Ashikur Rahman Joarder
Author affiliations
Department of Architecture, Bangladesh University of Engineering and Technology (BUET), Dhaka, Bangladesh
*Corresponding author.
sarowar.apu@arch.buet.ac.bd (M. S. J. Apu)
ashikjoarder@arch.buet.ac.bd (M. A. R. Joarder)
History: Received 30 March 2026 | Revised 29 July 2026 | Accepted 3 August 2026 | Published online 5 October 2026
Copyright: © 2026 The Author(s). Licensee Solarlits Limited (Hong Kong). This is an open access article distributed under the terms and conditions of the Creative Commons Attribution 4.0 License.
Citation: Md Sarowar Jahan Apu, Md Ashikur Rahman Joarder, Optimizing Daylighting and Energy Performance through Lightwell Placement with Façade Modifications in a Tropical Public Library, Journal of Daylighting, 13:2 (2026) 598-623. doi: 10.15627/jd.2026.33
Figures and tables
Abstract
Public libraries with deep floor plans in tropical climates often face simultaneous daylight insufficiency far from the windows and glare risk near the windows, resulting in a high dependence on artificial lighting. This study evaluates diagonal lightwell placement (in the library plan layout) and façade modifications, including high-window and light shelf configurations, to improve daylight performance at a tropical public library, i.e., the Bangladesh National Library in Dhaka. Field measurements provided a point-in-time illumination check of the daylight model. Climate-based daylight simulations and comparative energy use intensity (EUI) analyses were conducted to assess daylight availability and implications for relative energy performance. After the addition of optimized high windows and light shelves, façade modifications increased spatial daylight autonomy (sDA300/50%) from 49.12% to 58.03% for the Base Case with 45° angled lightwell placement, which was identified as the best placement among the studied options in the library plan layout. The accompanying increase in annual sunlight exposure (ASE1000,250h) and glare-related performance indicated that further refinement was required to improve visual comfort. The comparative energy analysis showed that EUI decreased from 81.63 to 63.92 kWh/(m²·y) for the optimized modified case, representing a 21.70% reduction relative to the Base Case. These findings could be treated as scenario-based simulation outcomes and potential contributions toward net-zero energy readiness.
Keywords
daylight optimization, energy assessment, façade design, light shelf, lightwell, passive design strategies
Nomenclature
| sDA300/50% | Spatial daylight autonomy: percentage of the analyzed floor area receiving at least 300 lux for at least 50% of the occupied hours |
| ASE1000,250h | Annual sunlight exposure: percentage of the analyzed floor area receiving more than 1000 lux of direct sunlight for more than 250 occupied hours per year |
| UDI | Useful daylight illuminance |
| UDIa | Useful daylight illuminance within the acceptable range |
| DGP | Daylight glare probability |
| sDG | Spatial disturbing glare: percentage of evaluated views experiencing disturbing or intolerable glare for the specified portion of occupied hours |
| EUI | Energy use intensity, expressed in kWh/(m²·y) |
| MOO | Multi-objective optimization |
| QV | Quality of view |
| PPD | Predicted percentage of dissatisfied |
| WWR | Window-to-wall ratio |
| SHGC | Solar heat gain coefficient |
| PV | Photovoltaic |
| NMBE | Normalized mean bias error |
| RMSE | Root mean square error |
| CV(RMSE) | Coefficient of variation of the root mean square error |
| MAPE | Mean absolute percentage error |
| RMSLE | Root mean squared logarithmic error |
| HW_S | High window scaling |
| LS_D | Light shelf depth |
| LS_A | Light shelf angle |
1. Introduction
Public libraries need a stable and comfortable daylight environment. Reading and studying involve long periods of visual tasks. These activities require effective light with no glare and a good balance between natural and artificial lighting [1,2]. In hot and humid tropical areas, such as Dhaka, daylighting is not only about increasing indoor light levels; too much sunlight or poor control of sunlight can increase glare. Ineffective daylighting can also create uneven lighting distribution inside the space and raise cooling energy demand due to exposed façades [3,4]. These challenges become more noticeable in deep-plan reading halls. As a result, electric lighting is often needed during most of the occupied hours [5,6]. Daylight optimization in tropical public libraries should be treated as an integrated performance issue that evaluates daylight sufficiency, excessive sunlight control, glare reduction and passive daylight design strategies such as light shelves, lightwells and anidolic systems [6,7].
Daylight has long been recognized as a fundamental design element in architecture, contributing simultaneously to visual comfort, spatial quality and energy reduction. In libraries, daylight not only improves the reading environment but also enhances users’ psychological well-being and sense of place [8]. Empirical research confirms that daylight integration can significantly reduce reliance on artificial lighting, with studies reporting up to 30% improvements in energy efficiency when natural lighting strategies are combined with intelligent management systems [9]. Optimal daylighting also supports circadian regulation, reduces fatigue and improves cognitive performance [10,11]. Conversely, inadequate lighting conditions have been linked to eye strain, headaches, stress and reduced productivity [12-14].
In tropical daylighting design, simply increasing façade openings is often not effective. Increasing daylight can also increase direct solar penetration, glare risk and cooling energy demand if solar heat gain is not appropriately controlled [3,6]. Passive strategies should not only admit daylight but also control and redirect daylight within the space. High-level windows admit light at steeper angles, light shelves block lower-angle direct sunlight and reflect daylight toward the ceiling, and light wells carry daylight into deeper interior areas with limited façade access [5,7]. Recent optimization studies showed that parameters, such as window configuration, shelf depth, shelf angle, orientation and surface reflectance should be analyzed as interacting design variables because these parameters affect daylight levels, visual comfort, thermal comfort and energy consumption [5,15,16]. Tropical daylight optimization should use climate-based annual metrics, such as useful daylight illuminance (UDI), spatial daylight autonomy (sDA), and annual sunlight exposure (ASE), which could assess useful daylight and excessive solar exposure during occupied hours [17,18].
For tropical regions such as Dhaka, the challenge of daylight integration is compounded by climatic extremes. While solar radiation is abundant, its uncontrolled entry often leads to excessive glare, thermal discomfort and uneven illumination across reading spaces. Studies emphasize that effective daylighting strategies in such climates must simultaneously address visual comfort, energy savings and thermal balance [19]. Viriezky, Candra and Amardeep [20] demonstrated that combining passive devices, such as light shelves with active dimming systems, reduced lighting energy use without increasing cooling loads, highlighting their value in hot-humid conditions. In Dhaka, Rubel and Joarder [4] reported that optimized egg-crate shading (1.0 m depth) achieved superior daylight and thermal performance in west-facing offices, underscoring the importance of context-specific solutions.
Building on previous studies, daylight redirection and energy performance optimization have been widely explored. This is especially true for light shelves and deep-plan tropical spaces [5,6]. This research examines how diagonal lightwell placement (in the library plan layout) and façade modifications with high windows and light shelf configurations can improve daylight performance in a tropical deep-plan library. The study aims to increase useful daylight, control excessive sunlight, and reduce comparative energy use intensity (EUI).
1.1. Background
Architectural research has demonstrated the effectiveness of two key strategies: void geometry, involving vertical openings or wells; and façade geometry, involving windows and shading devices. Void strategies, particularly light wells, can channel daylight vertically into core spaces that cannot access façades directly. Studies on well geometry show that optimized depth, width and reflectance significantly improve daylight availability in adjoining spaces [24]. Façade systems such as light shelves and high windows can redirect daylight deeper into rooms, improve sDA, and reduce glare near façades [9,21]. Innovations such as width-adjustable and photovoltaic-integrated light shelves have further improved efficiency, enabling up to 38% energy savings compared to static devices [22]. Specific research on libraries reinforces the potential of light shelves. Joarder [25] investigated the performance of light shelves in Bangladesh and demonstrated their capacity to improve daylight penetration in reading rooms under local climatic conditions. More recently, Ahsan [26] and Ferdous [27] evaluated adjustable light shelves in Dhaka’s classrooms and libraries, confirming their effectiveness in maintaining uniform illuminance across different sky conditions. High windows, by elevating the sill height, admit daylight at steeper angles and enhance penetration into deeper zones [23]. Advanced versions, such as anidolic ceiling systems, have been shown to increase daylight autonomy in tropical office spaces by more than 60% while reducing EUI [6].
Previous research on deep-plan tropical buildings also supports the importance of daylight-distribution strategies for improving luminous conditions and reducing artificial-lighting demand [28]. These studies also highlight limitations, including increased design complexity, potential glare at certain angles and the need for optimization based on specific room dimensions and orientations (Table 1).
Table 1
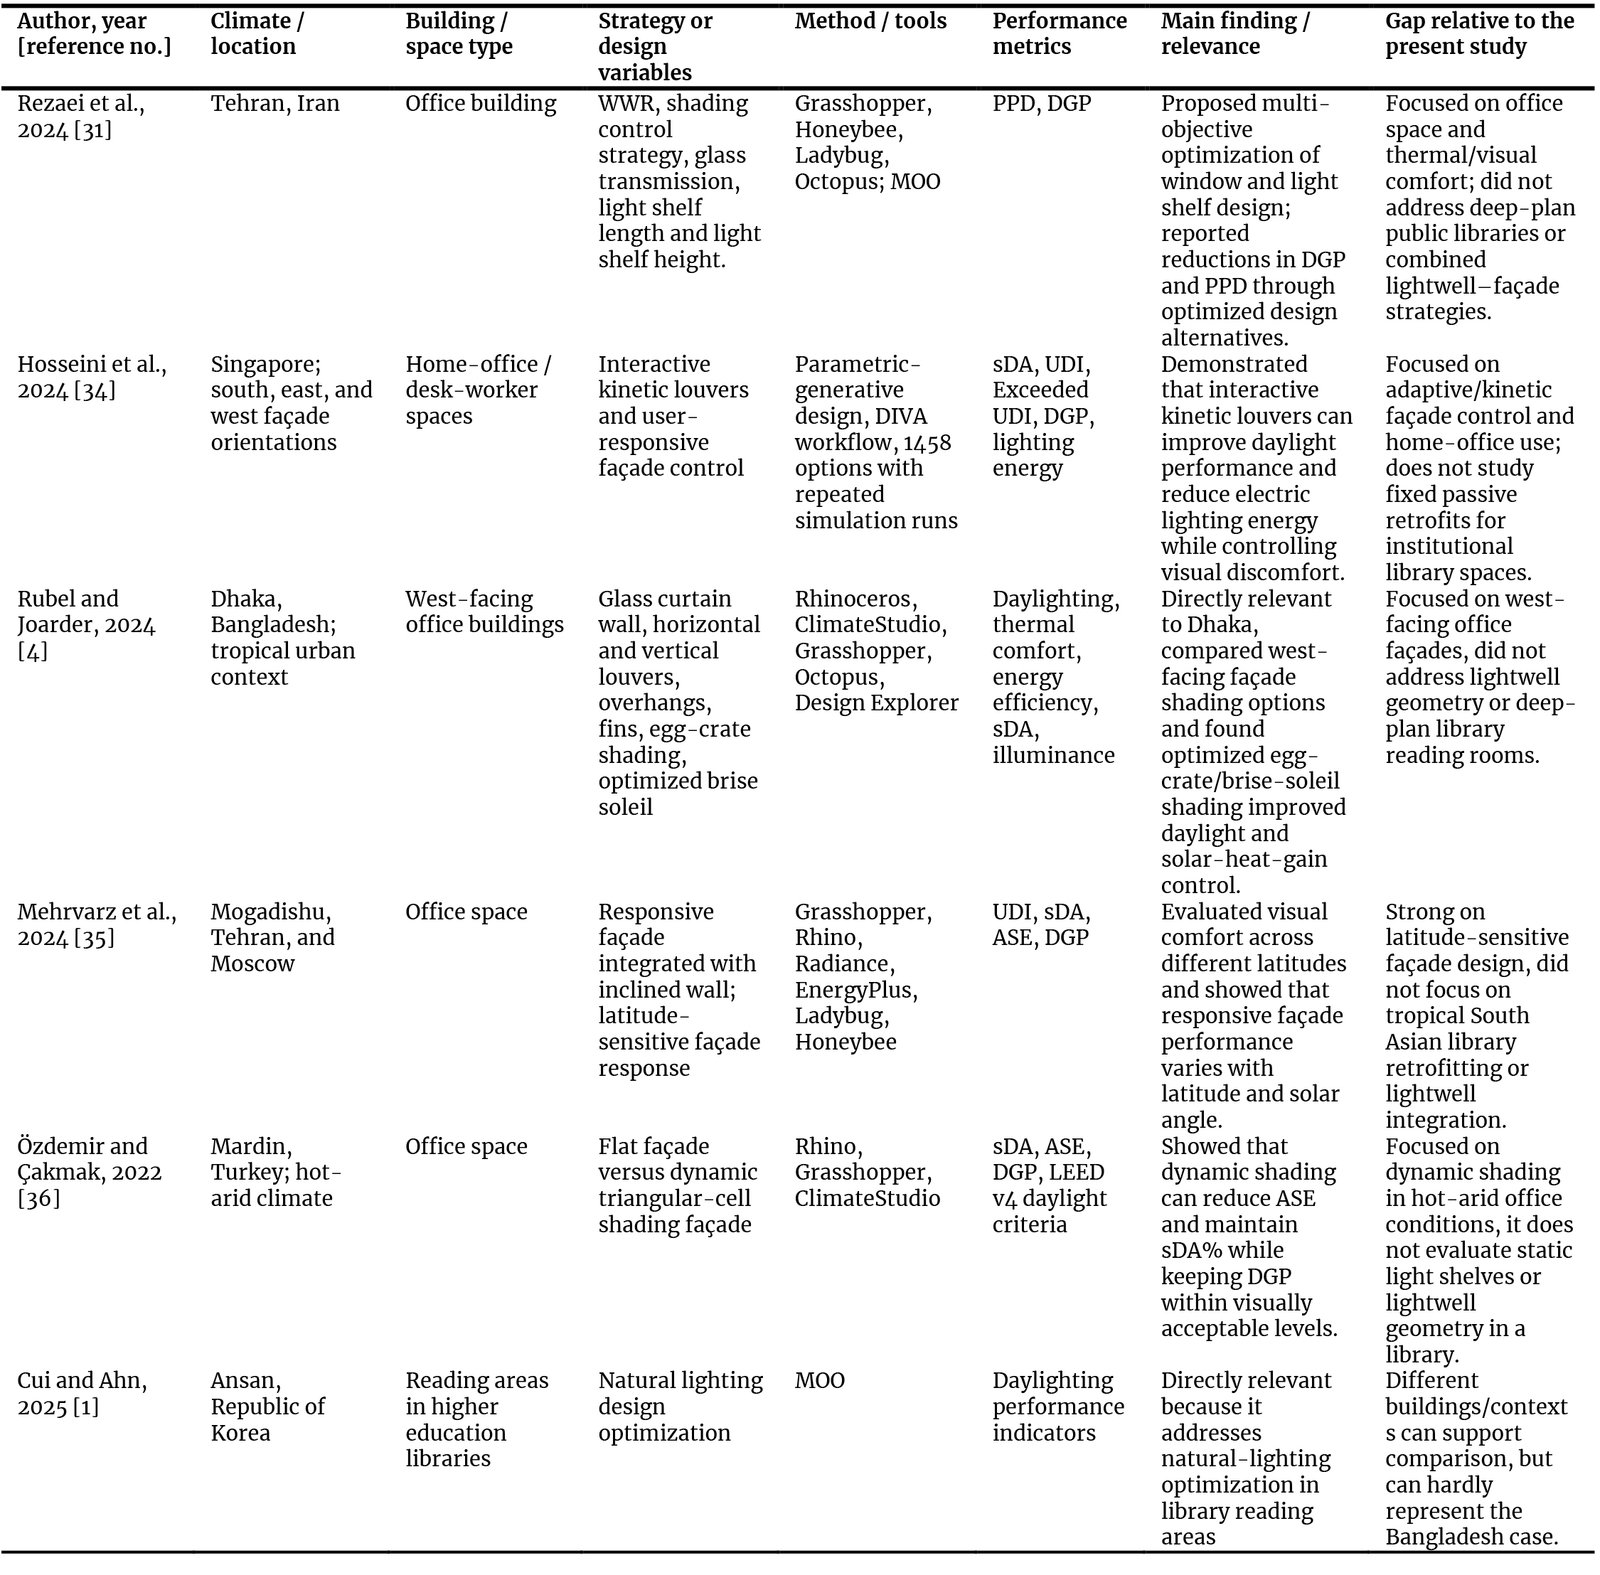
Table 1. Recent studies on daylight-driven façades, shading and passive daylight optimization.
Recent daylighting research highlights three main directions. The first direction is the use of climate-based daylight metrics, including sDA, ASE and UDI, to evaluate annual daylight availability and excessive solar exposure under typical operating conditions [17,18]. The second direction focuses on façade and shading design with glare-related measures such as daylight glare probability (DGP). Façade studies recognize that direct sunlight and high luminance contrast can increase visual discomfort [29,30]. The third direction is multi-objective optimization (MOO). MOO is increasingly used in design studies. MOO helps balance multiple goals within one framework. These goals include daylight availability, glare control, thermal comfort and energy performance [16,31]. Few recent studies focus on offices, classrooms, responsive façades, dynamic shading systems or skylight-based daylighting strategies [3,32,33]. Tropical deep-plan public library spaces remain insufficiently studied. This underrepresentation needs attention because library reading areas involve long periods of visual work, uneven daylight distribution, glare near openings and high dependence on artificial lighting [1,2]. Façade-based and void-based daylighting strategies are usually studied separately. This research addresses this gap by examining the combined effect of diagonal lightwell placement (in the library plan layout), high-window design, and light-shelf geometry in the case building, the Bangladesh National Library, under Dhaka’s tropical climate.
Public libraries need stable daylight conditions. The effectiveness of reading, studying and archival work depends on visual comfort. These activities also require standard lighting levels and should reduce dependence on artificial lighting [1,2]. In tropical climates, such as Dhaka, daylight design should manage excess sunlight. Daylight design should control glare and uneven lighting. If daylight is not effectively controlled, may result in visual discomfort and increase cooling energy demand [4]. Passive strategies such as lightwells, high windows and light shelves can improve daylighting inside a building. These strategies help bring light deeper and distribution better. The performance of daylighting in a space may vary with room depth, façade orientation, solar geometry and aperture design. The interaction between void-based and facade-based systems also affects daylighting performance [5,18,25]. Daylight optimization in deep-plan tropical library spaces needs an integrated approach. Optimization should assess the amount of daylight, not just its presence and check excessive sunlight exposure. Glare risk should be considered and energy performance should be compared. These factors should not be studied separately for void and façade interventions [6,17].
This research focuses on the combined effects of lightwell placement, high-window design and light-shelf parameters. The study uses climate-based daylight metrics (e.g., sDA300/50% and ASE1000,250h) and EUI as a comparative energy measure to evaluate daylight and energy performance for the case library building. The main contribution of this research is a simulation-based optimization framework to improve daylight performance in a tropical, deep-plan public library. Energy results are used to compare scenarios and are not treated as proof of full net-zero energy performance.
The reviewed literature (Table 1) was reorganized according to its relevance to the research question. The present study examines how diagonal lightwell placement and façade modification with high-window and light-shelf parameters can improve daylight performance in a tropical deep-plan library while reducing excessive sunlight exposure and maintaining lower comparative EUI. The literature is grouped into five areas: tropical and Dhaka-specific façade-shading studies; climate-based daylight metrics; void-based daylight design; façade and light-shelf optimization; and glare and visual comfort assessment. Studies from Dhaka and other tropical regions show the need for climate- and orientation-specific analysis, especially for east- and west-facing façades where glare risk and cooling demand can increase [4,25]. Atrium, skylight and lightwell studies support the role of void-based daylighting in improving daylight access to interior zones when geometry is optimized [1,24]. Climate-based daylight studies support the use of sDA, ASE and UDI for evaluating annual daylight availability and excessive solar exposure [17,18]. Façade and light-shelf studies support the use of aperture configuration, high-window placement, shelf depth, shelf angle and surface reflectance as interacting design variables [3,5,31]. Recent studies on visual comfort and responsive façades show that excess sunlight and glare should be treated as design trade-offs rather than daylighting benefits alone [34–36]. This categorization positions the present study within recent daylight optimization research and highlights the research gap in combining diagonal lightwell placement with façade-based daylight redirection for tropical deep-plan public library spaces.
2. Methodology
A parametric approach was employed to evaluate the daylight and comparative energy performance of lightwell and façade-based retrofit strategies at the Bangladesh National Library. The library was selected as the case building, and one large, deep-plan reading space was chosen as the case space for detailed analysis. At first, simulation analyses were conducted for four angular lightwell placements in the library plan layout: 0°, 15°, 30°, and 45°. The second stage evaluated six façade variables: south- and west-facing high window scaling, and light shelf depth and angle.
Room dimensions, material properties and other non-parametric model inputs were kept constant. The MOO was conducted using the Octopus plug-in within Grasshopper and Rhinoceros.
The methodology was organized into six linked stages (Figure 1). First, the case building and case space were selected. Second, field illuminance was measured in the case space. Third, a base daylight model was developed and point-in-time illuminance validation was performed. Fourth, different lightwell and light shelf options were tested using parametric methods. Fifth, MOO was carried out using sDA300/50%, ASE1000,250h and EUI. Finally, optimized results were interpreted through triangulated analysis [6,31]. Triangulated analysis was used to interpret optimized solutions through three outputs from the same simulation dataset: Pareto Front position, weighted fitness-function ranking and Design Explorer parameter filtering. The Pareto Front identified non-dominated trade-off solutions; the weighted fitness function ranked solutions according to the selected objective weights; and Design Explorer helped examine parameter patterns among high-performing solutions [6,15]. This triangulation was used solely for analytical interpretation.
Figure 1
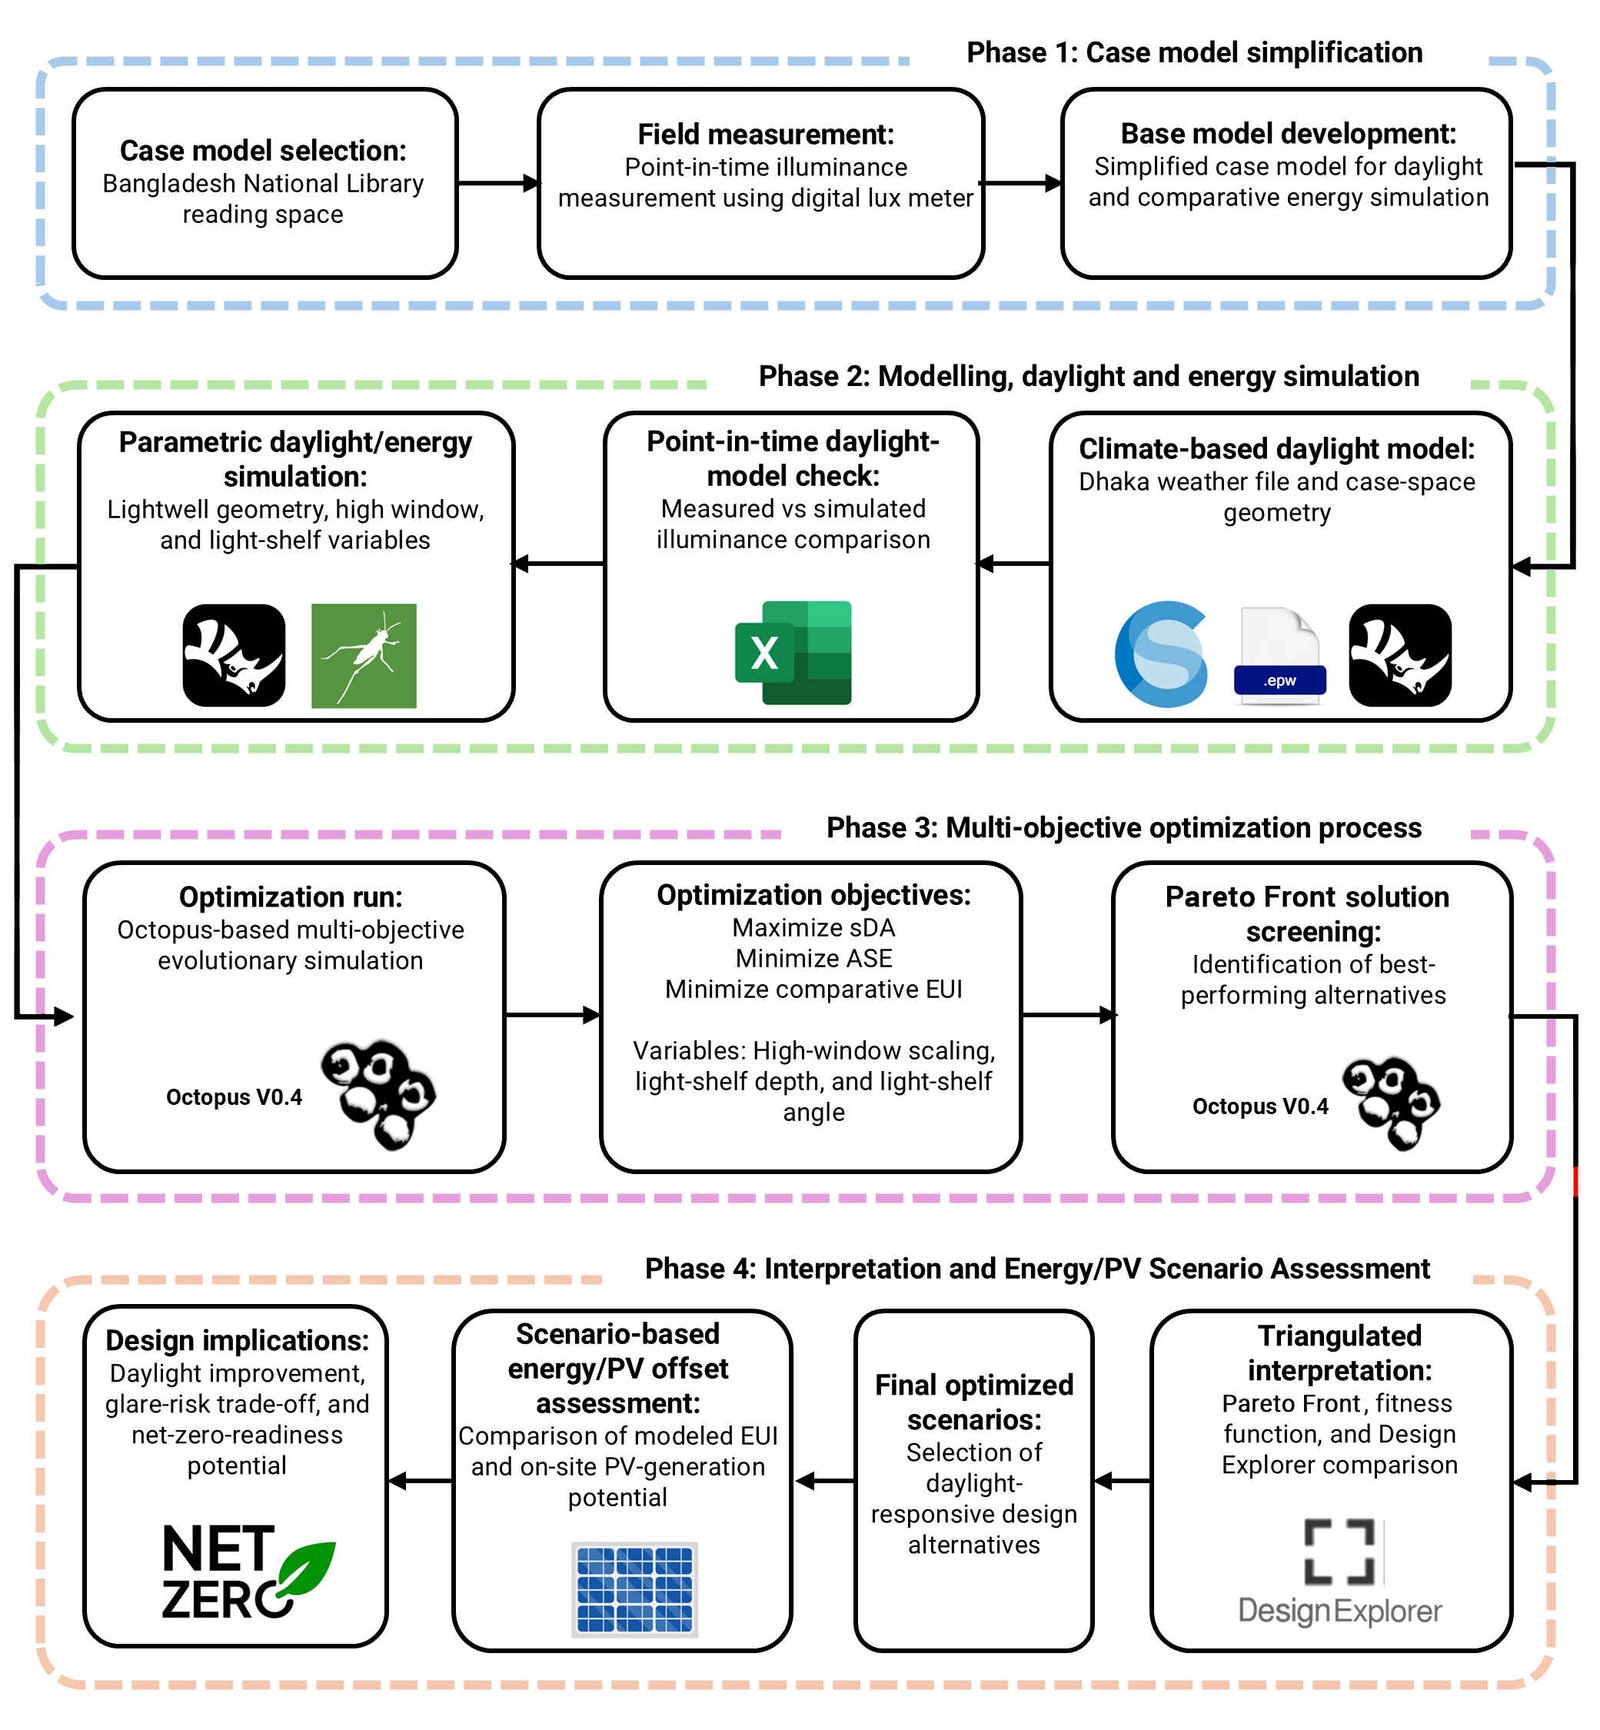
Fig. 1. Step-by-step flow diagram of research methodology.
At the optimization stage, different configurations of lightwells were tested first, followed by scenarios integrating light shelves. The sequential process enabled the independent and combined evaluation of void- and façade-based strategies and supported the selection of alternatives that improved daylight penetration while accounting for excessive sunlight exposure and comparative energy use. A scenario-based PV-offset assessment was subsequently conducted by comparing modeled annual energy use with estimated on-site PV generation.
2.1. Field study
The selected case space for the study was the newspaper and magazine room on the second floor of the case building, as shown in Figure 2. The room had a primary south-facing opening toward the open terrace and a secondary depressed window on the west side, creating a deep-plan configuration. The schematic plan with the location of daylight sensor points for light measurement is shown in Figure 3.
Figure 2
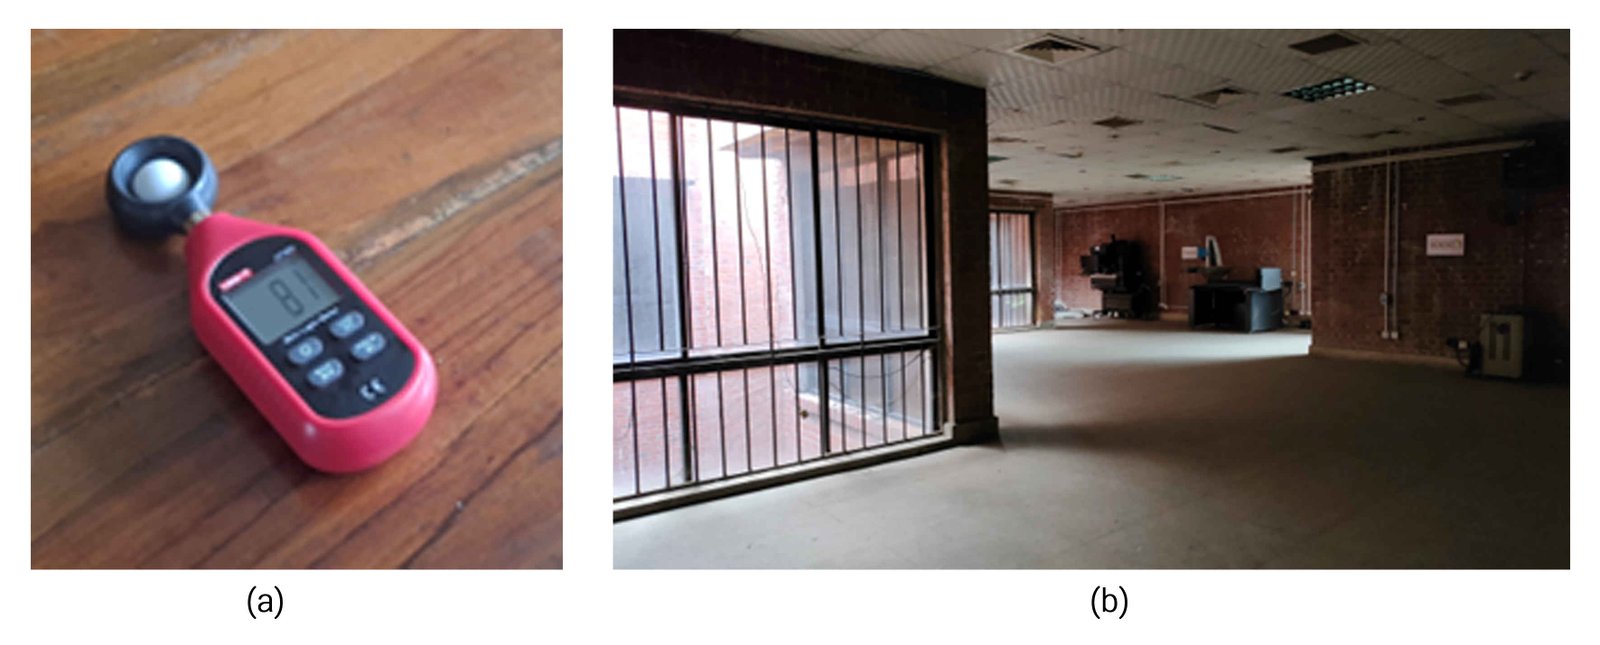
Fig. 2. Field-measurement context and case-space condition: (a) UNI-T UT383 mini light meter used for illuminance measurement; and (b) The existing newspaper and magazine reading room under its general operating condition. Artificial lighting was switched off during the daylight measurements.
Figure 3
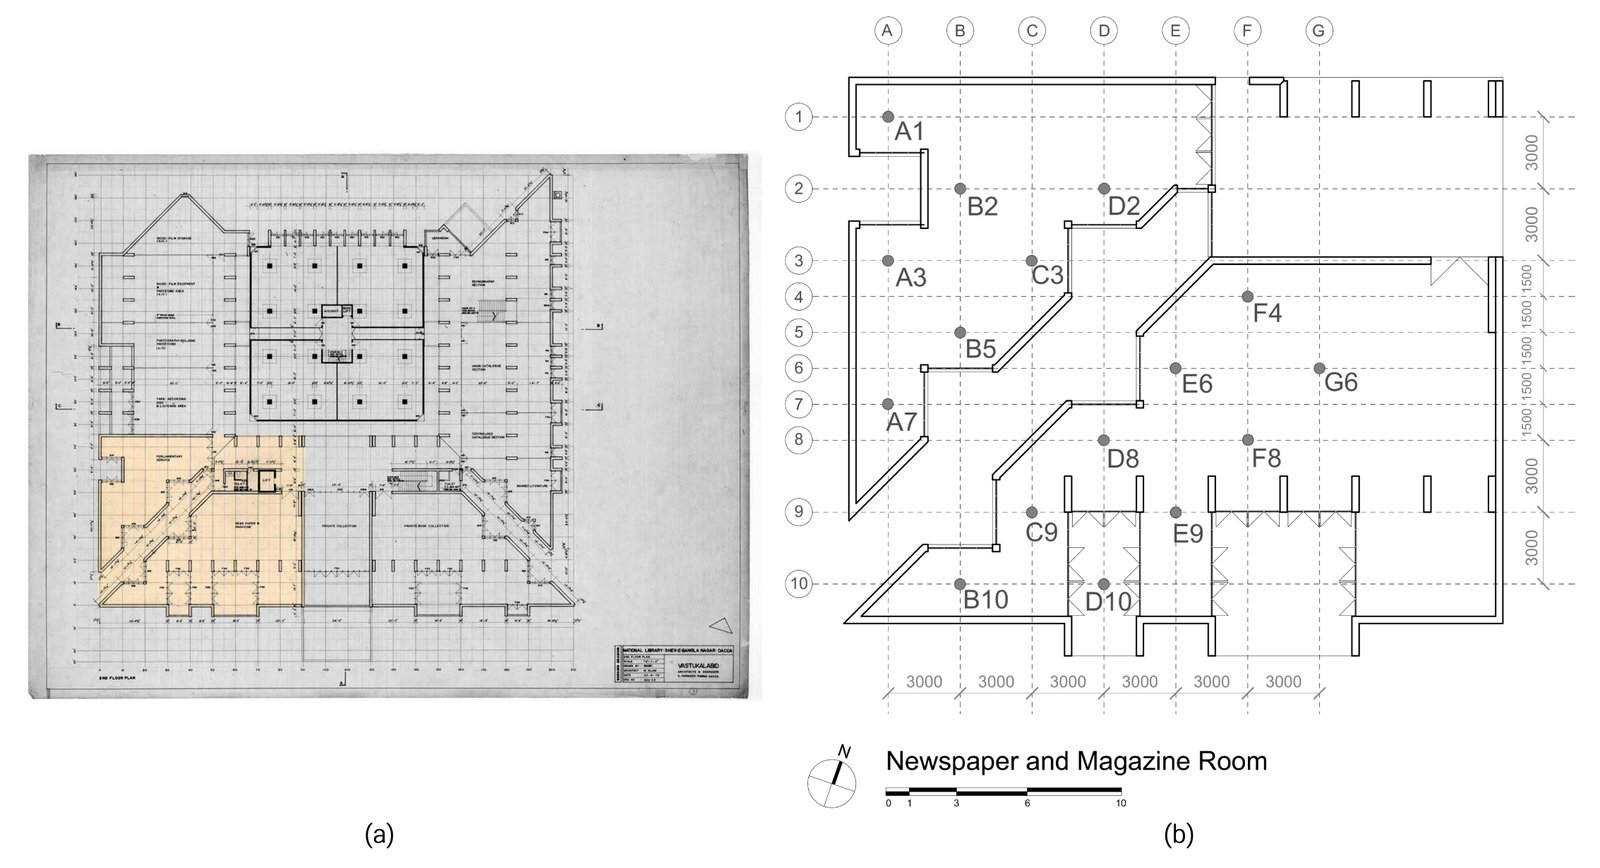
Fig. 3. Case-space geometry and measurement layout: (a) second-floor plan of the Bangladesh National Library; and (b) Selected newspaper and magazine reading room with sensor-grid locations, south-facing terrace opening and west-side depressed window.
The natural-ventilation scenario was defined from the opening configuration of the selected reading space. The south-facing terrace opening was treated as the principal air-entry opening. In contrast, the west-side depressed window and the proposed high windows were treated as secondary openings that could support cross- or mixed-mode airflow. This configuration was used solely for comparative energy-scenario assessment.
Field measurements were conducted on 25 June 2025 at approximately 02:30 PM during occupied hours to characterize point-in-time daylight illuminance under a high-sun summer condition. The measurements were used to compare measured and simulated illuminance under the monitored condition; annual sDA300/50% and ASE1000,250h values were derived separately from climate-based annual simulation. The date was close to the summer solstice period. Dhaka also had high sun angles and strong daylight during June. The measurement condition was useful for checking the base daylight model under strong daylight conditions. The measurement provided a point-in-time comparison between measured and simulated illuminance. Annual metrics, including sDA300/50% and ASE1000,250h, were derived from climate-based annual simulations using the weather file. Daylight measurements were carried out using a UNI-T UT383 Mini Light Meter held in the hand at table height (0.75 m from the finished floor level). Although the UNI-T UT383 mini light meter device does not include a formal calibration certificate, its accuracy was cross-checked against a stable reference light source under controlled indoor conditions before field light measurements. This procedure ensured the consistency and relative accuracy of the readings used to support the point-in-time illuminance daylight-model check. Artificial lights were switched off to ensure only daylight contribution was recorded. A total of fifteen interior sensor points were distributed across the space on a 3000 mm × 1500 mm grid, along with one exterior reference point on the terrace. At each sensor location, multiple readings were taken to ensure stability, and the most stable value was recorded.
The normalized mean bias error (NMBE) was used to determine systematic over- or underestimation. In contrast, the root mean square error (RMSE) and the coefficient of variation of RMSE (CV(RMSE)) were applied to assess error magnitude relative to the mean measured value. In addition, the mean absolute percentage error (MAPE) and root mean square logarithmic error (RMSLE) were calculated to provide a comprehensive assessment of model accuracy [17,28,60]. To quantify agreement between measured and simulated illuminance, NMBE, RMSE, CV(RMSE), MAPE, RMSLE and Pearson’s correlation coefficient (r), and coefficient of determination ( ) were calculated using Eqs. (1)–(7). These indicators were used to assess systematic bias, error magnitude, and correlation within the point-in-time validation dataset outlined in ASHRAE Guideline 14 [59].
In this study, NMBE was calculated as the difference between measured and simulated values. With this definition, a negative NMBE indicates that the simulation predicted higher values than were measured. The statistical parameters were calculated using the following equations.
In Eqs. (1)-(7), i is the sensor-point index and n is the total number of measured sensor points, which was 15 in the present validation dataset. is the measured illuminance at the sensor point , and is the corresponding simulated illuminance, both expressed in lux. and represent the mean measured and mean simulated illuminance values, respectively. NMBE, CV(RMSE), and MAPE are expressed as percentages. RMSE is expressed in lux, whereas RMSLE, Pearson’s r, and are dimensionless.
2.2. Daylighting and energy metrics for simulation
To account for daylighting and energy consumption within the optimization approach, appropriate building performance metrics were identified through a review of the literature [37].
2.2.1. Daylighting metrics
Visual comfort and daylight adequacy can be assessed using several metrics, with illuminance being one of the most widely used indicators [38]. Illuminance refers to the quantity of light incident on a surface per unit area, measured in lux. For this study, analysing daylight performance indicators was essential to understand how passive systems, such as lightwells and light shelves, respond to Dhaka’s local climatic conditions [11].
Among the established daylight metrics, sDA and ASE have recently gained prominence [39]. These were published by the Illuminating Engineering Society of North America (IESNA) as daylight evaluation methods in 2012 [40] and later adopted by both the Leadership in Energy and Environmental Design (LEED) and WELL Building Standard (WELL) building standards [41]. Many recent optimization studies have employed sDA and ASE to evaluate both illuminance sufficiency and potential glare [37,42–46]. The research used sDA and ASE metrics, which are the most prevalent in assessing indoor daylight levels [22,47].
sDA300/50% [%] measures the percentage of a floor area that receives at least 300 lux of daylight for a minimum of 50% of the occupied hours annually, defined here as 8:00 AM to 6:00 PM [37,47]. While some simulations focus only on task areas, the full floor area is typically analyzed under sDA300/50%. Given a grid of N sensor points, a function ST (i) that equals one if point i meets the daylight threshold for the specified time and zero otherwise, the sDA300/50% is calculated as Eq. (8) [15].
where:
\({\mathrm{I}}_{\mathrm{i}}=\left\{\begin{matrix}1, \& \text{if\ sensor\ point\ }\mathrm{i}\text{\ receives\ }\geq 300\text{\ lux\ for\ }\geq 50\%\text{\ of\ occupied\ hours} \\ 0, \& \text{otherwise}\end{matrix}\right. \)In Eq. (8), N is the total number of sensor-grid points included in the analyzed floor area, and i identifies an individual sensor point. The binary indicator Ii equals 1 when the sensor point i receives at least 300 lux for 50% or more of the annual occupied hours; otherwise, Ii equals 0. The summation, therefore, counts the number of sensor points that satisfy the sDA300/50% criterion. Division by N multiplication by 100 expresses the result as a percentage of the analyzed floor area. Sensor points were evaluated on a horizontal work plane 0.75 m above the finished floor level [43]. According to LEED v4.1, for office buildings, higher sDA300/50% scores equal more credits: 40% = 1 credit; 55% = 2 credits; and 75% = 3 credits.
ASE1000,250h [%] evaluates the annual amount of direct sunlight entering a space, identifying the potential visual discomfort from direct sunlight [6].
ASE1000,250h quantifies the percentage of the work plane that receives more than 1000 lux of direct sunlight for more than 250 occupied hours per year [42]. ASE1000,250h is calculated using point-based data as Eq. (9) [15].
where:
\( {\mathrm{J}}_{\mathrm{i}}=\left\{\begin{matrix}1, \& \text{if\ sensor\ point\ }\mathrm{i}\text{\ receives\ }\gt 1000\text{\ lux\ for\ }\gt 250\text{\ occupied\ hours/year} \\ 0, \& \text{otherwise}\end{matrix}\right. \)In Eq. (9), N is the total number of sensor-grid points, and i identifies an individual sensor point. The binary indicator Ji equals 1 when the sensor point i receives more than 1000 lux of direct sunlight for more than 250 occupied hours during the annual simulation; otherwise, Ji equals 0. The sum of Ji therefore represents the number of points exceeding the ASE1000,250h criterion. The result is divided by the total number of sensor points and multiplied by 100 to express ASE1000,250h as a percentage of the analyzed floor area. Under LEED v4.1, ASE1000,250h values above 10% require written justification and careful solar-control assessment. The 10% value is therefore treated in this study as an excessive-sunlight benchmark. IES LM-83 [40] approved the method of using sDA300/50% and ASE1000,250h together to evaluate the daylighting condition of the space.
UDI and glare-related indicators were used to assess daylight quality beyond daylight quantity. UDI was used to determine whether illuminance remained within a useful range, neither too low nor too high, and UDIa was used as an additional daylight-quality indicator [17,29].
DGP is a view-dependent metric used to estimate discomfort glare. ClimateStudio’s Annual Glare workflow uses annual DGP calculations to derive Spatial Disturbing Glare (sDG) [48,49]. In this study, sDG was used as a supplementary visual-comfort indicator. The principal optimization objectives remained sDA300/50%, ASE1000,250h and EUI.
2.2.2. Energy metrics
EUI is a widely used metric that quantifies the energy consumption of buildings relative to their size or function. EUI is annual energy consumption divided by the total building floor area, typically expressed in kilowatt-hours (kWh) per square meter [kWh/(m2.y)], with lower values indicating higher energy efficiency [37,45]. The simple mathematical formula for EUI is as Eq. (10) [50].
In Eq. (10), Em is the modeled site-energy consumption during the month m, expressed in kilowatt-hours and the summation from m=1 to 12 represents the modeled annual site-energy consumption. A is the total analyzed building floor area in square metres. EUI is therefore expressed in kilowatt-hours per square metre per year [kWh/(m²·y)]. Lower EUI values indicate lower modeled annual energy demand per unit floor area under the stated simulation assumptions.
2.3. Simulation and optimization process
In this research, Octopus was used as a plugin. Octopus was originally developed for multi-objective evolutionary optimization and incorporates the Pareto Front principle to address multiple goals, a key requirement in this study. Many recent studies have employed Octopus and its Pareto Front trade-off methods in MOO contexts [37,51–53].
2.3.1. Variable selection
The parameters of the high-window and light-shelf systems that influence daylight performance were treated as variables in this study. The overall dimensions of the case space were kept constant, while the high-window scaling, light-shelf depth, and light-shelf angle were varied independently for the south and west orientations. The three optimization variables are independently assigned to the south and west orientations (Figure 4).
Figure 4
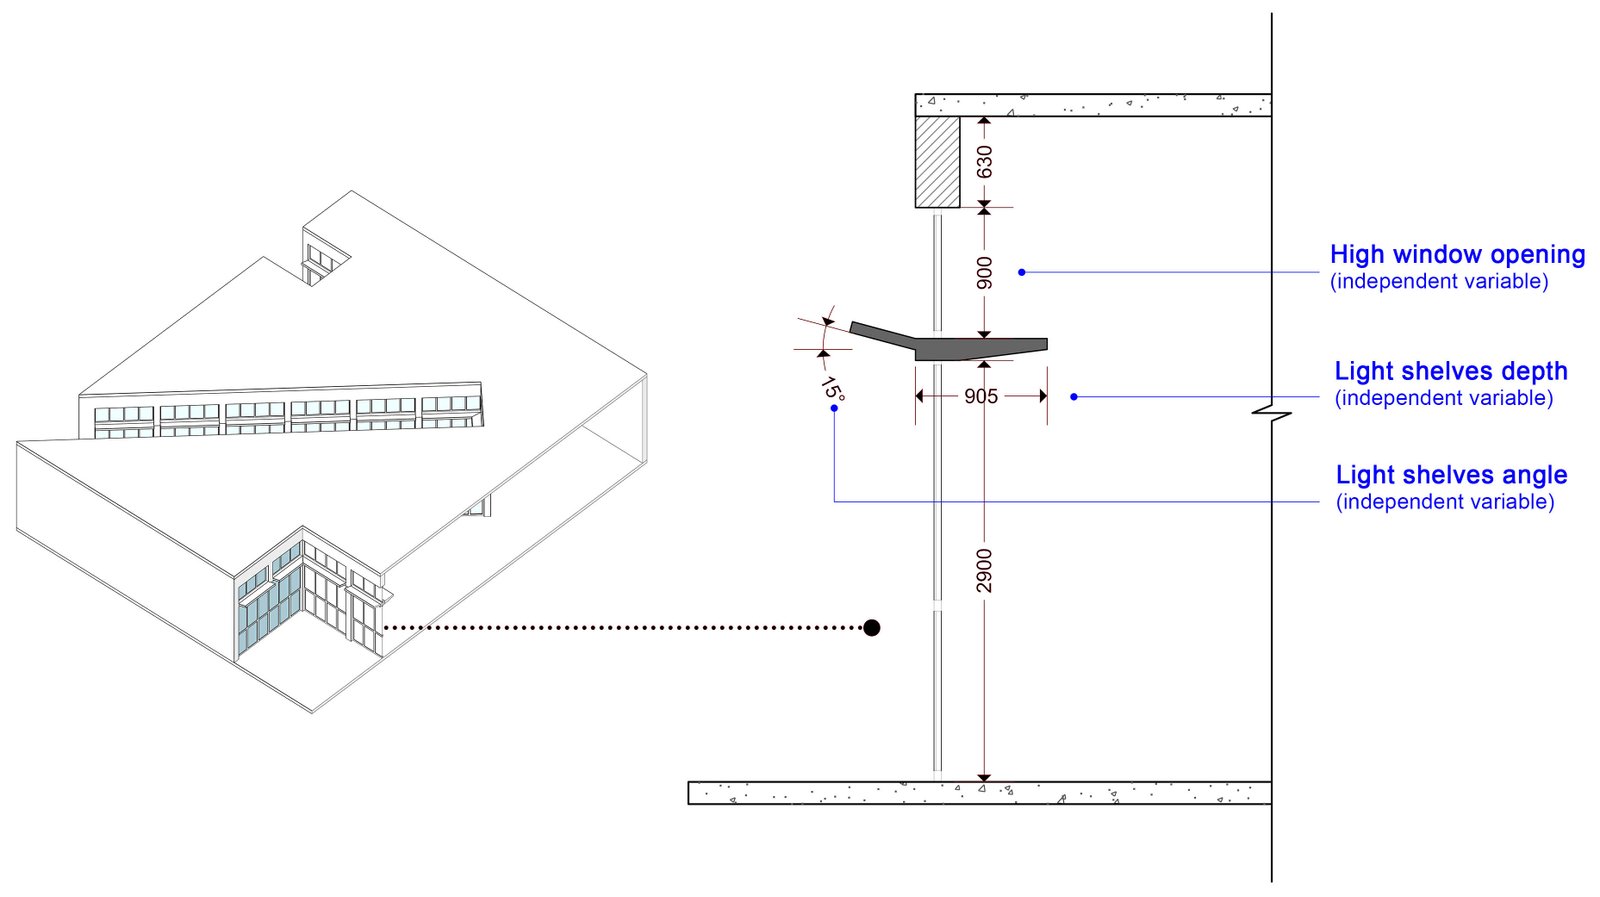
Fig. 4. Geometric variables used in the façade optimization, including high-window scaling, light-shelf depth, and light-shelf angle. The variables were independently assigned to the south and west orientations.
The geometric variables represented the main façade controls affecting daylight entry, shading depth and daylight redirection. High-window scaling controlled the height of the added high window, light-shelf depth controlled the outward projection and shading effect and light-shelf angle controlled the redirection of daylight toward the ceiling and deeper interior zones. Because the selected case reading space received daylight primarily from the south-facing terrace opening and the west-side depressed window, shelf depth and angle were tested for both south- and west-facing orientations. The three geometric parameters used in the parametric simulation were as follows.
- High-window scaling: South and west high windows were varied from 0.5 to 0.9 of 0.9 m height, corresponding to an effective high-window height of 0.45–0.81 m.
- Light shelf depth: South and west light shelves were varied from 0.4 to 1.0 of 1.5 m depth, corresponding to a physical shelf projection of 0.60–1.50 m.
- Light shelf angle: South and west light shelves were varied from 0 to 4, where 0 = 0°, 1 = 15°, 2 = 30°, 3 = 45° and 4 = 60°.
The light-shelf angle was selected as a key variable because the angle controls the direction of reflected daylight after sunlight or skylight reaches the shelf. A horizontal shelf can block direct sunlight on the lower window and reduce glare, but may not redirect sufficient daylight toward the ceiling. A slightly inclined shelf can redirect daylight upward, allowing the ceiling to distribute reflected light deeper into the room. A steep shelf angle can create strong reflected light near the window and increase the risk of high ASE1000,250h and glare. For this reason, angles from 0° to 60° were tested for both south and west orientations to examine the balance among daylight depth, ceiling reflection and excessive sunlight control under Dhaka’s tropical conditions.
2.3.2. Selection of simulation tools
Selecting the appropriate simulation tool for optimizing daylight and energy performance depends on project requirements, the level of detail needed and user familiarity with the software. An effective tool should accurately predict indoor daylight distribution, handle complex geometries and generate climate-based daylight metrics [54]. A major challenge in MOO is managing separate outputs from different daylighting and energy tools. ClimateStudio simplifies this by integrating both analyses within a single platform, using Radiance for daylighting and EnergyPlusTM for energy performance.
A notable strength of ClimateStudio is its ability to conduct real-time, climate-based daylight simulations, including sDA and ASE, both of which are aligned with LEED v4.1 standards [55]. Unlike batch-processing tools such as DIALux, which require separate calculation phases, ClimateStudio integrates with Grasshopper to enable parametric adjustments and immediate visualization of results, significantly improving accuracy and efficiency in daylight analysis [6].
For building energy simulations, ClimateStudio incorporates EnergyPlusTM, a widely validated engine capable of modeling heating, cooling, lighting and ventilation loads [51]. The integration of EnergyPlusTM within ClimateStudio ensures that daylighting and energy performance can be assessed simultaneously, minimizing the need to use multiple tools. Its real-time feedback mechanisms further enhance the design process by allowing architects and engineers to test alternatives quickly while maintaining compliance with energy efficiency standards [56].
In this research, Rhinoceros and Grasshopper were used to build the parametric model, while ClimateStudio was used to support both daylight and energy simulations. The workflow followed two phases: first, four angular lightwell placement options were performed to identify the most effective orientation for daylight penetration; second, a parametric optimization study was conducted with light shelves and high windows as variables. The optimization process was managed using the Octopus plugin, which applies genetic algorithms (GAs) to balance multiple objectives. This allowed the exploration of trade-offs between daylight performance and energy use, while the results were visualized through a 3D Pareto Front graph [57].
The dataset generated during the optimization process was analyzed further using Design Explorer, where parallel coordinate plots (PCPs) and performance filters were applied. This provided deeper insights into the range of solutions, supported the interpretation of optimal outputs and helped refine design strategies.
2.3.3. Base and test models simulation
The base model of the case space was developed using a Grasshopper script. The climate file for Dhaka (BGD_DH_Dhaka-Shahjalal.Intl.AP.419220_TMYx.2004-2018), obtained from the EnergyPlusTM website [58], was applied to generate daylighting results under local climatic conditions. The hourly dataset was used in “save mode” to provide point-in-time illuminance values across different times of the year.
The test models were developed by integrating lightwell and façade-based daylighting strategies into the base model. The façade optimization variables, which are south and west high-window scaling, light-shelf depth, and light-shelf angle, are illustrated in Figure 4, while the digital models used for simulation and optimization are presented in Figure 5.
2.3.4. 3D modeling
This research required three distinct types of models: a daylight simulation model, an energy simulation model, and a parametric model for iterative simulation and optimization. The daylight model provided a detailed assessment of point-in-time illuminance, daylight availability, and glare performance. In contrast, the energy model was developed in a simplified form to enable faster simulations for energy demand analysis.
A detailed daylight model of the selected reading space, shown in Figure 5(b), was developed in Rhinoceros using the physical-survey data. Daylight simulations were subsequently conducted in ClimateStudio (version 1.9.8389.21977). A simplified building-energy model, shown in Figure 5(c), was developed separately to evaluate the comparative effects of the design scenarios on EUI. The iterative simulation and optimization process required integrating the daylight and energy models into a single parametric framework.
Figure 5
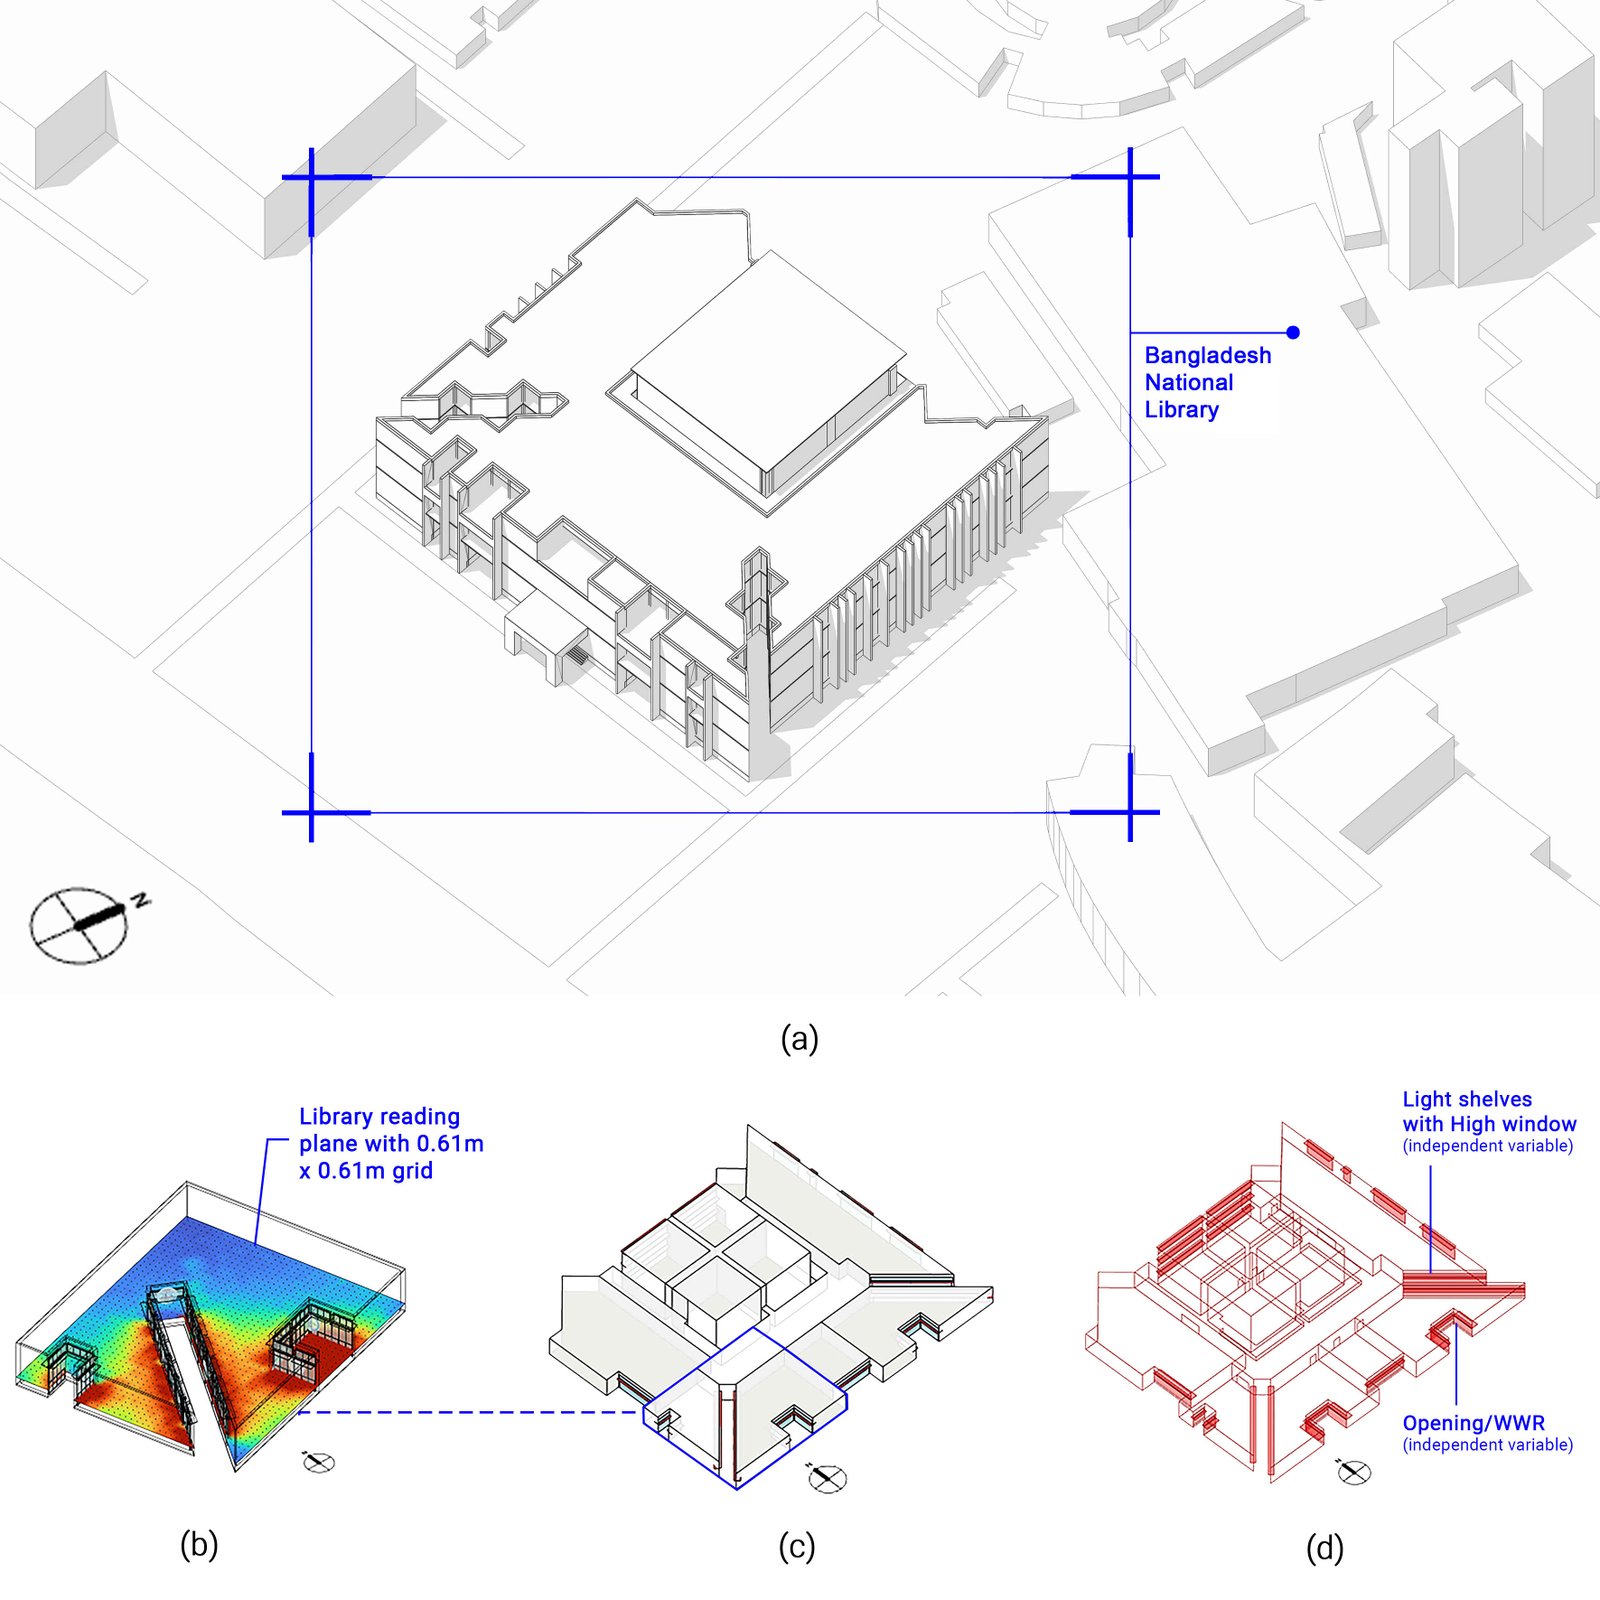
Fig. 5. Digital models used for simulation and optimization: (a) Three-dimensional model of the Bangladesh National Library with surrounding context; (b) Detailed daylight-simulation model with a 0.61 m × 0.61 m work-plane sensor grid; (c) Simplified building-energy model highlighting the selected reading space; and (d) Parametric optimization model showing the opening/WWR, high-window, and light-shelf variables.
The Grasshopper-based parametric model shown in Figure 5(d) incorporated the high-window and light-shelf variables as illustrated in Figure 4. The combined use of Rhinoceros and Grasshopper enabled consistent parametric control and data exchange between the daylight and energy simulations.
The survey analysis of the case building provided the basis for assigning material and environmental properties, ensuring consistency across both the base and test models.
2.3.5. Materials and properties
The materials of the base and test models for daylighting simulation were identified through the physical survey and selected from the Grasshopper material library during the simulation process. To ensure consistency, the floor, ceiling, wall and window glazing in the test models were kept identical to those in the base model. For the additional daylighting strategies, namely light shelves and high windows, material choice was critical, as highly reflective surfaces were necessary to redirect daylight into the interior effectively. The detailed properties of the materials used in the simulation are presented in Table 2.
Table 2
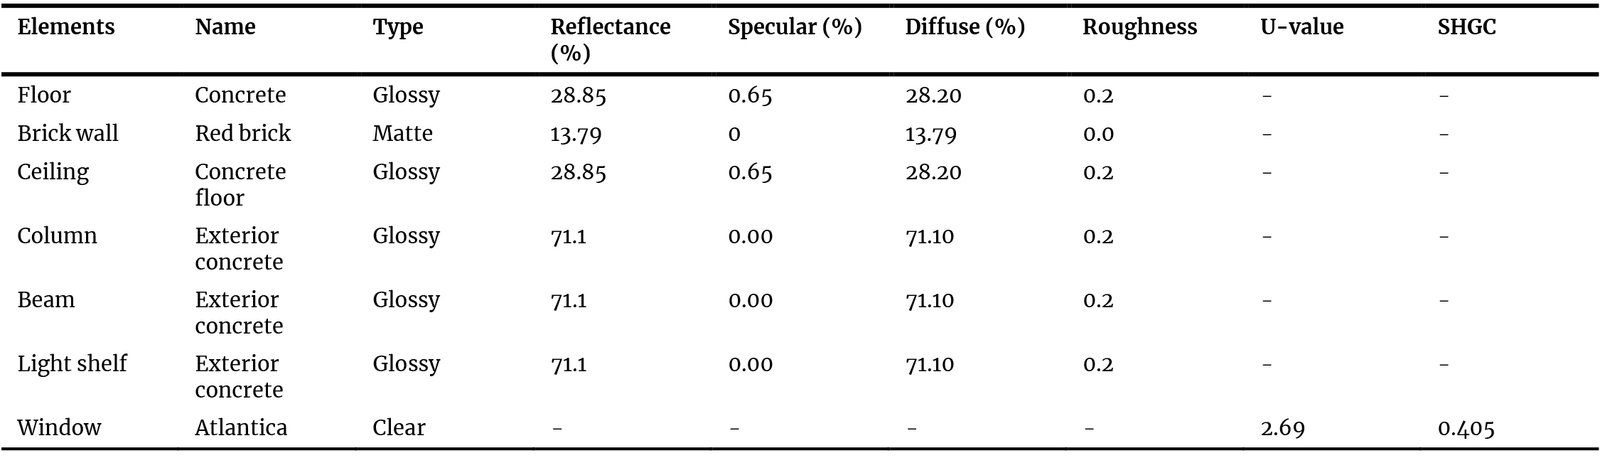
Table 2. Material selection for the 3D model from the ClimateStudio material library.
2.4. Multi-objective optimization framework
The optimization framework of this study followed a two-step process to evaluate and enhance daylighting performance in the case building: four lightwell angle simulations and parametric simulations with light shelves and high windows. During MOO, each parameter combination, referred to as a genome, was assigned a serial number for comparative analysis. The evolutionary process was run across multiple generations to explore trade-offs between daylight quality and comparative energy performance. The final reported dataset contained 220 evaluated design alternatives. MOO simultaneously evaluates multiple performance criteria to determine optimal design alternatives through iterative simulation processes. The resulting datasets are often extensive and require systematic analysis. Analytical approaches such as Pareto Front identification, fitness function evaluation, and parallel coordinate visualization are employed to interpret and prioritize the simulation outcomes.
2.4.1. Lightwell angle simulation
In the first stage, a series of test models was generated by introducing a lightwell cut into the base model geometry at different orientations (Figure 6). Four alternatives were tested with angles of 0°, 15°, 30° and 45°, while keeping the original south-facing terrace and west window unchanged. This stage was carried out without Grasshopper scripting to determine the most effective lightwell angle for improving daylight penetration into the deep-plan reading hall.
Figure 6
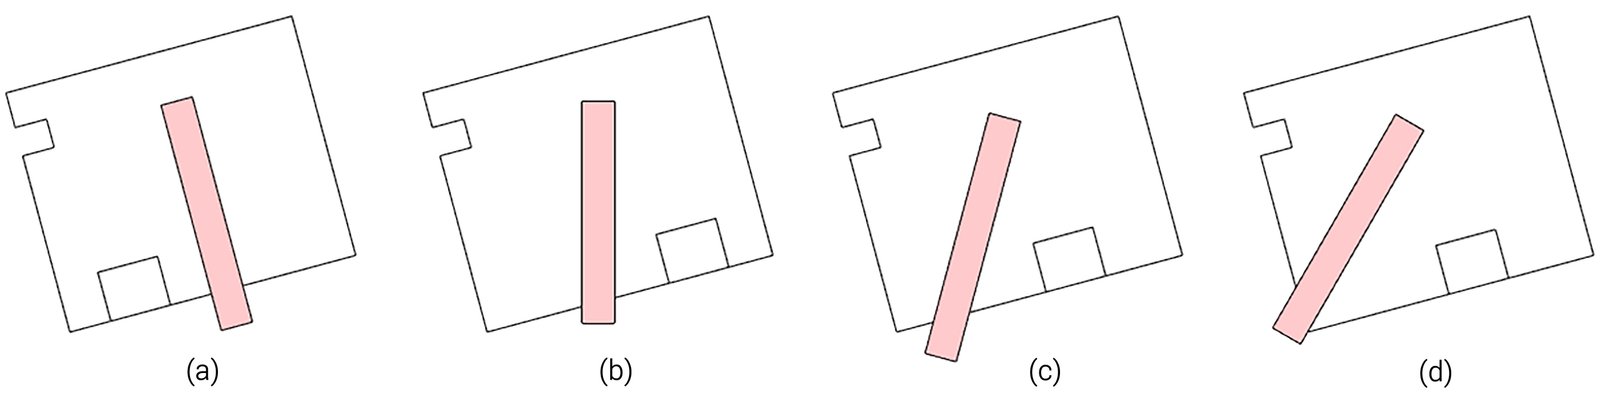
Fig. 6. Schematic explanation of the lightwell-angle simulation: (a) 0° lightwell cut; (b) 15° lightwell cut; (c) 30° lightwell cut; and (d) 45° lightwell cut.
2.4.2. Parametric simulation with light shelves and high windows
Building on the most effective lightwell geometry, the second stage integrated light shelves and high windows into the test models. This phase was executed in Grasshopper, where parametric variables such as high-window scaling, shelf depth and shelf angle (for both south and west orientations) were defined. The Grasshopper workflow connected these parametric inputs to material properties, weather files, sensor-point grids and daylight metrics, including average illuminance, sDA300/50% and ASE1000,250h. Energy metrics, including EUI, were also linked through ClimateStudio. The workflow is illustrated in Figure 7 as follows.
- Group A defined the base geometry of the case space.
- Group B controlled the parametric design of high windows and light shelves.
- Group C carried out the daylighting simulations.
- Group D (Octopus) connected the outputs of daylight and energy simulations to establish a multi-objective evaluation framework.
- Group E represented the energy modeling components.
- Group F handled iterative simulation runs.
- Group G exported the simulation outputs for further analysis.
Following the lightwell angle analysis, which identified the most effective geometry for daylight penetration, a MOO process was performed with Octopus in Grasshopper. The parametric variables, high window scaling, light shelf depth and light shelf angle, were connected to Octopus as the design inputs. The performance objectives were set to maximize sDA300/50%, and minimize ASE1000,250h and EUI. Octopus, operating through a GA, organized the results on a Pareto Front to visualize trade-offs between conflicting performance goals.
Figure 7
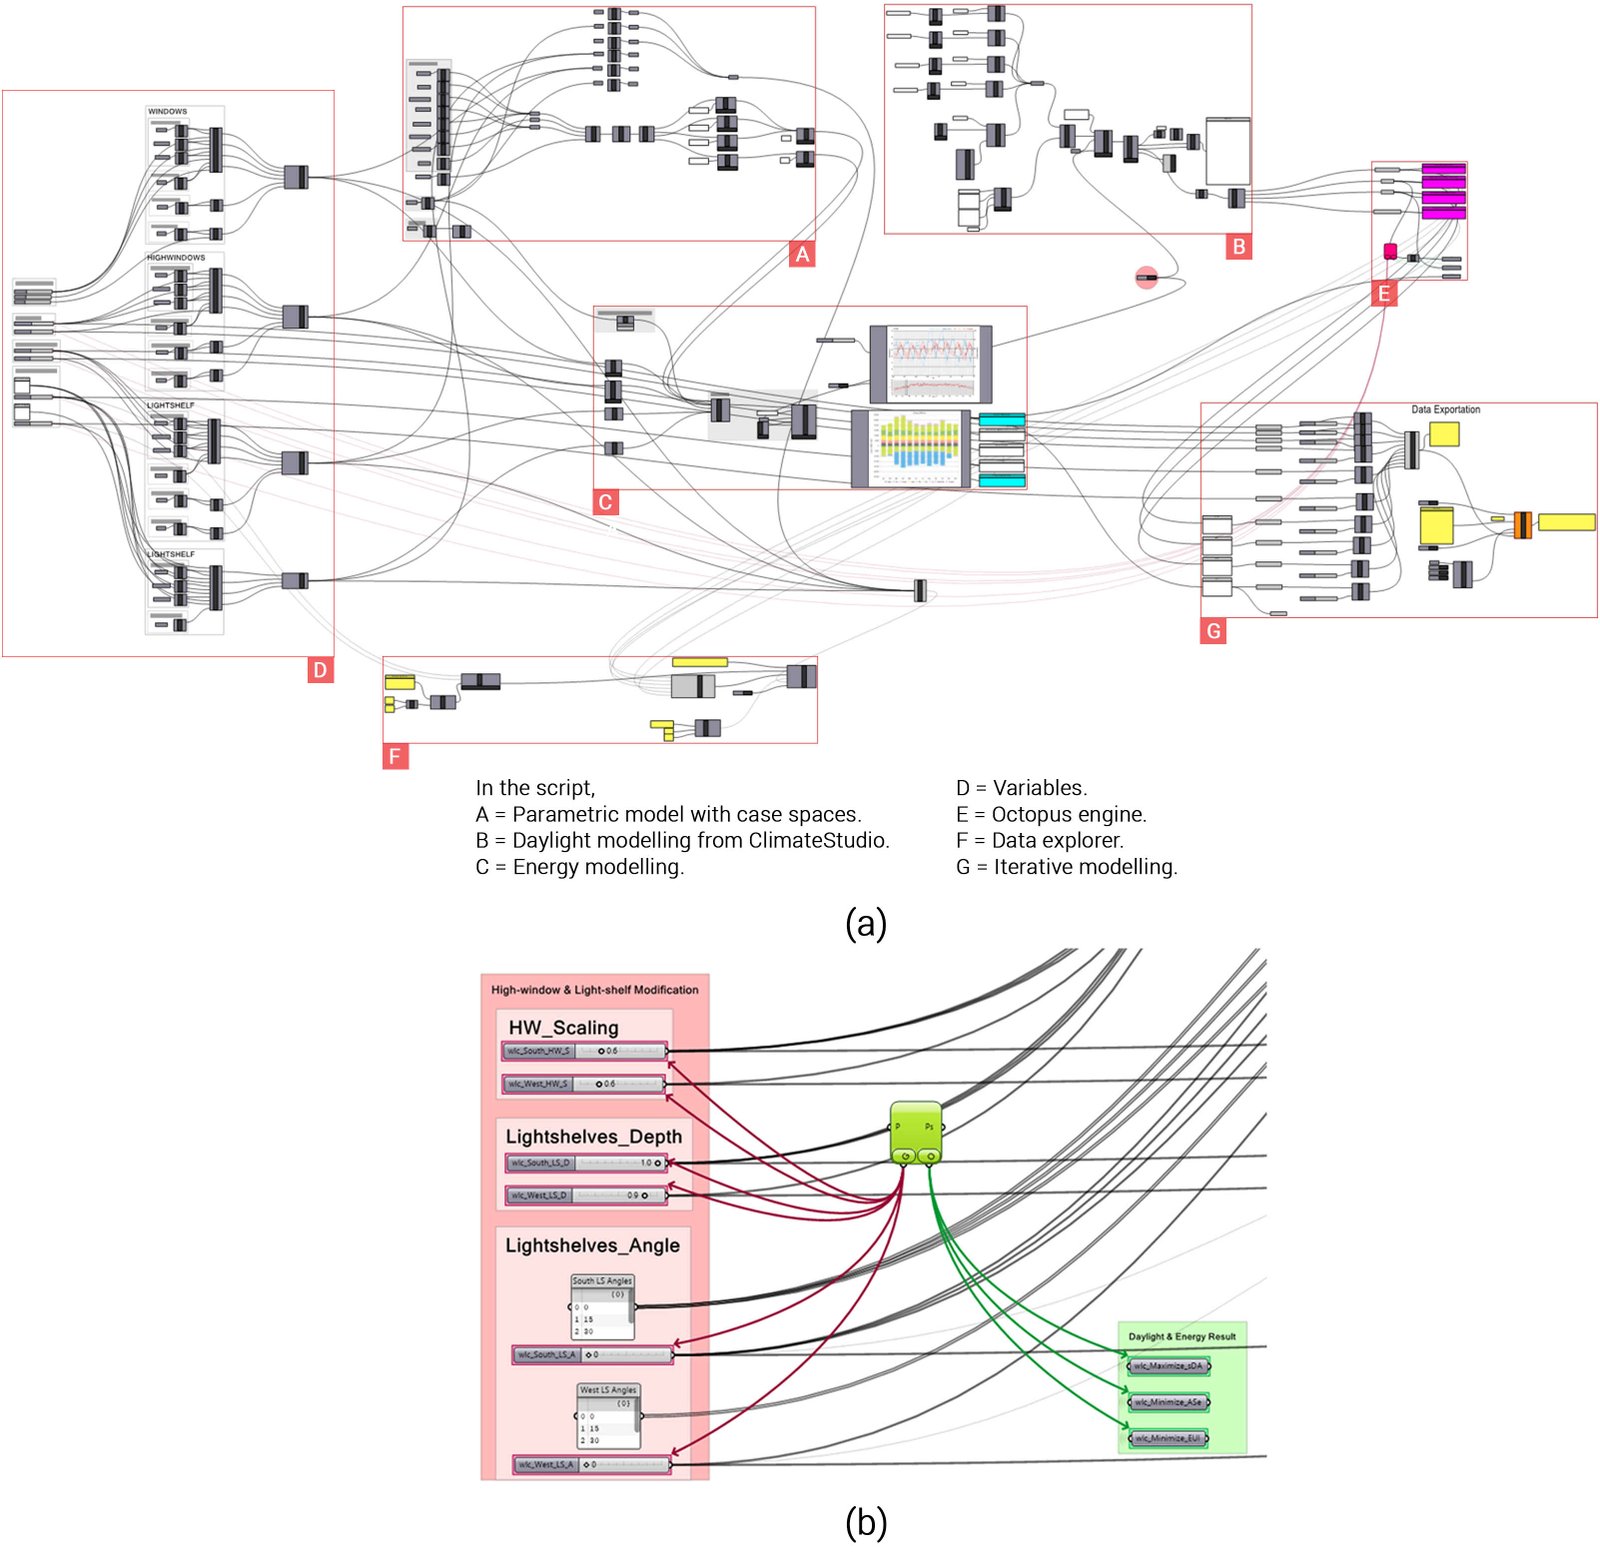
Fig. 7. (a) Grasshopper script, and (b) Genomes and objectives connected with Octopus.
2.4.3. Pareto front
In MOO, the Pareto Front represents a set of non-dominated solutions in which improving one objective necessarily leads to a compromise in another. This concept enables visualization of trade-offs among conflicting goals, helping decision-makers identify balanced solutions aligned with specific preferences. Previous studies, such as [61,62], have effectively applied Pareto Front analysis in design and optimization contexts. Rather than yielding a single optimal solution, the Pareto Front presents a spectrum of balanced alternatives, from which appropriate choices can be made based on design priorities. In this research, where the objectives include maximizing sDA300/50% while minimizing ASE1000,250h and EUI, the Pareto Front illustrated the most favorable trade-offs among these three metrics. Octopus was employed to generate the Pareto Front and eliminate dominated solutions. At the same time, MATLAB was used to construct a three-dimensional visualization of the Pareto Front from the Octopus dataset.
The study applied MOO to address multiple, often conflicting, performance objectives simultaneously. The optimization process was carried out using Octopus, a Grasshopper plug-in that integrates advanced evolutionary algorithms, including the Strength Pareto Evolutionary Algorithm 2 (SPEA-2) and the Hypervolume Estimation algorithm (HypE) [6,14]. SPEA-2 was selected due to its established effectiveness in handling complex, non-linear optimization problems [63]. This choice is particularly pertinent to building design, where daylighting and energy performance objectives are inherently conflicting and require careful balancing. Octopus further supports decision-making by maintaining a diverse Pareto Front, which clearly maps the trade-offs between competing metrics, thereby enabling the selection of contextually appropriate solutions [64]. The Pareto Front, therefore, embodies the principle that no performance indicator can be improved without a corresponding compromise in another.
2.4.4. Fitness function
In multi-objective optimization, it is important to prioritize simulation results to identify the optimal design options. This is achieved using a fitness function, which has been proven effective in various studies on building performance modeling [15].
The fitness function ensures that no single performance indicator is overly emphasized by normalizing its value to a consistent numerical scale. The study aimed to balance daylight penetration and a building’s energy use. The weighted sum method was used to combine the optimization's three goals (maximizing sDA300/50%, and minimizing ASE1000,250h and EUI) into a single value [65]. The fitness function can be written as Eq. (11).
with
In Eq. (11), FFiis the fitness-function value of the design alternative i. sDAi, ASEi, and EUIi are the sDA300/50%, ASE1000,250h and EUI values of the alternative i, respectively. sDAmin, ASEmin, and EUImin are the minimum values observed within the simulated dataset. The coefficients C1, C2, and C3 normalize the three indicators to comparable numerical ranges because sDA and ASE are percentages, whereas EUI is expressed in kWh/(m²·y). The weighting factors w1, w2, and w3 express the relative decision priority assigned to each objective. In this study, w1=2, w2=2, and w3=1. The positive sDA term rewards greater daylight sufficiency, whereas the negative ASE and EUI terms penalize excessive sunlight exposure and higher comparative energy use. A higher FFi therefore indicates a more balanced solution under the stated weighting assumptions [66].
3. Results and analysis
Field measurements were taken to compare measured and simulated daylight levels in the selected space. As shown in Figure 3, illuminance was recorded at 15 sensor points distributed across the newspaper and magazine room. Measurements were taken on 25 June 2025 at 02:30 PM, with the light meter positioned 0.75 m above the floor to represent the standard work-plane height. Artificial lights were switched off, windows were kept closed, and only daylight was measured.
The first stage of the simulation analyses assessed the performance of the case space before and after the addition of high windows and light shelves. The annual daylight analysis used the occupied-hours schedule of 08:00 AM to 06:00 PM as defined in Section 2.2.1. Daylight optimization focused on the selected second-floor case reading space and evaluated the effects of the façade interventions on daylight penetration, excessive-sunlight exposure, useful daylight availability, and glare-related performance. After daylight optimization, a scenario-based PV-offset assessment was conducted to compare modeled whole-building energy use and estimated PV generation. The PV-offset results are reported separately in Section 3.5.
3.1. Model validation
Daylight simulations were configured for the same date and time as the field survey (25 June 2025 at 02:30 PM), sensor-grid positions, and the CIE overcast sky condition, to allow direct comparison between measured and simulated results, following standard daylight validation practices applied in previous studies in the Dhaka context [25]. The validation results are summarized in Table 3. Based on the final comparison dataset, the model produced a Pearson r of 0.929, an R² of 0.864, an NMBE of −4.44%, an RMSE of 27.15 lux, a CV(RMSE) of 21.03%, a MAPE of 19.07%, and a RMSLE of 0.23. The statistical results indicated acceptable agreement between measured and simulated illuminance under the monitored condition. The model was therefore considered suitable for comparative daylight analysis of the tested alternatives.
Table 3

Table 3. Statistical validation parameters for measured and simulated illuminance values.
The RMSE and CV(RMSE) values indicate acceptable agreement for the measured point-in-time illuminance condition, considering the difficulty of matching actual sky conditions, material properties, and simulation inputs. Although the NMBE shows some deviation, the error values are comparable to those in other daylighting studies, where similar bias ranges have been accepted as reasonable [17,28,59]. The model was considered suitable for comparative daylight analysis of the tested design alternatives under the stated assumptions.
The graphs in Figure 8 comparing simulated and measured illuminance further illustrate that both datasets follow a similar distribution, with most indoor points showing illuminance levels below the BNBC 2020-recommended 200 lux for reading spaces [21]. The consistency between simulated and measured values, despite a slight bias, supports the use of the model for point-in-time comparisons and comparative daylight analysis under measured conditions.
Figure 8
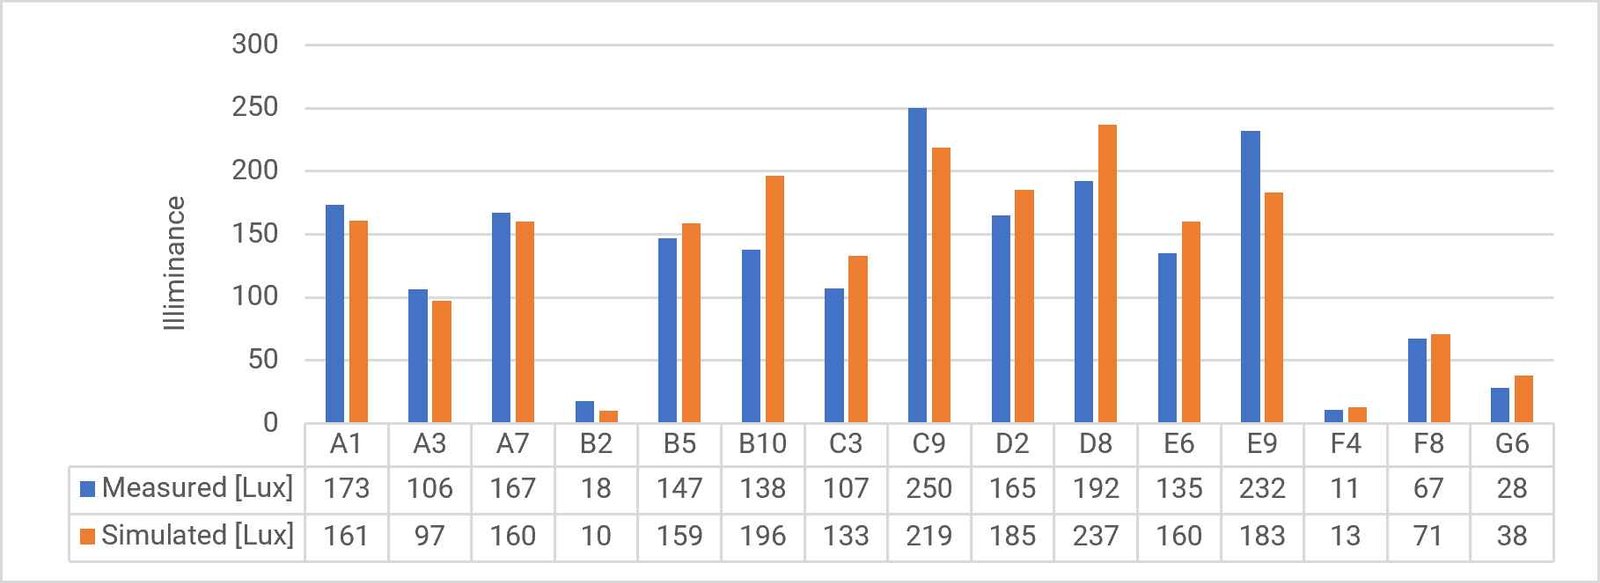
Fig. 8. Comparison between simulated and measured illuminance (lux) on 25 June 2025 at 02:30 PM.
3.2. Daylight design strategies and performance analysis
This section analyzes the impact of optimizing façade openings and lightwell placement on daylight availability and reducing dependence on electric lighting in the case library building. The study focused on lightwell placement, light shelf and high window aperture optimization to balance daylight availability, energy efficiency and occupant comfort.
3.2.1. Lightwell placement for improved daylight penetration
A major strategy for improving daylight access to the deeper parts of the library involved introducing lightwells. By altering the placement of the lightwells at different angles in the library plan, the sky view factor increased, improving the uniformity of daylight penetration. Open lightwell side walls allow deeper, more diffuse daylight penetration into interior spaces than traditional vertical shafts. As shown in Figure 9, simulations were conducted for four lightwell angles (0°, 15°, 30° and 45°).
Figure 9
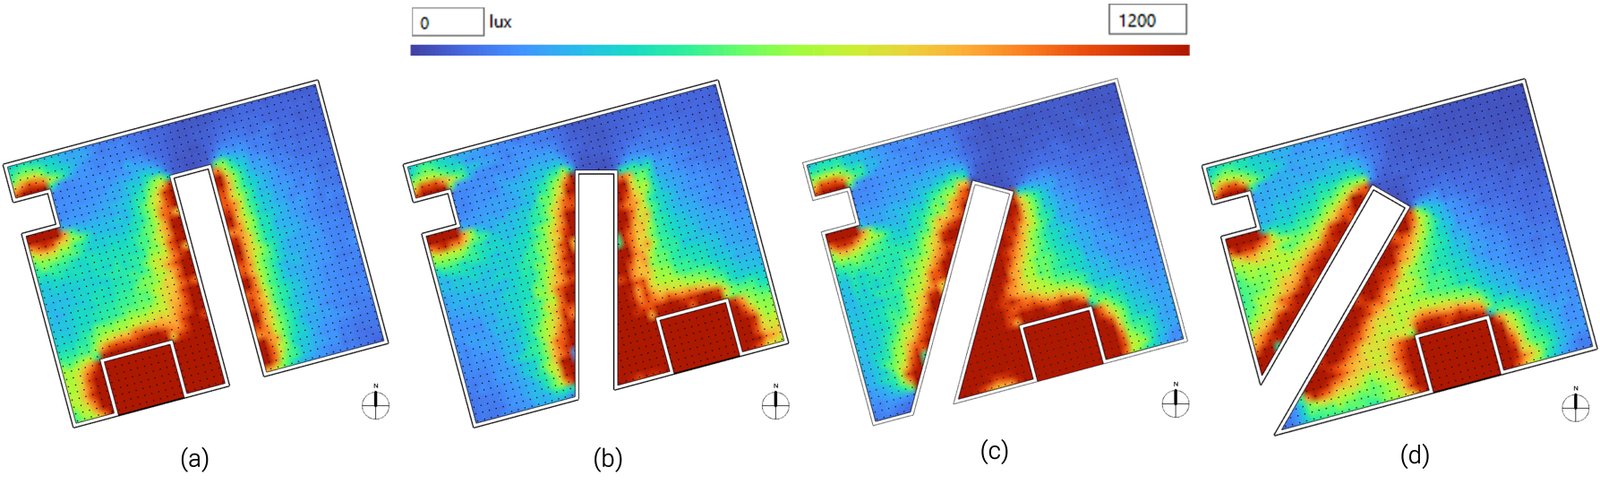
Fig. 9. Annual daylight-distribution comparison for the four tested lightwell-placement angles: (a) Test model 01 (lightwell angle 0°); (b) Test model 02 (lightwell angle 15°); (c) Test model 03 (lightwell angle 30°); and (d) Test model 04 (lightwell angle 45°), in test models.
Table 4 shows that the 45° lightwell achieved the highest sDA300/50% value of 49.12%, followed by the 0°, 15°, and 30° configurations, which achieved 48.20%, 45.49%, and 42.92%, respectively. The 45° configuration also produced the highest mean annual illuminance of 2204.86 lux, compared with 2175.60 lux for the 0° case, 2167.10 lux for the 15° case, and 2163.67 lux for the 30° case. Compared with the 0° configuration, the 45° placement increased sDA300/50% by 0.92 percentage points and mean annual illuminance by 29.26 lux. These results demonstrate that the 45° placement provided the strongest overall daylight availability among the four tested alternatives.
Table 4

Table 4. Comparative annual daylight performance of the four lightwell-placement angles.
The ASE1000,250h results nevertheless revealed an excessive-sunlight trade-off. The 0° configuration achieved the lowest ASE1000,250h value of 17.81%, whereas the 15°, 30°, and 45° configurations produced values of 19.35%, 20.00%, and 19.24%, respectively. The 45° configuration therefore had a lower ASE1000,250h than the 15° and 30° alternatives but a 1.43-percentage-point higher ASE1000,250h than the 0° configuration. Moreover, all four configurations exceeded the 10% ASE1000,250h criterion described in Section 2.2.1. The 45° lightwell was therefore selected as the preferred daylight-availability configuration rather than the minimum-ASE alternative, and its excessive-sunlight result confirmed the need for subsequent high-window, light-shelf, and solar-control optimization.
The interaction between sky-view access, lightwell shape, surface inclination, and diffuse daylight distribution can explain the improved performance of the 45° angled lightwell. A vertical or low-angle lightwell tends to concentrate daylight near the shaft and upper wall surfaces, reducing the amount of light that reaches the lower occupied zone [24]. In contrast, the 45° open lightwell increases the inclined surface area exposed to the upper sky and redirects diffuse daylight toward the deeper reading area. This angular placement allowed daylight to penetrate beyond the perimeter zone, improved interior light distribution, and provided a balance between daylight admission and excessive-sunlight control among the tested cases.
3.2.2. Angular light shelf for enhanced daylight reach
The next design strategy tested was the angular light shelf. Light shelves are known for their ability to reflect daylight toward the ceiling, spreading the light further deep into the room. Several depths and tilt angles of the light shelves were tested to determine the most effective configuration for daylight penetration and glare control.
The 45° angular lightwell placement configuration was used as the baseline for the second-stage façade-retrofit analysis. The baseline model retained the selected lightwell angle but did not include the optimized high-window or light-shelf configurations.
The retrofit model incorporated high windows and angular light shelves to redirect daylight toward the ceiling and deeper into the reading space, as shown in Figure 10.
Figure 10
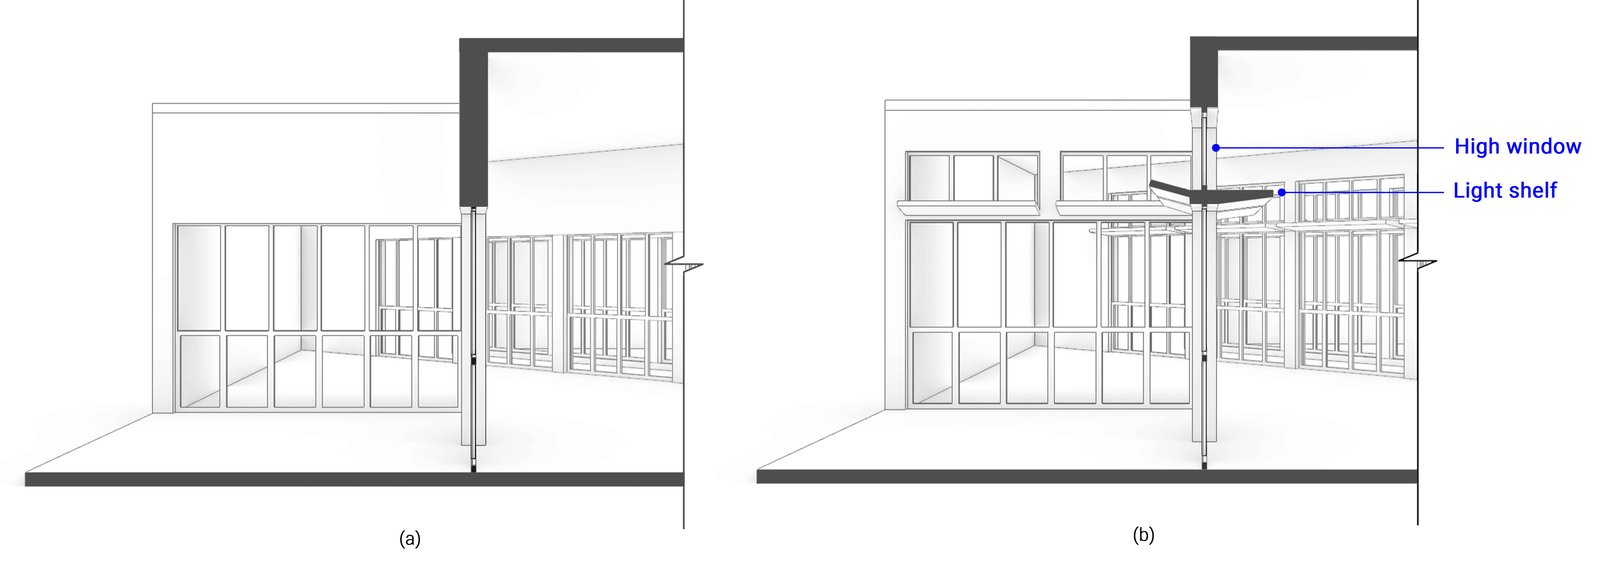
Fig. 10. Geometric comparison of the second-stage façade configurations: (a) Selected 45° angled lightwell base model without the high window and light shelf; and (b) Retrofit model incorporating the high-window opening and light shelf.
For the point-in-time illuminance simulation shown in Figure 11, a 45 ° angled lightwell base model (with no high window and light shelf) had a mean work-plane illuminance of 820 lux and a median of 181 lux (Table 5). In contrast, the façade-retrofited model had a mean of 952 lux and a median of 370 lux. Figure 12 presents the separate annual average-illuminance output, which increased from 2204 lux in the base model to 2344 lux in the façade-retrofit model. The two figures, therefore, represent different simulation outputs: Figure 11 shows the monitored point-in-time illuminance at 02:30 PM on 25 June 2025, while Figure 12 shows the annual average illuminance distribution. The angular light shelf redirected daylight toward the ceiling and deeper into the reading area, contributing to the increase in sDA300/50% from 49.12% to 58.03% (Figure 13).
Table 5
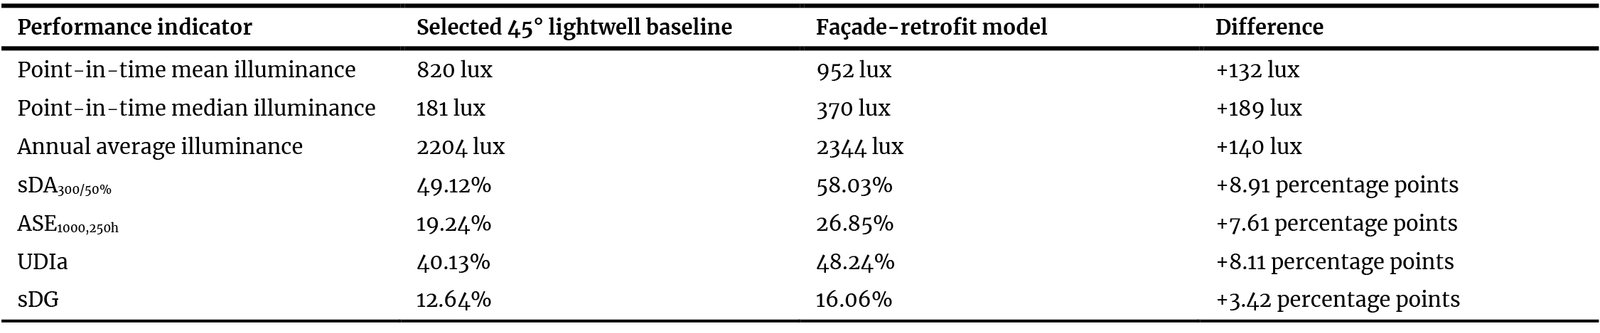
Table 5. Daylight-performance values corresponding to Figure 11 - Figure 16.
Figure 11
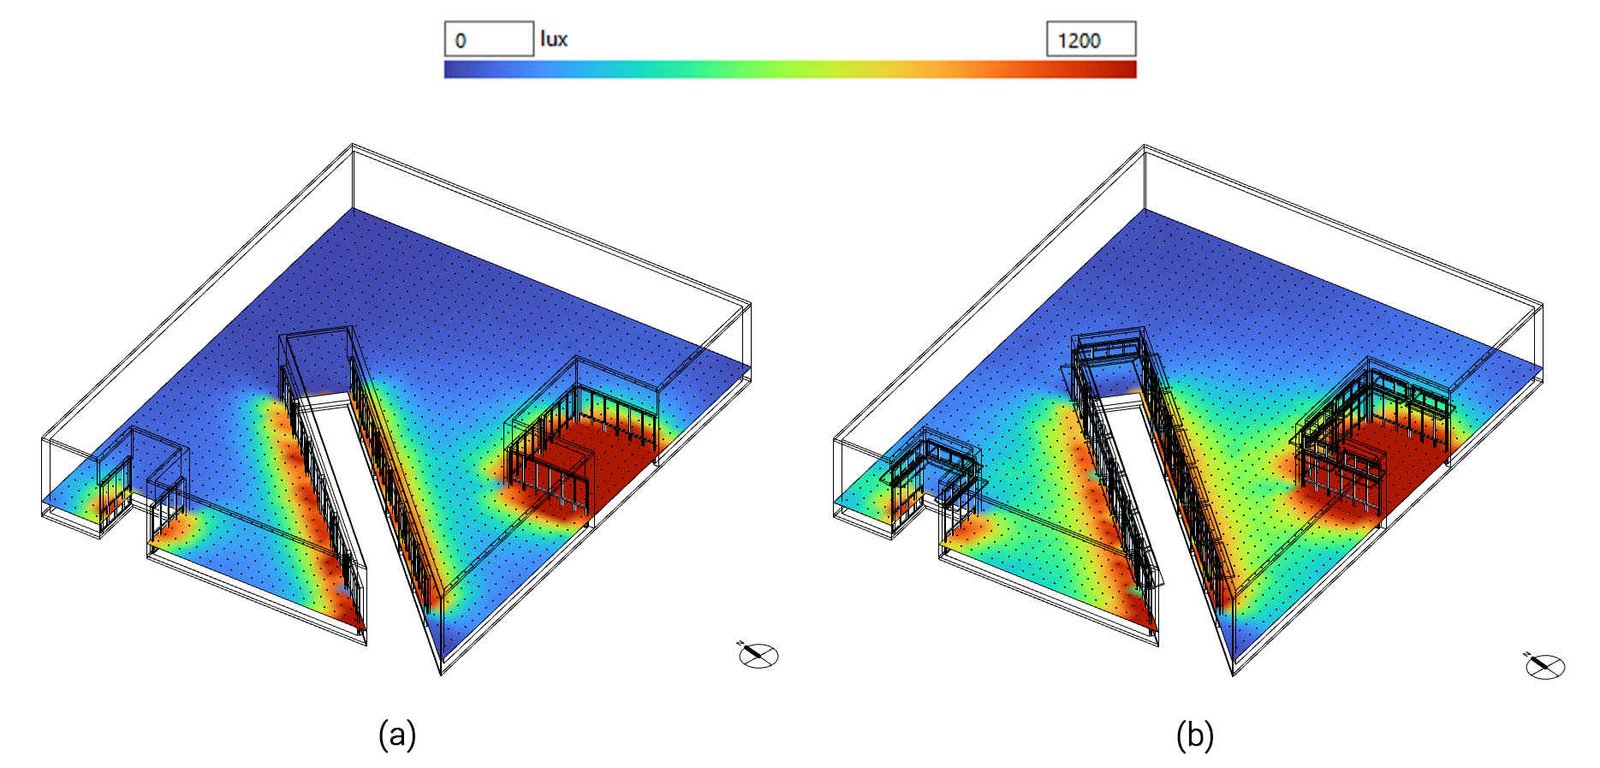
Fig. 11. Point-in-time work-plane illuminance distribution at 02:30 PM on 25 June 2025: (a) Selected 45° angled lightwell base model; and (b) Façade-retrofit model with optimized high windows and light shelves. Both panels use the same illuminance scale in lux.
Figure 12
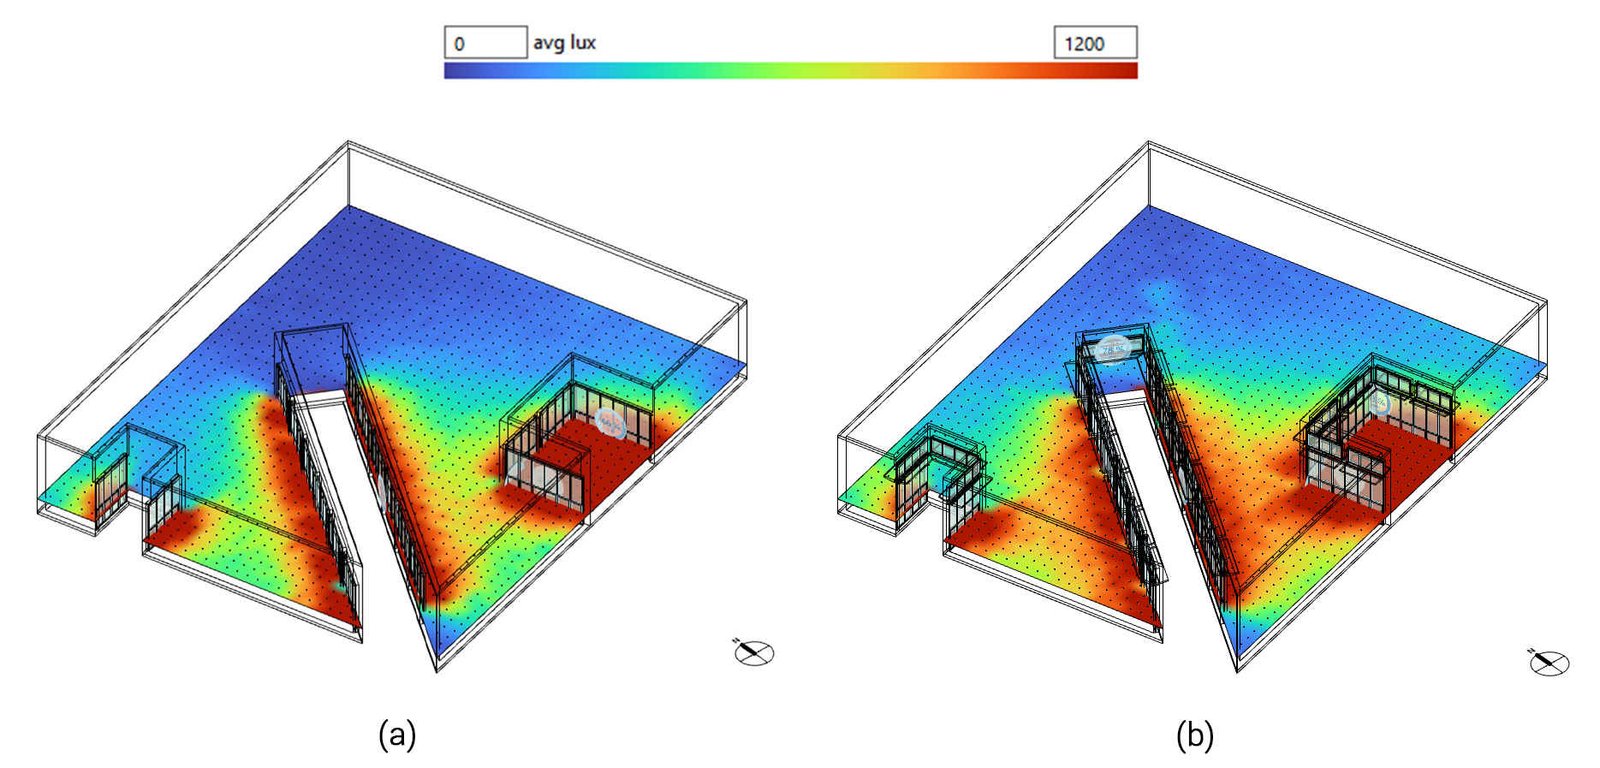
Fig. 12. Annual average work-plane illuminance distribution: (a) Selected 45° angled lightwell base model; and (b) Façade-retrofit model with optimized high windows and light shelves. Both panels use the same illuminance scale in lux.
Figure 13
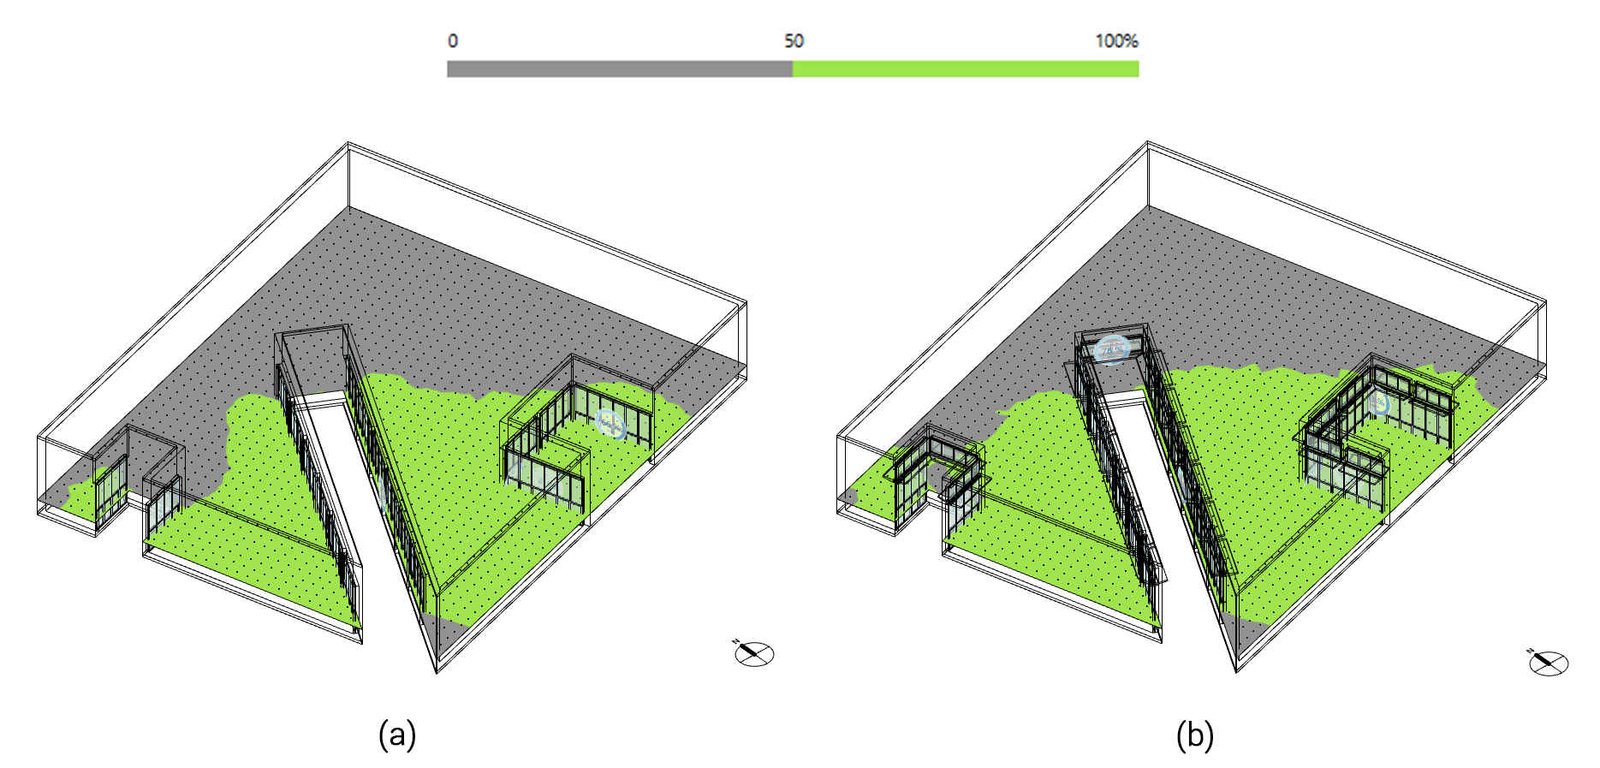
Fig. 13. Spatial daylight autonomy (sDA300/50%) comparison: (a) Selected 45° angled lightwell base model; and (b) Façade-retrofit model.
The retrofit also increased ASE1000,250h from 19.24% to 26.85% (Figure 14), showing a daylight–glare trade-off. Although the light shelf improved daylight penetration and reduced dependence on artificial lighting in deeper areas, additional floor areas received direct or redirected high-intensity daylight. UDIa also increased from 40.13% to 48.24% (Figure 15), indicating that additional areas received useful daylight levels for longer periods.
Figure 14
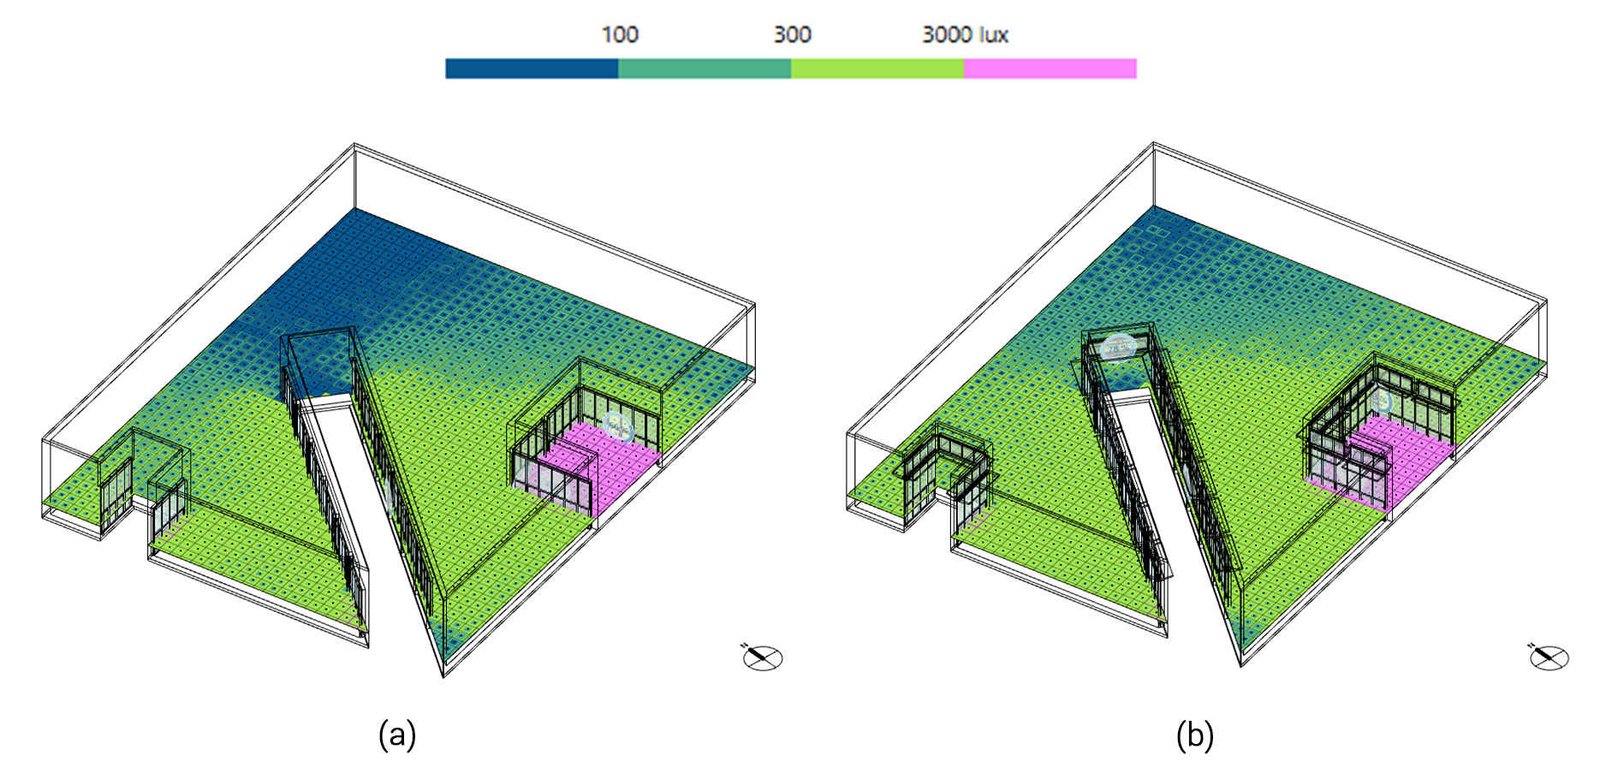
Fig. 14. Annual sunlight exposure (ASE1000,250h) comparison: (a) Selected 45° lightwell base model; and (b) Façade-retrofit model. The highlighted floor area exceeds the ASE1000,250h criterion.
Figure 15
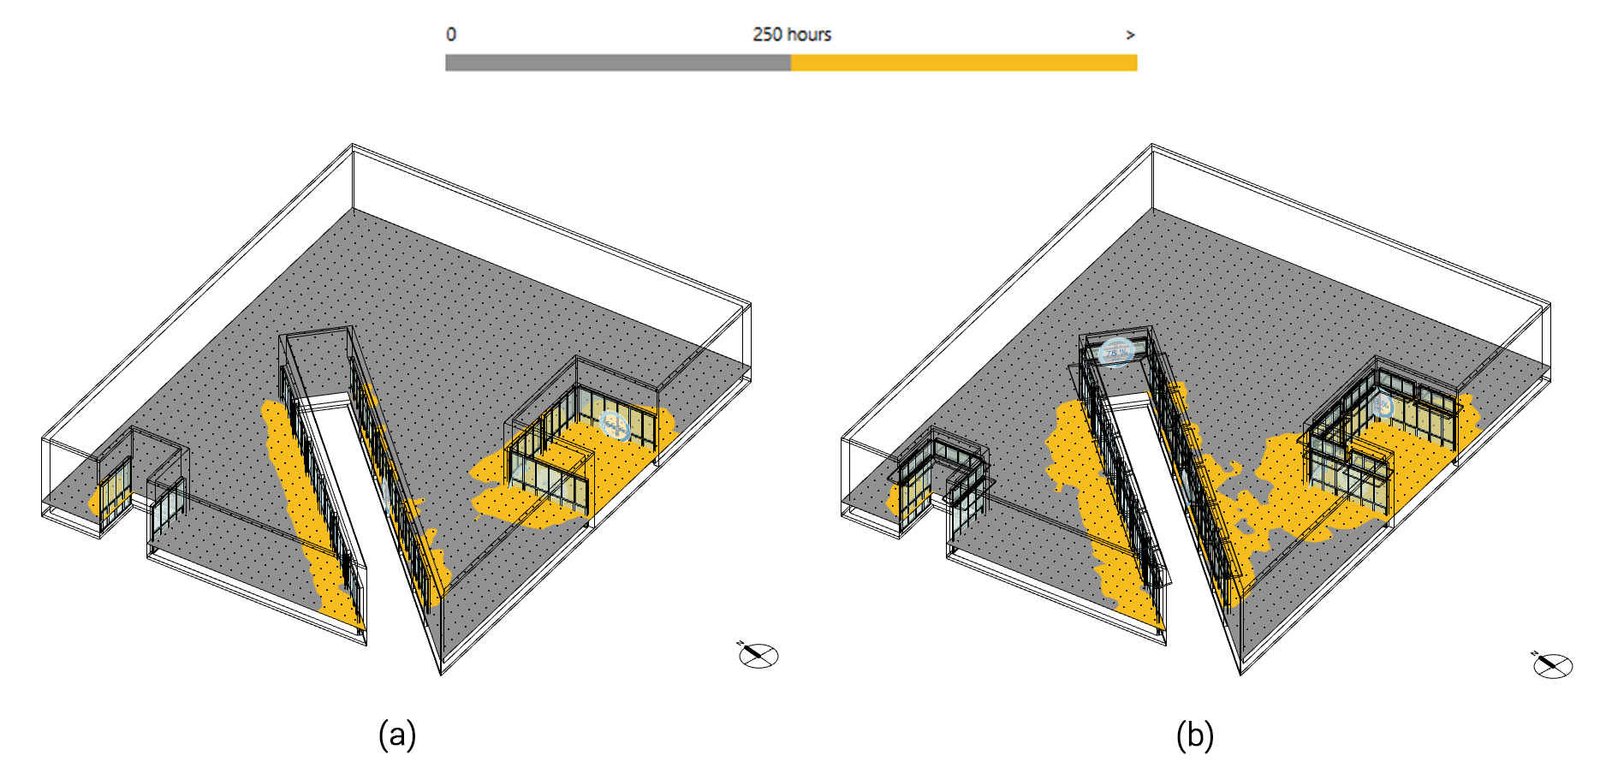
Fig. 15. Useful daylight illuminance (UDI) comparison: (a) Selected 45° lightwell base model; and (b) Façade-retrofit model. The color scale identifies the illuminance categories used in the UDI analysis.
The angular light shelf, therefore, improved daylight quality but still required refinement in shelf angle, shelf depth, surface reflectance, and orientation-specific control to reduce ASE1000,250h and glare risk.
sDG increased from 12.64% in the selected lightwell baseline to 16.06% in the façade-retrofit model (Figure 16), indicating that a larger proportion of evaluated views experienced disturbing or intolerable glare for the specified annual threshold. The retrofit improved daylight availability but increased the risk of glare near the south-facing terrace opening and the glazed-door area; therefore, the shelf geometry required further refinement.
Figure 16
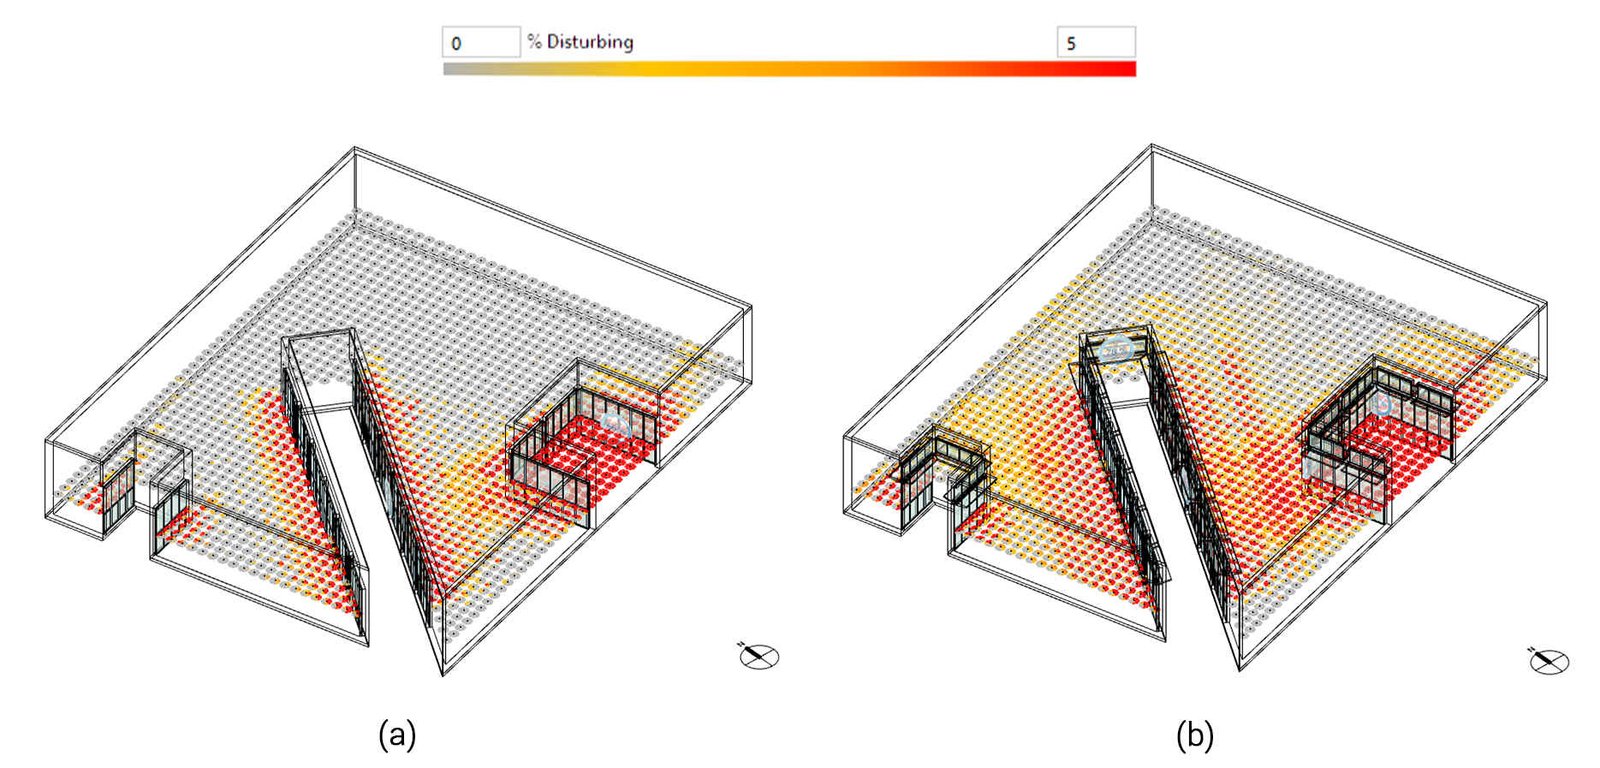
Fig. 16. Annual disturbing-glare (sDG) frequency comparison: (a) Selected 45° lightwell base model; and (b) Façade-retrofit model. The color scale represents the percentage of occupied hours classified as disturbing or intolerable glare for each evaluated view direction.
Shelf-angle performance varied by orientation because the south and west openings received different levels of solar exposure. The south-facing opening receives stronger high-angle daylight around midday in Dhaka, so a moderate shelf angle, such as 15°, can redirect light toward the ceiling without producing excessive brightness at the reading plane. The west-facing opening receives lower-angle afternoon sunlight that penetrates deeper and can create stronger contrast. A steeper shelf angle, such as 30°, could be effective on the west side because the shelf redirects low-angle sunlight upward before the light reaches the work plane. This orientation-specific behavior indicates that south- and west-facing light shelves should not use identical angles. The highlighted floor area satisfies the sDA300/50% criterion.
3.3. Energy performance optimization with shading and ventilation
EUI was assessed for the Base Case model and two updated design scenarios to compare energy performance changes associated with façade modification, high-window placement, light-shelf integration and the modeled natural ventilation scenario. The studied cases used consistent simulation assumptions.
In the Base Case model, the existing WWR and shading conditions were retained, and natural ventilation was excluded. The simulated site EUI was 81.63 kWh/(m²·y) (Figure 17). In Updated Case 1, the WWR was increased, and high windows were added without natural ventilation, thereby reducing the simulated site EUI to 79.31 kWh/(m²·y), equivalent to a 2.85% reduction relative to the Base Case. In Updated Case 2, maximized WWR, high windows, light shelves, and natural ventilation were combined, reducing simulated site EUI to 63.92 kWh/(m²·y), equivalent to a 21.70% reduction relative to the Base Case. These values represent comparative outcomes obtained under consistent simulation assumptions.
Figure 17
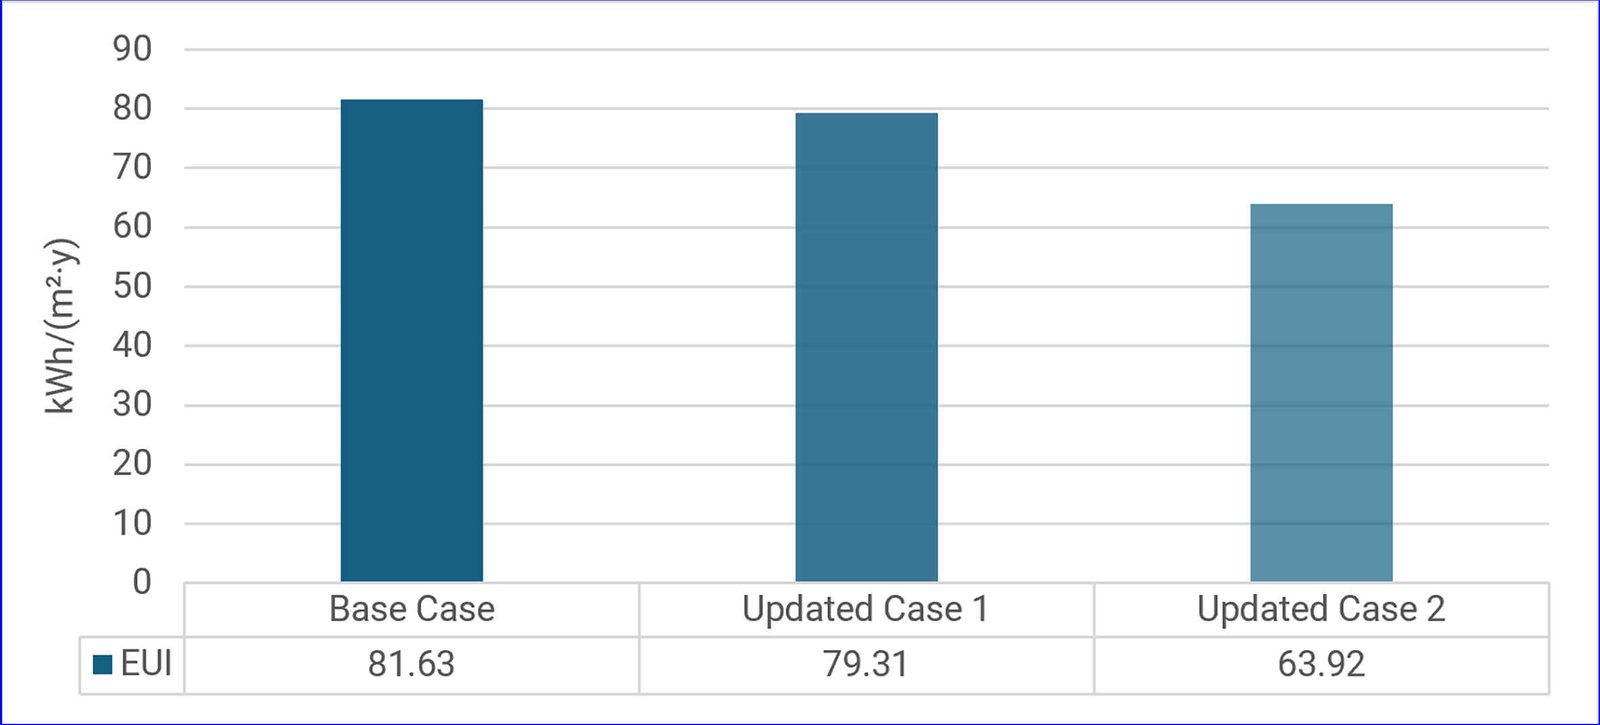
Fig. 17. Comparative modeled energy use intensity (EUI) across the principal design scenarios.
3.4. Iterative optimization
The iterative optimization process was carried out in two phases to systematically explore and refine key design variables. The purpose was to identify the optimal balance between daylighting and energy performance, maximizing sDA300/50% while minimizing ASE1000,250h and EUI. Three scenario categories were defined: the base/test daylight-retrofit comparison; the highest-sDA300/50% genome; and the best-fitness genome. The base/test comparison reports the selected daylight retrofit case, the highest sDA300/50% genome reports the single design with maximum daylight autonomy, and the best-fitness genome reports the highest composite score based on sDA300/50%, ASE1000,250h and EUI. These categories serve different purposes and are reported separately.
3.4.1. The best sDA300/50% genome
During MOO, Genome no. 8 achieved the highest sDA300/50% value of 58.96% (Table 6). This value represents only the highest sDA300/50% genome, not the final daylight retrofit scenario or the best-fitness genome selected through the weighted fitness function. The best-fitness ranking considered multiple criteria rather than relying only on maximum sDA300/50%, minimum ASE1000,250h, or minimum EUI separately.
Table 6
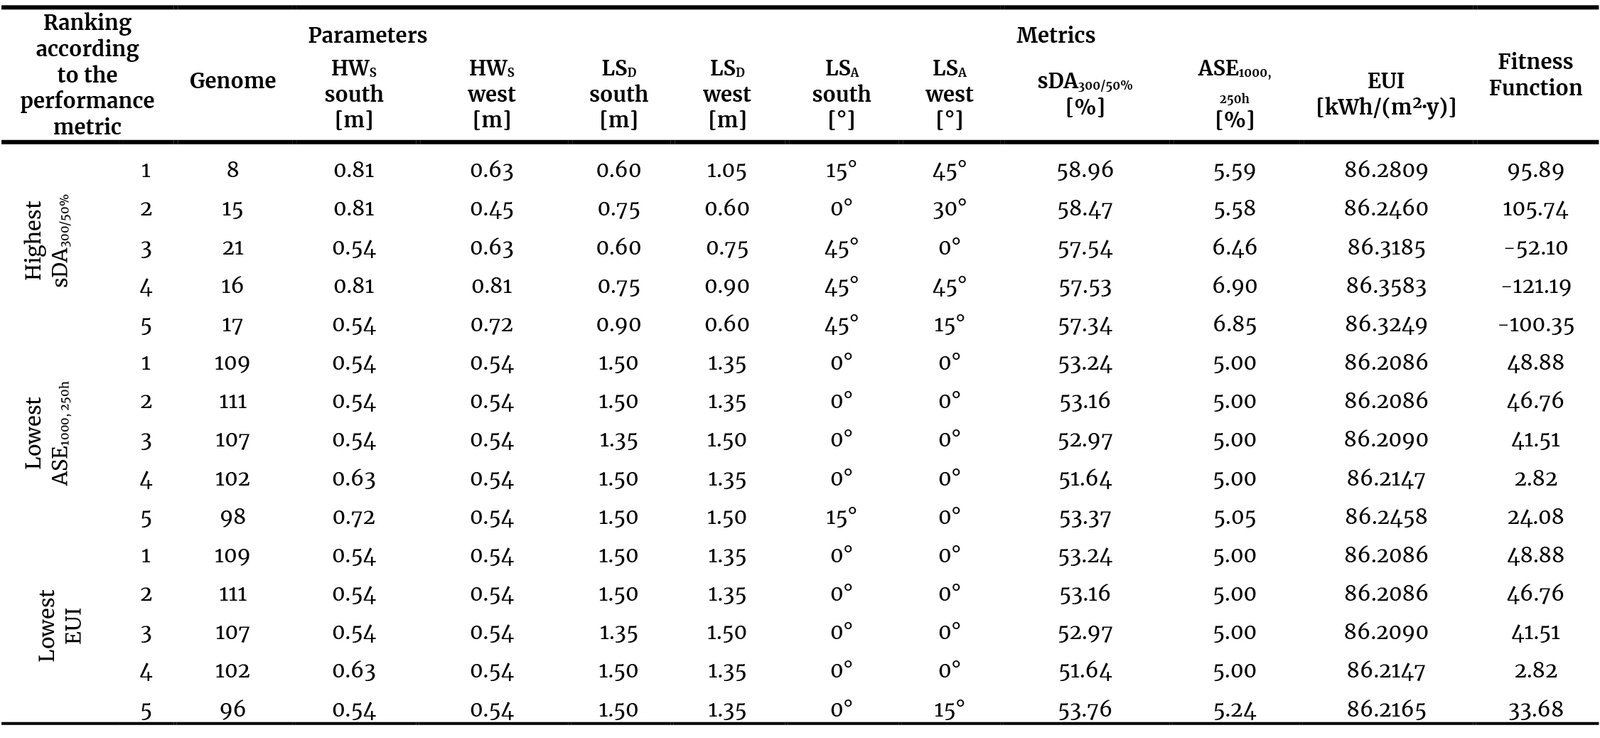
Table 6. Genomes with the highest sDA300/50%, lowest ASE1000,250h, and lowest EUI.
3.4.2. The best ASE1000,250h genome
The optimization dataset contained four genomes- 109, 111, 107, and 102, that achieved the tied minimum ASE1000,250h value of 5.00% (Table 6). Genome 109 was selected as the representative minimum-ASE solution because it achieved the highest sDA300/50% among the tied alternatives, with sDA300/50% = 53.24%, and also achieved the joint-lowest EUI of 86.2086 kWh/(m²·y). The result should therefore be described as a tied minimum rather than as a unique minimum achieved only by Genome 109.
3.4.3. The best EUI genome
Table 6 shows that Genomes 109 and 111 achieved the joint-lowest EUI value of 86.2086 kWh/(m²·y). Genome 109 was retained as the representative minimum-EUI solution because it achieved a slightly higher sDA300/50% value of 53.24%, compared with 53.16% for Genome 111, while both genomes achieved ASE1000,250h = 5.00%. These values represent the lowest EUI results within the optimization dataset and should not be confused with the separate principal EUI scenarios reported in Section 3.3.
3.4.4. The best optimum genome
The Octopus simulation evaluated 220 combinations in the reported optimization dataset to identify Pareto Front solutions that balance sDA300/50%, ASE1000,250h and EUI. The best-fitness genome was selected using the composite fitness function, which balances sDA300/50%, ASE1000,250h and EUI (Figure 18). For this reason, the genome with the highest fitness was not necessarily the genome with the highest sDA300/50%. Genome no. 15 achieved the highest fitness score, with sDA300/50% = 58.47%, ASE1000,250h = 5.58% and EUI = 86.2460 kWh/(m²·y) (Table 7). This result is reported separately from the highest-sDA300/50% genome to distinguish single-metric and multi-objective optimization outcomes.
Figure 18
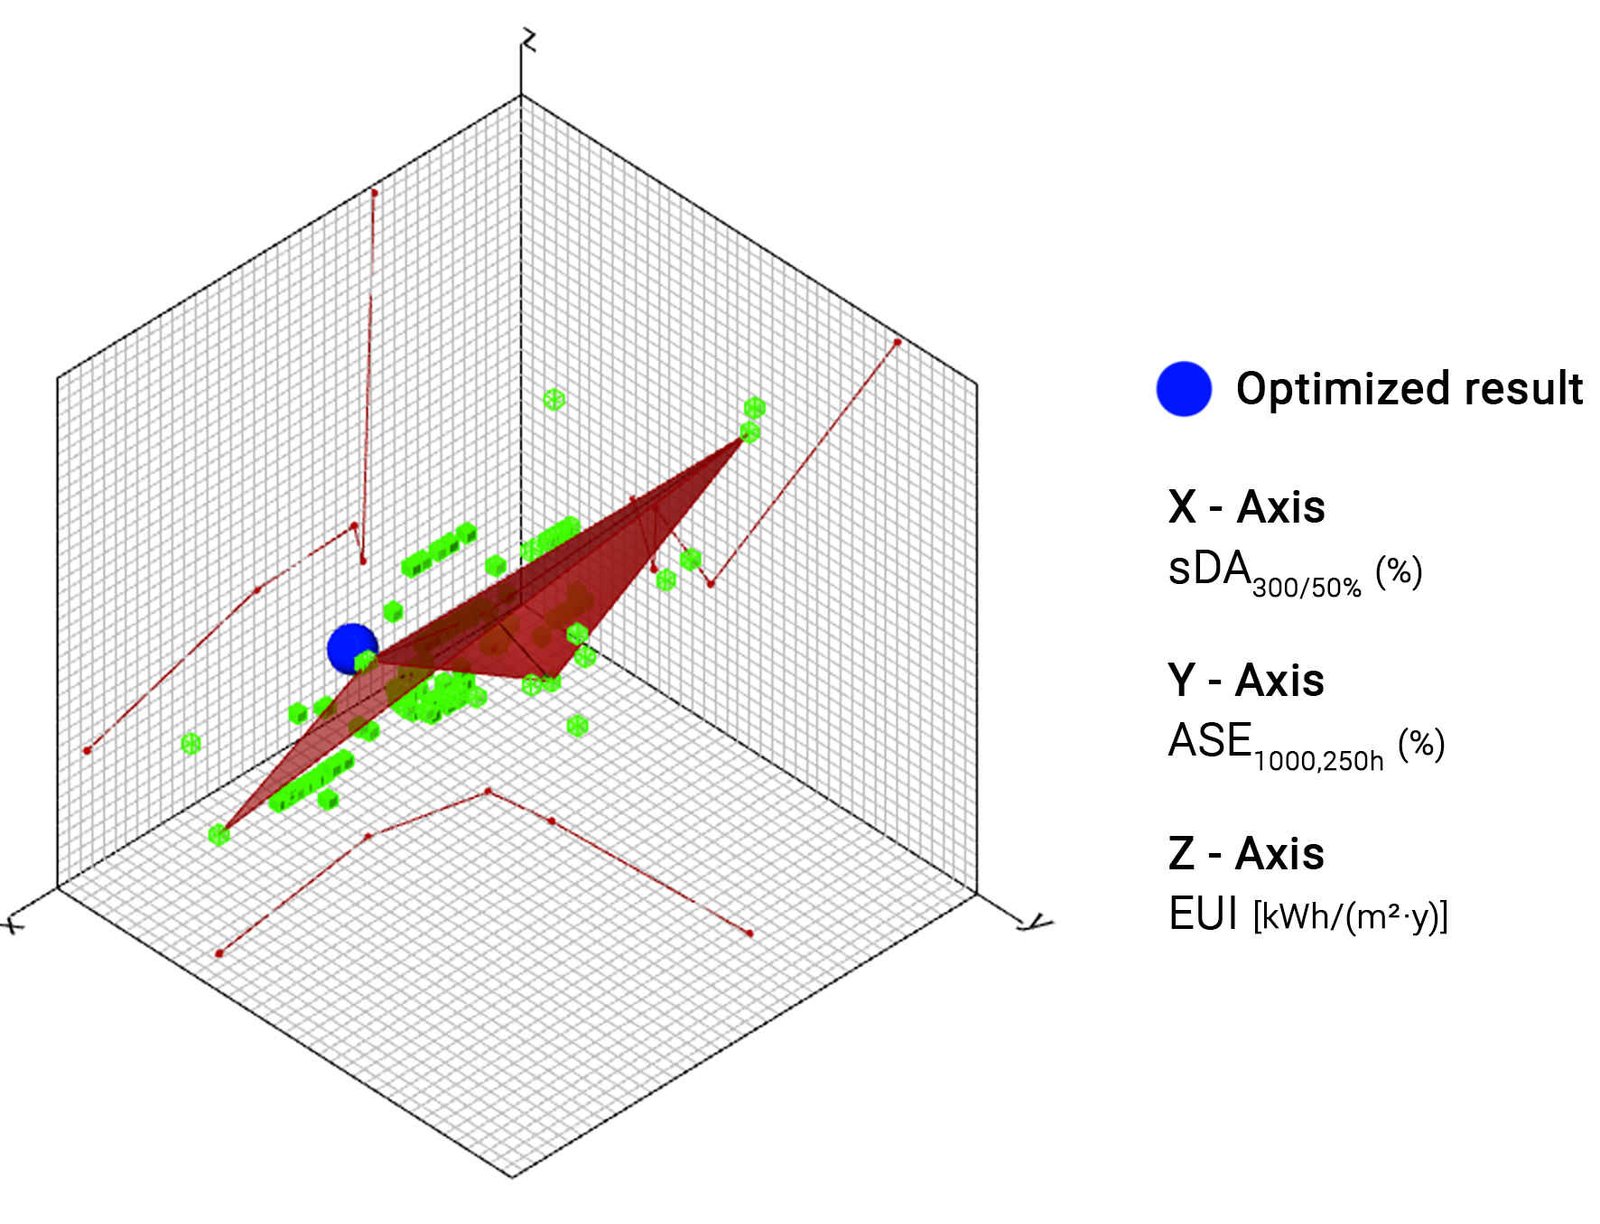
Fig. 18. Three-dimensional Pareto-front representation of the 220 simulated design alternatives based on sDA300/50%, ASE1000,250h, and EUI. Green markers represent the simulated alternatives, the red mesh identifies the Pareto-optimal trade-off region, and the blue marker identifies the selected best-fitness solution, Genome 15, with sDA = 58.47%, ASE = 5.58%, and EUI = 86.2460 kWh/(m²·y). Higher sDA and lower ASE and EUI indicate better performance.
Table 7
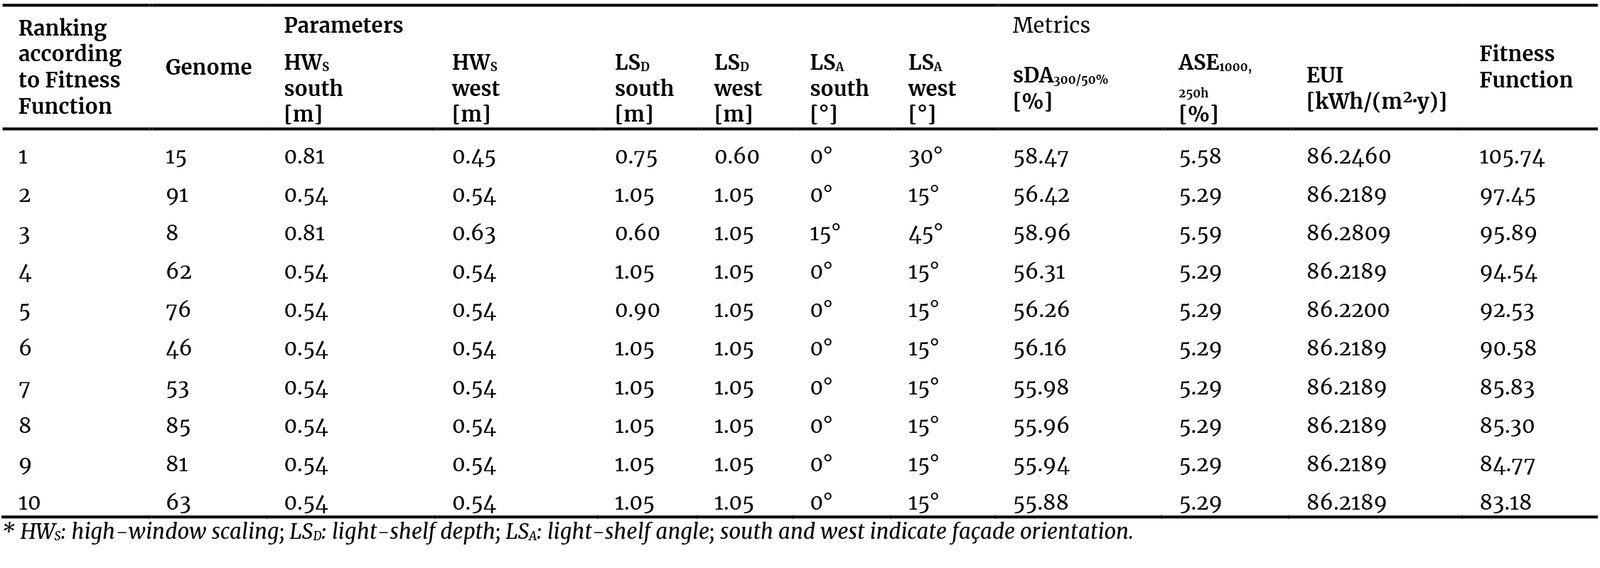
Table 7. Genomes with the highest fitness function value.
To optimize the building façade, the Design Explorer was employed to visualize and examine the solutions generated by Octopus. The dataset, saved in CSV format, was uploaded to the Design Explorer website, where it was analyzed graphically using parallel coordinates plots. These plots enabled exploration of various façade combinations and their performance with respect to daylight availability and energy use. Figure 19(a) shows 220 façade combinations and their corresponding performance in terms of daylight availability and energy use. The independent parameters include the following.
- High window scaling: South and west high windows, range 0.5 to 0.9 of 0.9 m (3 feet) height.
- Light shelf depth: South and west light shelves range from 0.4 to 1.0 of 1.5 m (5 feet) in depth.
- Light shelf angle: South and west light shelves, range 0 to 4; where 0 = 0°, 1 = 15°, 2 = 30°, 3 = 45°, 4 = 60°.
Figure 19
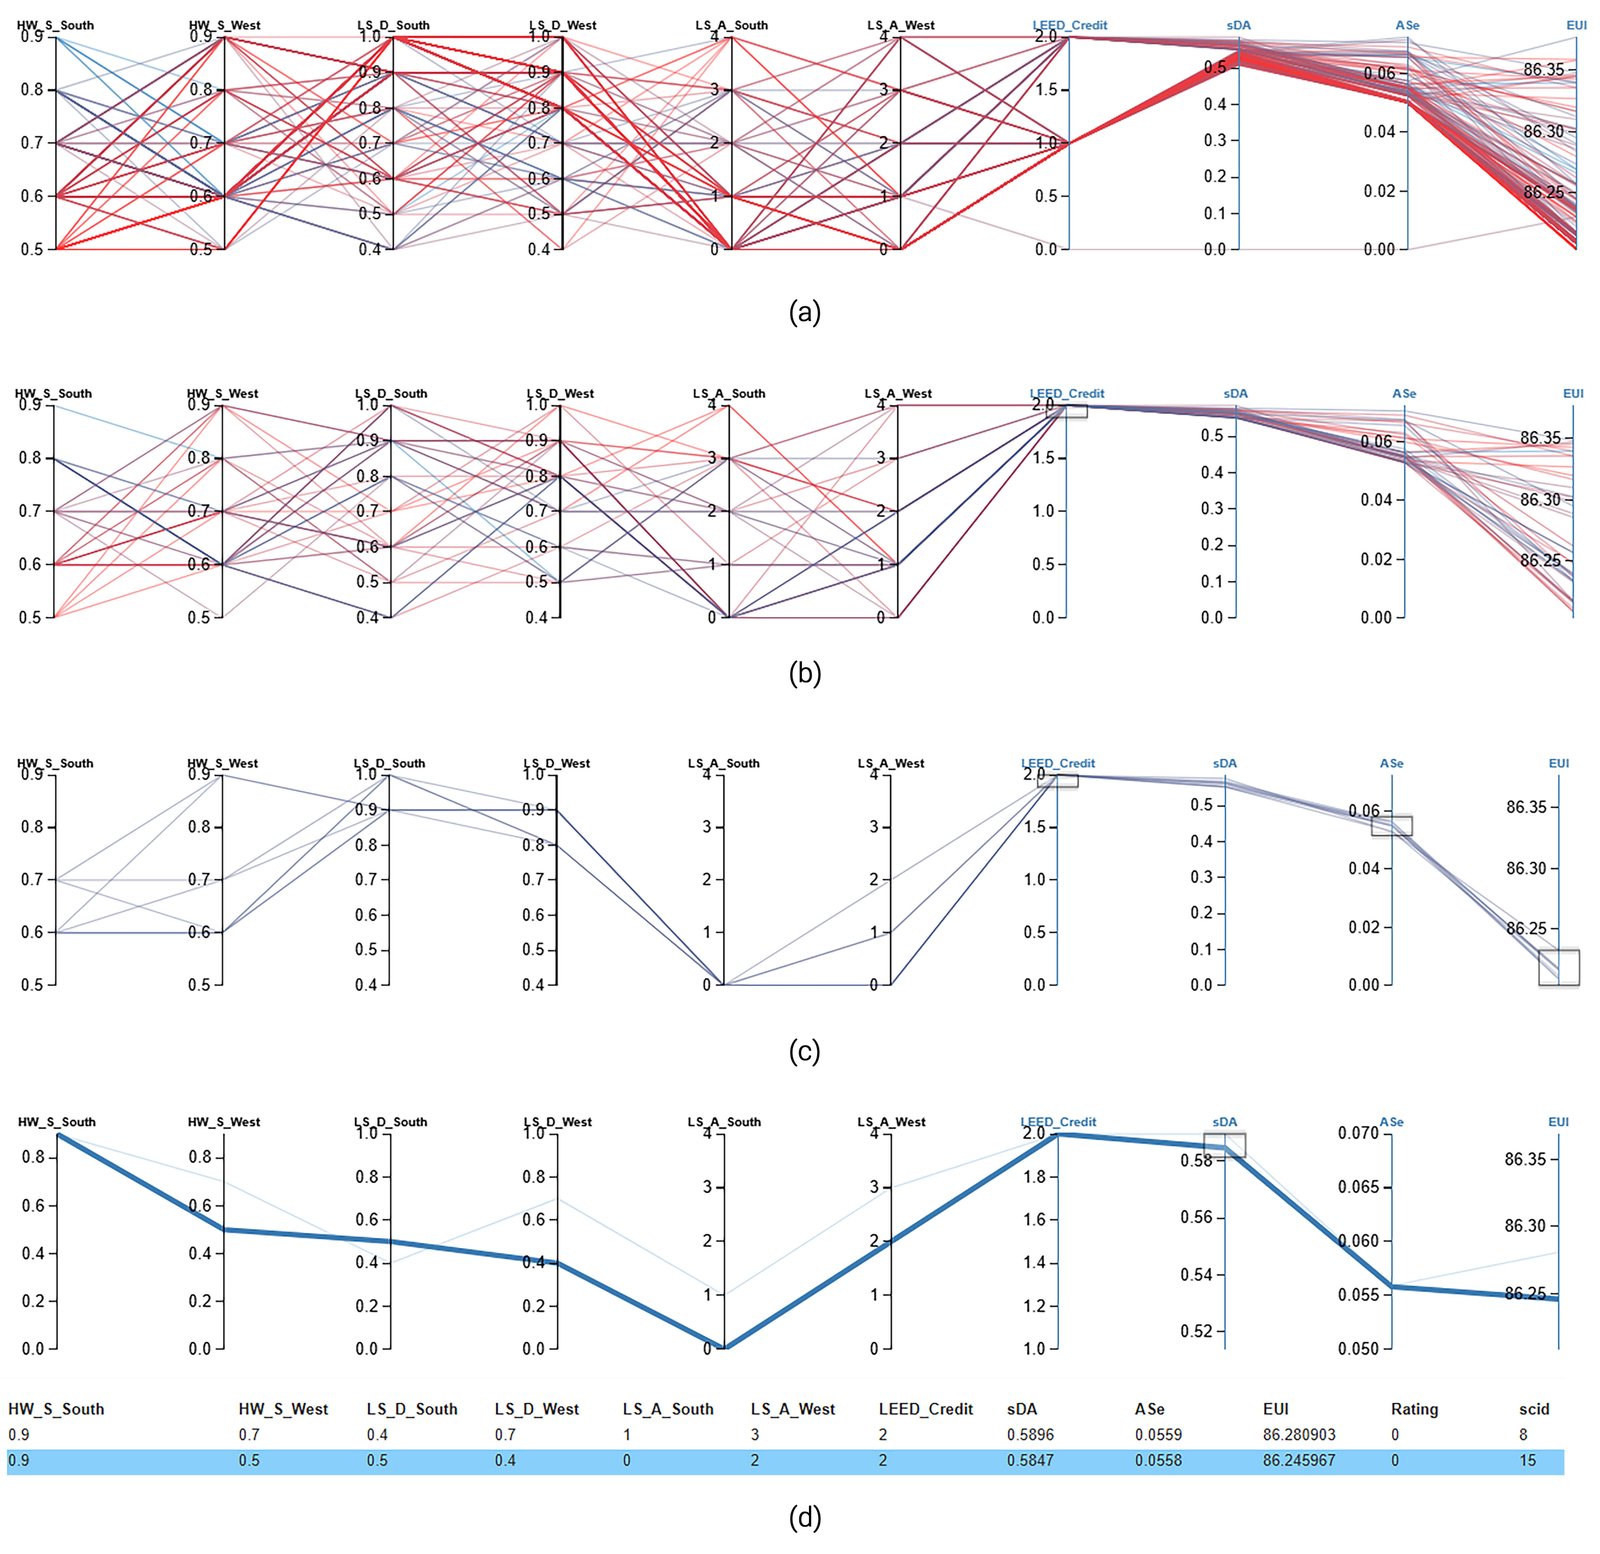
Fig. 19. Sequential filtering of the simulated façade alternatives in Design Explorer: (a) Complete set of 220 alternatives; (b) Alternatives satisfying LEED daylight credit ≥ 2; (c) Alternatives satisfying LEED daylight credit ≥ 2, ASE1000,250h ≤ 6%, and EUI ≤ 86.25 kWh/(m²·y); and (d) Alternatives additionally satisfying sDA300/50% ≥ 58%. Blue lines represent alternatives satisfying the active filters, while red or unhighlighted lines represent excluded alternatives.
The dependent metrics were sDA300/50%, ASE1000,250h and EUI. In Figure 19, optimal solutions are highlighted in blue, while the less successful ones are left unmarked. Figure 19(b) applies a filter to ensure that only solutions with a LEED credit of 2 or higher are considered. This filter refines the set of solutions, with blue and red lines indicating the successful and unsuccessful solutions, respectively. At this stage, the sDA300/50% filter has not yet been applied. Figure 19(c) introduces additional filters to refine further the solutions, namely ASE1000,250h ≤ 6% and EUI ≤ 86.25 kWh/(m2·y). These filters narrowed down the number of feasible solutions, and the blue lines now represent the solutions that meet the refined criteria. Figure 19(d) applies a stricter constraint to the sDA300/50%, increasing it to ≥ 58%, while keeping the same limits for ASE1000,250h and EUI. This tighter filter results in a set of optimized solutions, with blue lines indicating the façade combinations that meet the selected criteria, emphasizing both energy efficiency and daylight optimization.
By progressively applying these filters, the genome no. 15 was identified as the best-performing solution, meeting the desired sDA300/50% (≥58%), ASE1000,250h (≤6%) and EUI ≤ 86.25 kWh/(m²·y) constraints. Genome 15 was identified as a non-dominated solution on the Pareto Front, ranked first by the weighted fitness function, and met the final Design Explorer filters. Together, these three analytical outputs supported its selection as the preferred balanced solution for achieving high daylight availability, lower glare risk and minimal energy use. The analysis through Pareto Front, fitness function and parallel-coordinate plots consistently supported the selection of the best-performing solutions based on the defined objectives.
3.5. Scenario-based PV-offset assessment
A zero-energy building is usually defined through an annual energy balance. In this balance, on-site renewable energy generation is compared with building energy demand. The goal is to offset the total delivered energy over a year [67,68]. In this study, measured annual energy consumption data or sub-metered end-use data were also not available; therefore, hourly whole-building meter data were not included in the analysis. There were no PVs installed at the building, so the measured PV-generation data could not be used. For this reason, the PV-offset results are based solely on simulation and are treated as modeled scenarios under consistent assumptions. The PV-offset cases in this section are separate whole-building scenario models and should not be confused with the principal comparative EUI cases reported in Section 3.3 or the genome-level EUI results reported in Section 3.4. The relationships among these separate analytical model categories are discussed in Section 4.
In PV-offset Scenario 0, a modeled reference PV configuration was applied to the whole-building energy model, as shown in Figure 20(a).
Figure 20
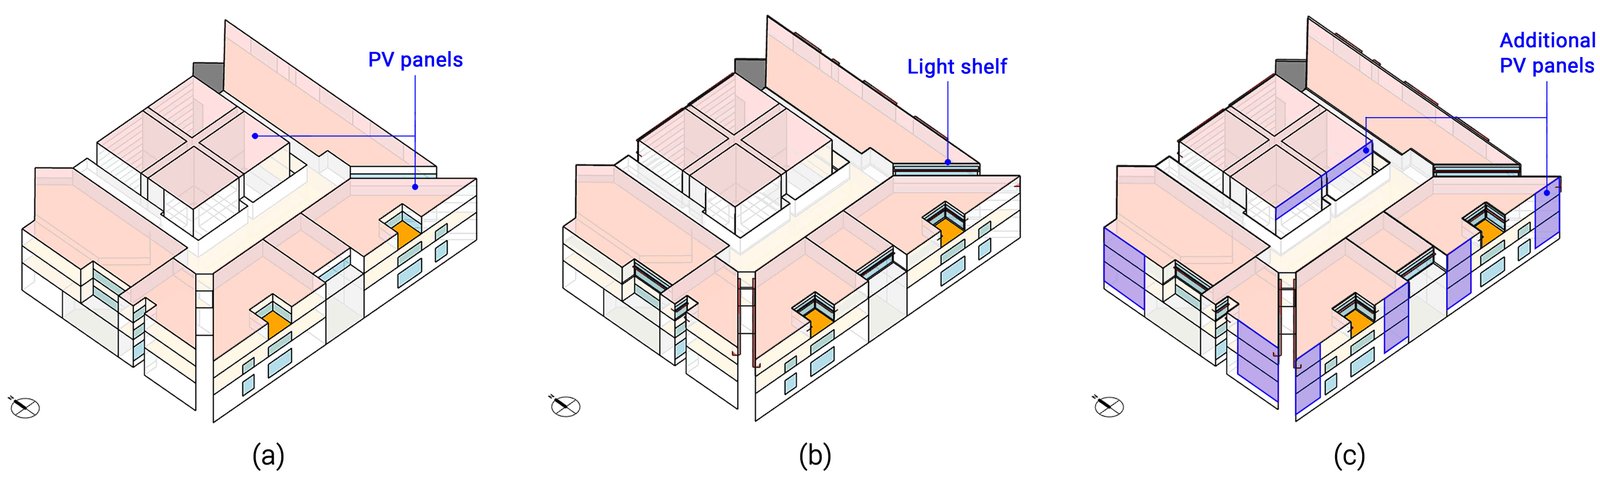
Fig. 20. Whole-building configurations for the PV-offset assessment: (a) Reference case; (b) Optimized light shelf with modeled natural ventilation; and (c) Additional roof-mounted PV panels.
Without the optimized light shelf, modeled natural-ventilation condition, or additional PV capacity, the modeled site EUI was 78.87 kWh/(m²·y), modeled annual energy use was 586,806.88 kWh/y, and modeled annual PV generation was 464,072.30 kWh/y, as summarized in Table 8.
Table 8
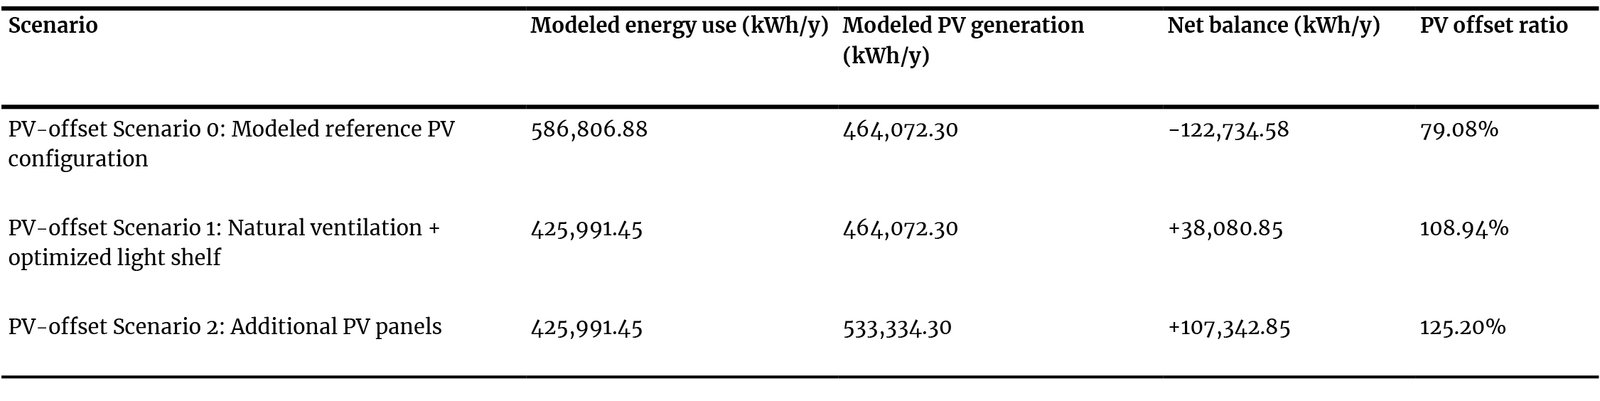
Table 8. Modeled energy use and PV generation for each PV-offset scenario.
In PV-offset Scenario 1, the optimized light shelf and modeled natural-ventilation condition were incorporated into the reference configuration, while the WWR and modeled reference PV capacity remained unchanged from Scenario 0, as shown in Figure 20(b). The natural-ventilation assumption was used as a comparative operational condition, while the light shelf was included to improve daylight penetration and support solar-control performance. The modeled site EUI decreased from 78.87 to 57.13 kWh/(m²·y), representing a simulated reduction of approximately 27.6%. Modeled annual energy use decreased to 425,991.45 kWh/y, while modeled PV generation remained 464,072.30 kWh/y. These values represent a scenario-based estimate rather than verified airflow, thermal comfort, daylight, or operational energy performance.
In PV-offset Scenario 2, additional PV panels were added to the Scenario 1 configuration, as shown in Figure 20(c). Modeled annual PV generation increased from 464,072.30 to 533,334.30 kWh/y, while modeled annual energy use and site EUI remained unchanged at 425,991.45 kWh/y and 57.13 kWh/(m²·y), respectively. This scenario, therefore, represents increased modeled renewable-energy generation rather than a further reduction in building energy demand.
These findings indicate potential improvements in PV offset under the stated simulation assumptions. The relationships among the daylight, comparative-EUI, optimization, and whole-building PV-offset models are discussed separately in Section 4 and summarized in Table 9.
Table 9
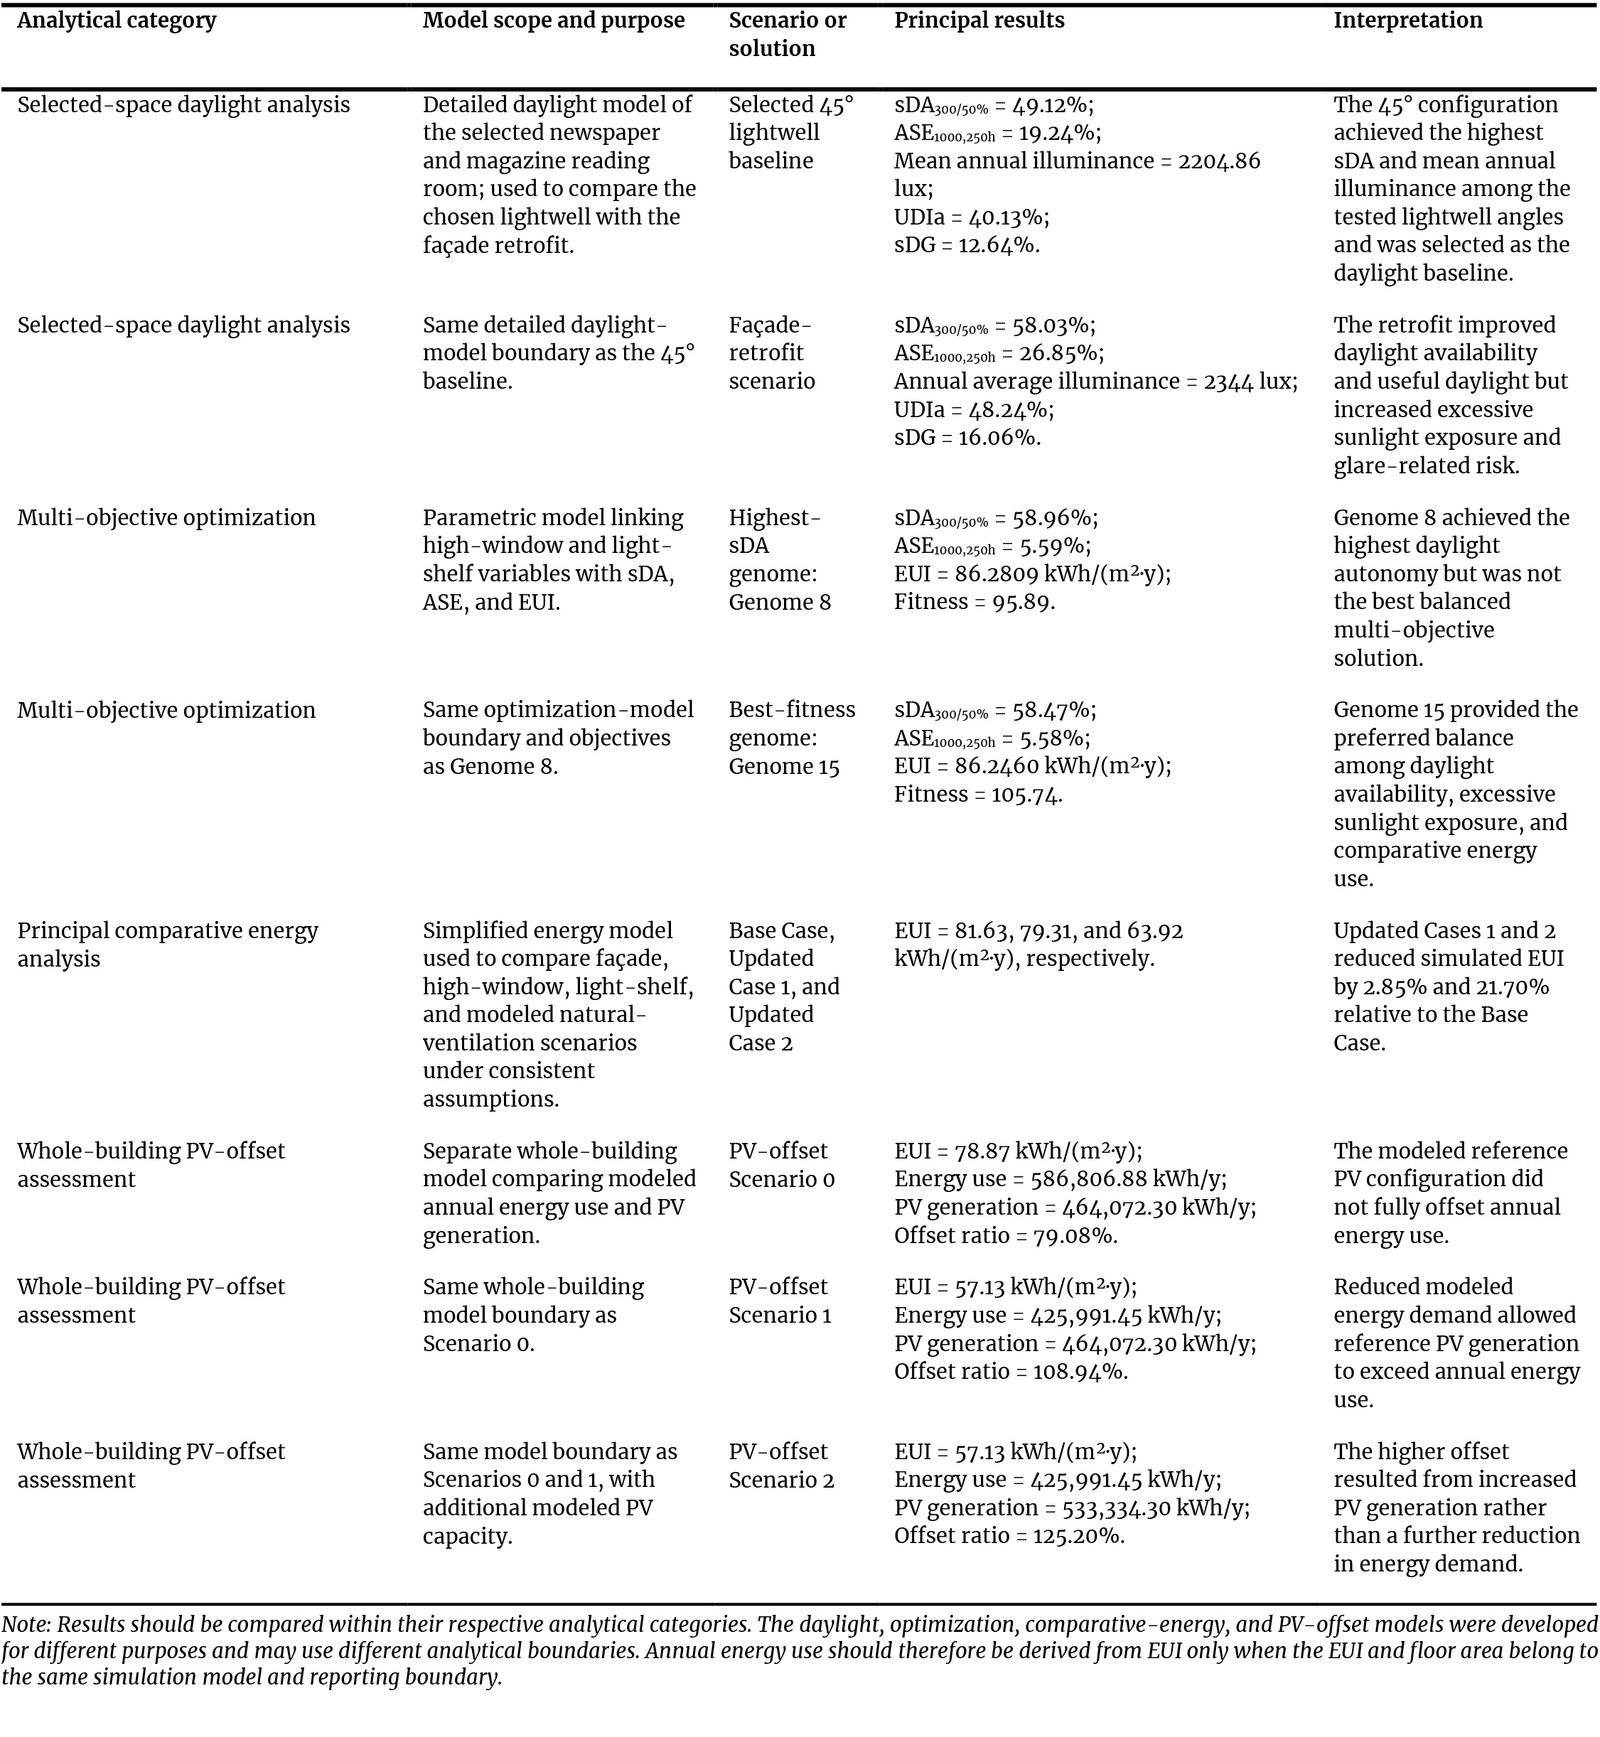
Table 9. Audited daylight and energy values reported for each scenario category.
4. Discussion
The integration of the selected 45° lightwell with high windows and light shelves improved daylight availability in the deep-plan reading space but produced a clear visual-comfort trade-off. Compared with the selected lightwell baseline, the façade-retrofit model increased sDA300/50% from 49.12% to 58.03% and UDIa from 40.13% to 48.24%. However, ASE1000,250h increased from 19.24% to 26.85%, while sDG increased from 12.64% to 16.06%. The retrofit therefore improved daylight sufficiency but did not reduce excessive sunlight exposure or glare-related risk, confirming the importance of evaluating façade performance through multiple daylight metrics [5,15].
The lightwell and optimization results also depended on the performance objective. The 45° lightwell achieved the highest sDA300/50% and mean annual illuminance, whereas the 0° configuration achieved the lowest ASE1000,250h. The 45° configuration was therefore selected as the preferred daylight-availability alternative rather than the minimum-ASE solution. This result supports previous findings that lightwell geometry and orientation substantially influence daylight distribution within deep-plan spaces [24]. Similarly, Genome 8 achieved the highest sDA300/50% of 58.96%, while Genome 15 achieved the best composite fitness with sDA300/50% = 58.47%, ASE1000,250h = 5.58%, and EUI = 86.2460 kWh/(m²·y). These outcomes demonstrate that maximum daylight availability does not necessarily represent the best balanced solution.
Table 9 distinguishes the detailed daylight model, optimization model, principal comparative energy model, and whole-building PV-offset model. The EUI values should be interpreted within their corresponding analytical boundaries. The values of 81.63, 79.31, and 63.92 kWh/(m²·y) belong to the principal comparative energy analysis, whereas 78.87 and 57.13 kWh/(m²·y) belong to the separate PV-offset assessment. Consequently, exact agreement between these categories is not required. Within each individual energy model, however, EUI, annual energy use, and modeled floor area should remain internally consistent.
Overall, the results demonstrate that integrated lightwell and façade modifications can improve daylight and comparative energy performance in a tropical deep-plan library. Nevertheless, the increases in ASE1000,250h and sDG show that improved daylight penetration must be considered together with glare and solar-control requirements. The energy and PV findings should therefore be interpreted as internally consistent, scenario-based performance trends rather than directly interchangeable or independently verified operational results [3,17].
4.1. Limitations
This study has several limitations that should be considered when interpreting the findings. Field validation was limited to 15 sensor points within a single reading space and a single measurement condition on 25 June 2025 at approximately 02:30 PM. The measured data, therefore, provided point-in-time illuminance support for the base daylight model under the monitored condition but do not represent seasonal or year-round daylight performance. Consequently, annual climate-based metrics, including sDA300/50% and ASE1000,250h, remain simulation-derived outcomes. Field measurements provided a point-in-time check of the daylight model. In contrast, the annual daylight, EUI, and PV results were interpreted as comparative simulation outputs rather than independently validated operational performance.
In this research, triangulation was used only for analytical interpretation and not as a separate experimental validation method. The MOO ranking was based on study-specific weights assigned to sDA300/50%, ASE1000,250h and EUI. These weights provided a transparent means of selecting balanced alternatives but do not constitute a universal preference structure. Different weighting assumptions may alter the ranking of the candidate solutions. Future studies may evaluate alternative weighting schemes and conduct sensitivity analyses to assess the robustness of the selected optimal solution.
Natural ventilation was included as a comparative operational scenario in the EUI analysis rather than as a detailed airflow or thermal-comfort model. The study did not include measured air-change rates, indoor air velocity, pressure coefficients, occupant-controlled window-operation schedules, operative temperature, computational fluid dynamics analysis, or thermal-comfort assessment. The reported natural ventilation result should therefore be interpreted as a modeled energy scenario rather than verified airflow or thermal comfort performance.
Glare assessment was based on ASE1000,250h, useful daylight illuminance, and annual glare-related outputs; daylight glare probability was not included as a primary view-dependent optimization metric. Future work should incorporate observer specific DGP simulations, high-dynamic-range image analysis, or comparable view-based methods to assess visual comfort more rigorously.
For energy performance optimization with shading and ventilation analysis, the values represent comparative outcomes obtained under consistent simulation assumptions. The energy model was not independently calibrated against annual utility bills, hourly whole-building meter data, or sub-metered end-use records. Future research should incorporate measured energy consumption, formal model calibration, and uncertainty analysis [32,69].
The research presents a scenario-based assessment of PV offsets. It does not represent independently validated net-zero energy performance. The results were not calibrated against real operational data and do not provide evidence of verified net-zero energy performance. Because measured annual energy use and measured PV generation were unavailable, the results are interpreted as scenario-based offset estimates rather than verified operational energy performance.
The investigation examined one deep-plan reading space within a single public library. The numerical results should therefore not be generalized directly to all tropical library buildings. The study's transferable contribution lies primarily in its integrated workflow for evaluating lightwell placement, façade geometry, daylight sufficiency, excessive sunlight exposure, glare-related performance and comparative energy implications. Further testing across different room depths, orientations, occupancy patterns, library types and tropical climates is required to establish broader applicability.
5. Conclusion
This study evaluated void- and facade-based daylight strategies for the Bangladesh National Library building, focusing on improving daylighting in a deep-plan reading space. Diagonal lightwell placement, high windows, and angular light shelves were tested as integrated passive strategies. The diagonal one-side open lightwell helped daylight reach deeper interior zones, while the light shelf improved daylight redistribution beyond the perimeter zone.
Results are reported in three separate categories: the selected façade-retrofit case, the highest-sDA300/50% genome, and the best-fitness genome. The selected façade retrofit increased sDA300/50% from 49.12% for the selected 45° angled lightwell, used as the base model, to 58.03% after adding high windows and light shelves. The highest sDA300/50% genome reached 58.96%, while the best fitness genome reached 58.47%. Separating these values avoids confusion between maximum daylight performance and balanced multi-objective optimization. Energy Use Intensity decreased from 81.63 kWh/(m²·y) in the Base Case to 79.31 kWh/(m²·y) in Updated Case 1 and 63.92 kWh/(m²·y) in Updated Case 2, representing reductions of 2.85% and 21.70%, respectively.
Within the stated methodological limitations, the results demonstrate the value of integrating void- and facade-based strategies into a multi-metric daylight and comparative energy assessment workflow. Overall, the study demonstrated that integrated void and façade strategies can improve simulated daylight performance in tropical library spaces. At the same time, the main contribution is a transferable method that integrates daylight, glare, energy, and optimization into a single framework.
Funding
This research received no external funding.
Author Contributions
Conceptualization, M.S.J.A. and M.A.R.J.; methodology, M.S.J.A. and M.A.R.J.; software, M.S.J.A. and M.A.R.J.; validation, M.S.J.A.; formal analysis, M.S.J.A. and M.A.R.J.; investigation, M.S.J.A.; resources, M.S.J.A. and M.A.R.J.; data curation, M.S.J.A.; writing-original draft preparation, M.S.J.A.; writing-review and editing, M.A.R.J.; visualization, M.S.J.A. and M.A.R.J.; supervision, M.A.R.J. All authors have read and agreed to the published version of the manuscript.
Acknowledgement
The authors would like to thank Munem Shahriar Islam Shamonto for assisting with physical data collection and formatting the paper as part of his extended learning experience and research involvement. The authors also thank Solemma for providing an educational license for ClimateStudio. Special thanks are also extended to the Department of Architecture at Bangladesh University of Engineering and Technology (BUET) for granting access to multiple UNI-T UT383 Mini Light Meters for the study. During manuscript preparation, the authors used QuillBot to assist with language editing and grammar improvement of the study. The authors have reviewed and edited the output and take full responsibility for the content of this publication.
Declaration of competing interest
The authors declare no conflicts of interest.
References
- X. Cui, C.W. Ahn, Multi-Objective Optimization of Natural Lighting Design in Reading Areas of Higher Education Libraries, Buildings, 15:9 (2025) 1560 https://doi.org/10.3390/buildings15091560
- Z. Yang, Research on natural lighting in reading spaces of university libraries in Jinan under the perspective of energy-efficiency, IOP Conference Series: Earth and Environmental Science, 94 (2017) 012181. https://doi.org/10.1088/1755-1315/94/1/012181
- R.A. Mangkuto, M.D. Koerniawan, S.R. Apriliyanthi, I.H. Lubis, Atthaillah, J.L.M. Hensen, B. Paramita, Design Optimisation of Fixed and Adaptive Shading Devices on Four Façade Orientations of a High-Rise Office Building in the Tropics, Buildings, 12:1 (2022) 25. https://doi.org/10.3390/buildings12010025
- A. Rubel, M.A.R. Joarder, Performance of Shading Against West Glass Facades to Optimise Daylight, Thermal Comfort and Energy Efficiency of Office Buildings, Journal of Daylighting, 11 (2024) 131-148. https://doi.org/10.15627/jd.2024.8
- R.A. Mangkuto, F. Feradi, R.E. Putra, R.T. Atmodipoero, F. Favero, Optimisation of daylight admission based on modifications of light shelf design parameters, Journal of Building Engineering, 18 (2018) 195-209. https://doi.org/10.1016/j.jobe.2018.03.007
- S. Shoeb, M.A.R. Joarder, Daylighting and energy performance optimization of anidolic ceiling systems for tropical office buildings, Building and Environment, 265 (2024) 112032. https://doi.org/10.1016/j.buildenv.2024.112032
- N.O. Onubogu, K.K. Chong, M.H. Tan, Review of Active and Passive Daylighting Technologies for Sustainable Building, International Journal of Photoenergy, 2021 (2021) 8802691. https://doi.org/10.1155/2021/8802691
- E.T. Dean, Daylighting Design in Libraries, Libris Design Project, 2005.
- M. Arun, G. Gopan, Effects of natural light on improving the lighting and energy efficiency of buildings: toward low energy consumption and CO₂ emission, International Journal of Low-Carbon Technologies, 20 (2025) 1047-1056. https://doi.org/10.1093/ijlct/ctaf057
- U. Berardi, H.K. Anaraki, Analysis of the impacts of light shelves on the useful daylight illuminance in office buildings in Toronto, Energy Procedia, 78 (2015) 1793-1798. https://doi.org/10.1016/j.egypro.2015.11.310
- Y. Bian, Y. Ma, Analysis of daylight metrics of side-lit room in Canton, south China: A comparison between daylight autonomy and daylight factor, Energy and Buildings, 138 (2017) 347-354. https://doi.org/10.1016/j.enbuild.2016.12.059
- A.A. Ahadi, M.R. Saghafi, M. Tahbaz, The study of effective factors in daylight performance of light-wells with dynamic daylight metrics in residential buildings, Solar Energy, 155 (2017) 679-697. https://doi.org/10.1016/j.solener.2017.07.005
- A. Balanli, A. Ozturk, S.M. Vural, B. Kucukcan, University Library Buildings in Turkey: A Survey and a Case Study of Yildiz Technical University Main Library Building, Journal of Academic Librarianship, 33:6 (2007) 714-718. https://doi.org/10.1016/j.acalib.2007.09.006
- E.H. Borgstein, R. Lamberts, J.L.M. Hensen, Evaluating energy performance in non-domestic buildings: A review, Energy and Buildings, 128 (2016) 734-755. https://doi.org/10.1016/j.enbuild.2016.07.018
- P. Pilechiha, M. Mahdavinejad, F. Pour Rahimian, P. Carnemolla, S. Seyedzadeh, Multi-objective optimisation framework for designing office windows: quality of view, daylight and energy efficiency, Applied Energy, 261 (2020) 114356. https://doi.org/10.1016/j.apenergy.2019.114356
- L. Zhu, B. Wang, Y. Sun, Multi-objective optimization for energy consumption, daylighting and thermal comfort performance of rural tourism buildings in north China, Building and Environment, 176 (2020) 106841. https://doi.org/10.1016/j.buildenv.2020.106841
- T. Kazanasmaz, L.O. Grobe, C. Bauer, M. Krehel, S. Wittkopf, Three approaches to optimize optical properties and size of a south-facing window for spatial Daylight Autonomy, Building and Environment, 102 (2016) 243-256. https://doi.org/10.1016/j.buildenv.2016.03.018
- J. Ma, Q. Yang, Optimizing Annual Daylighting Performance for Atrium-Based Classrooms of Primary and Secondary Schools in Nanjing, China, Buildings, 13:1 (2023) 11. https://doi.org/10.3390/buildings13010011
- D. Plörer, S. Hammes, M. Hauer, V. Van Karsbergen, R. Pfluger, Control strategies for daylight and artificial lighting in office buildings-A bibliometrically assisted review, Energies, 14:13 (2021) 3852. https://doi.org/10.3390/en14133852
- V. Viriezky, O.C. Dewi, A.M. Dugar, Lighting Energy Reduction by Optimizing Daylight while Maintaining Cooling Load in Tropical Educational Building, Depok, Indonesia, Journal of Sustainable Architecture and Civil Engineering, 32:1 (2023) 145-161. https://doi.org/10.5755/j01.sace.32.1.32267
- BNBC, Bangladesh National Building Code, 2020
- H. Lee, S. Han, J. Seo, Light Shelf Development Using Folding Technology and Photovoltaic Modules to Increase Energy Efficiency in Building, Buildings, 12:1 (2022) 81. https://doi.org/10.3390/buildings12010081
- Y. Fang, S. Cho, Design optimization of building geometry and fenestration for daylighting and energy performance, Solar Energy, 191 (2019) 7-18. https://doi.org/10.1016/j.solener.2019.08.039
- M. Ghasemi, M.Z. Kandar, M. Noroozi, Investigating the effect of well geometry on the daylight performance in the adjoining spaces of vertical top-lit atrium buildings, Indoor and Built Environment, 25:6 (2016) 934-948. https://doi.org/10.1177/1420326X15589121
- M.A.R. Joarder, Z.N. Ahmed, A. Price, M. Mourshed, A simulation assessment of the height of light shelves to enhance daylighting quality in tropical office buildings under overcast sky conditions in Dhaka, Bangladesh, in: Proceedings of the Eleventh International IBPSA Conference, Glasgow, Scotland, 27-30 July 2009, pp. 1706-1713.
- F. Ahsan, M.A.R. Joarder, Effective Width of Light Shelf for Daylighting Classrooms Considering Different Seasons and Sky Conditions of Dhaka. 1st International Conference on Green Architecture (ICGrA, 2017): Prospects and Challenges of Going Green, 04 - 05 August 2017, Dhaka, Bangladesh.
- Z. Ferdous, M.A.R. Joarder, Adjustable Light Shelf Angles for Different Sky Conditions: Daylighting Reading Space at University Libraries in Dhaka. Proceeding of the 35th Passive and Low Energy Architecture (PLEA) Conference: Planning Post Carbon Cities. 1-3 September 2020, A Coruña, Spain. pp. 32 -37. https://doi.org/10.17979/spudc.9788497497947
- S. Sultana, M.A.R. Joarder, Optimising daylighting and energy performance in deep-plan tropical buildings: Uniform versus staggered lightwell configurations for multistory apartments, Journal of Building Engineering, 112 (2025) 113753. https://doi.org/10.1016/j.jobe.2025.113753
- A.A.S. Bahdad, S.F.S. Fadzil, Design Optimization for Light-Shelves with Regard to Daylighting Performance Improvements in the Tropics, Journal of Advanced Research in Fluid Mechanics and Thermal Sciences, 100:3 (2022) 35-50. https://doi.org/10.37934/arfmts.100.3.3550
- F. De Luca, A. Sepúlveda, T. Varjas, Multi-performance optimization of static shading devices for glare, daylight, view and energy consideration, Building and Environment, 217 (2022) 109110. https://doi.org/10.1016/j.buildenv.2022.109110
- F. Rezaei, H. Sangin, M. Heiranipour, S. Attia, A Multi-objective Optimization of Window and Light Shelf Design in Office Buildings to Improve Occupants' Thermal and Visual Comfort, Journal of Daylighting, 11 (2024) 55-68. https://doi.org/10.15627/jd.2024.4
- K. Lakhdari, L. Sriti, B. Painter, Parametric optimization of daylight, thermal and energy performance of middle school classrooms, case of hot and dry regions, Building and Environment, 204 (2021) 108173. https://doi.org/10.1016/j.buildenv.2021.108173
- A. Tabadkani, M. Valinejad Shoubi, F. Soflaei, S. Banihashemi, Integrated parametric design of adaptive façades for users' visual comfort, Automation in Construction, 106 (2019) 102857. https://doi.org/10.1016/j.autcon.2019.102857
- S.M. Hosseini, M. Heiranipour, J. Wang, L.E. Hinkle, G. Triantafyllidis, S. Attia, Enhancing Visual Comfort and Energy Efficiency in Office Lighting Using a Parametric-Generative Design Approach for Interactive Kinetic Louvers, Journal of Daylighting, 11 (2024) 69-96. https://doi.org/10.15627/jd.2024.5
- F. Mehrvarz, M. Bemanian, T. Nasr, R. Mansoori, M.F. Al-Kazee, W.A. Khudhayer, M. Mahdavinejad, Designerly Approach to Design Responsive Façade for Occupant Visual Comfort in Different Latitudes, Journal of Daylighting, 11 (2024) 149-164. https://doi.org/10.15627/jd.2024.9
- H. Özdemir, B.Y. Çakmak, Evaluation of Daylight and Glare Quality of Office Spaces with Flat and Dynamic Shading System Façades in Hot-Arid Climate, Journal of Daylighting, 9 (2022) 197-208. https://doi.org/10.15627/jd.2022.15
- D.H.W. Li, S. Lou, A. Ghaffarianhoseini, K.A. Alshaibani, J.C. Lam, A review of calculating procedures on daylight-factor-based metrics under various CIE Standard Skies and obstructed environments, Building and Environment, 112 (2017) 29-44. https://doi.org/10.1016/j.buildenv.2016.11.019
- J.Y. Suk, Luminance and vertical eye illuminance thresholds for occupants' visual comfort in daylit office environments, Building and Environment, 148 (2019) 107-115. https://doi.org/10.1016/j.buildenv.2018.10.058
- B. Liu, Y. Liu, Q. Deng, K. Hu, A study on daylighting metrics related to the subjective evaluation of daylight and visual comfort of students in China, Energy and Buildings, 287 (2023) 113001. https://doi.org/10.1016/j.enbuild.2023.113001
- Illuminating Engineering Society of North America, Approved Method: IES Spatial Daylight Autonomy (sDA) and Annual Sunlight Exposure (ASE), IES LM-83-12, Illuminating Engineering Society of North America, New York, 2012.
- International WELL Building Institute, WELL Building Standard. Available online: https://www.wellcertified.com/ (accessed 16 September 2025).
- J.L.M. Hensen, R. Lamberts (Eds.), Building Performance Simulation for Design and Operation, Spon Press, London, UK, 2011.
- L. Heschong, M. Saxena, S. Wayland, T. Perry, Daylight Metrics: PIER Daylighting Plus Research Program, California Energy Commission, Public Interest Energy Research Program, Report No. CEC-500-2012-053, 2012.
- F. Kheiri, Optimization of building fenestration and shading for climate-based daylight performance using coupled genetic algorithm and simulated annealing optimization methods, Indoor and Built Environment, 30:2 (2021) 195-214. https://doi.org/10.1177/1420326X19888008
- D.K. Kilic, D. Hasirci, Daylighting Concepts for University Libraries and Their Influences on Users' Satisfaction, Journal of Academic Librarianship, 37:6 (2011) 471-479. https://doi.org/10.1016/j.acalib.2011.07.003
- G. Kim, J.T. Kim, Healthy-daylighting design for the living environment in apartments in Korea, Building and Environment, 45:2 (2010) 287-294. https://doi.org/10.1016/j.buildenv.2009.07.018
- J.H. Lee, Y. Yoon, Y.K. Baik, S. Kim, Analyses on human responses to illuminance variations for a resident-friendly lighting environment in a small office, Indoor and Built Environment, 22:3 (2013) 535-550. https://doi.org/10.1177/1420326X12446208
- A. Tabadkani, A. Roetzel, H.X. Li, A. Tsangrassoulis, Daylight in buildings and visual comfort evaluation: The advantages and limitations, Journal of Daylighting, 8 (2021) 181-203. https://doi.org/10.15627/jd.2021.16
- C.F. Reinhart, Daylighting Handbook I: Fundamentals, Designing with the Sun, Building Technology Press, Cambridge, MA, USA, 2014.
- J. Litardo, M. Palme, R. Hidalgo-León, F. Amoroso, G. Soriano, Energy saving strategies and on-site power generation in a university building from a tropical climate, Applied Sciences, 11:2 (2021) 542. https://doi.org/10.3390/app11020542
- S. Attia, S. Bertrand, M. Cuchet, S. Yang, A. Tabadkani, Comparison of Thermal Energy Saving Potential and Overheating Risk of Four Adaptive Façade Technologies in Office Buildings, Sustainability, 14:10 (2022) 6106. https://doi.org/10.3390/su14106106
- H. Lee, S. Baek, H. Lee, A study on the application of solar modules to light shelves to improve generation and daylighting efficiency, Energy and Buildings, 261 (2022) 111976. https://doi.org/10.1016/j.enbuild.2022.111976
- C.F. Reinhart, J. Mardaljevic, Z. Rogers, Dynamic daylight performance metrics for sustainable building design, LEUKOS-Journal of Illuminating Engineering Society of North America, 3:1 (2006) 7-31. https://doi.org/10.1582/LEUKOS.2006.03.01.001
- M.A.R. Joarder, Incorporation of Therapeutic Effect of Daylight in the Architectural Design of In-Patient Rooms to Reduce Patient Length of Stay (LoS) in Hospitals, PhD thesis, Loughborough University, Loughborough, UK, 2011.
- L. Le-Thanh, H. Nguyen-Thi-Viet, J. Lee, H. Nguyen-Xuan, Machine learning-based real-time daylight analysis in buildings, Journal of Building Engineering, 52 (2022) 104374. https://doi.org/10.1016/j.jobe.2022.104374
- S. Pachauri, A. Scott, L. Scott, A. Shepherd, Energy for All: Harnessing the Power of Energy Access for Chronic Poverty Reduction, Energy Policy Guide 3, Chronic Poverty Advisory Network, London, UK, 2013.
- M. Turrin, P. von Buelow, R. Stouffs, Design explorations of performance-driven geometry in architectural design using parametric modeling and genetic algorithms, Advanced Engineering Informatics, 25:4 (2011) 656-675. https://doi.org/10.1016/j.aei.2011.07.009
- U.S. Department of Energy, EnergyPlus: Energy Simulation Software for Buildings. Available online: https://energyplus.net/ (accessed 16 September 2025).
- ASHRAE, ASHRAE Guideline 14-2014: Measurement of Energy, Demand, and Water Savings, American Society of Heating, Refrigerating and Air-Conditioning Engineers, Atlanta, GA, USA, 2014.
- J. Mardaljevic, L. Heschong, E. Lee, Daylight metrics and energy savings, Lighting Research and Technology, 41:3 (2009) 261-283. https://doi.org/10.1177/1477153509339703
- F. Jalali, A. Vargas-Nordcbeck, A Multi-Level Multi-Objective Optimization Technique for Pavement Management Systems, in: Proceedings of the 11th International Conference on Managing Pavement Assets (ICMPA 2021), 2021, pp. 1-16.
- M.A.R. Joarder, M. Hossain, A.J.E. Bach, J.P. Palutikof, F. Tonmoy, Optimization of Thermal Comfort and Energy Consumption in Bangladesh Ready-Made Garment Factories: An Approach towards the Path to Net Zero Energy Buildings, E3S Web of Conferences, 362 (2022) 11006. https://doi.org/10.1051/e3sconf/202236211006
- E. Zitzler, M. Laumanns, L. Thiele, SPEA2: Improving the Strength Pareto Evolutionary Algorithm, TIK-Report 103, Swiss Federal Institute of Technology, Zurich, Switzerland, 2001.
- R. Evins, A review of computational optimisation methods applied to sustainable building design, Renewable and Sustainable Energy Reviews, 22 (2013) 230-245. https://doi.org/10.1016/j.rser.2013.02.004
- R.T. Marler, J.S. Arora, The weighted sum method for multi-objective optimization: New insights, Structural and Multidisciplinary Optimization, 41 (2010) 853-862. https://doi.org/10.1007/s00158-009-0460-7
- P.K. Chaturvedi, N. Kumar, R. Lamba, K. Mehta, Multi-objective optimization of glazing and shading configurations for visual, thermal, and energy performance of cooling-dominant climatic regions of India, Clean Technologies and Environmental Policy, 27 (2025) 4909-4932. https://doi.org/10.1007/s10098-024-03114-4
- P. Torcellini, S. Pless, M. Deru, D. Crawley, Zero Energy Buildings: A Critical Look at the Definition, in: Proceedings of the 2006 ACEEE Summer Study on Energy Efficiency in Buildings, Long Beach, CA, USA, 14-18 August 2006, NREL/CP-550-39833.
- A.J. Marszal, P. Heiselberg, J.S. Bourrelle, E. Musall, K. Voss, I. Sartori, A. Napolitano, Zero Energy Building-A review of definitions and calculation methodologies, Energy and Buildings, 43:4 (2011) 971-979. https://doi.org/10.1016/j.enbuild.2010.12.022
- S.B. Goyal, P. Bedi, A.S. Rajawat, R.N. Shaw, A. Ghosh, Smart Luminaires for Commercial Buildings by Application of Daylight Harvesting Systems, in: A.S. Rajawat, R.N. Shaw, A. Ghosh, S. Das, S. Ghosh (Eds.), Advanced Computing and Intelligent Technologies, Lecture Notes in Networks and Systems, Springer, Singapore, 2022, pp. 293-305. https://doi.org/10.1007/978-981-16-2164-2_24
Disclaimer/Publisher’s Note: The statements, opinions and data contained in all publications are solely those of the individual author(s) and contributor(s) and not of Solarlits and/or the editor(s). Solarlits and/or the editor(s) disclaim responsibility for any injury to people or property resulting from any ideas, methods, instructions or products referred to in the content.
 Get PDF (7.63 MB)
29
Total views
Citations
SHARE ON


